

The DOI matches its Crossref record; 92 of the 92 references it cites were found in a registry or an index.
Leptin Administration Favors Muscle Mass Accretion by Decreasing FoxO3a and Increasing PGC-1α in ob/ob Mice
Open accessAbstract
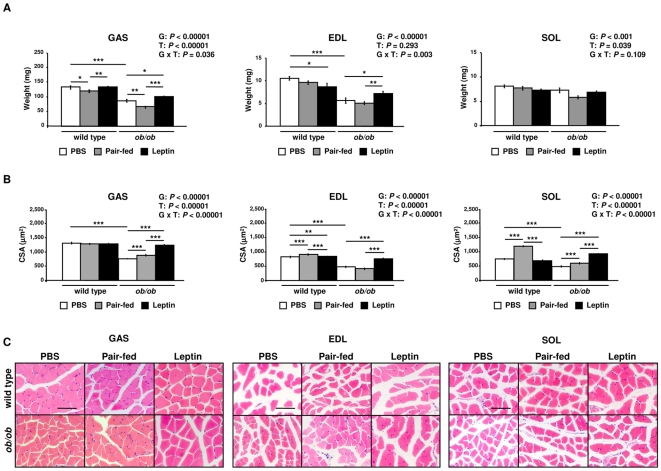
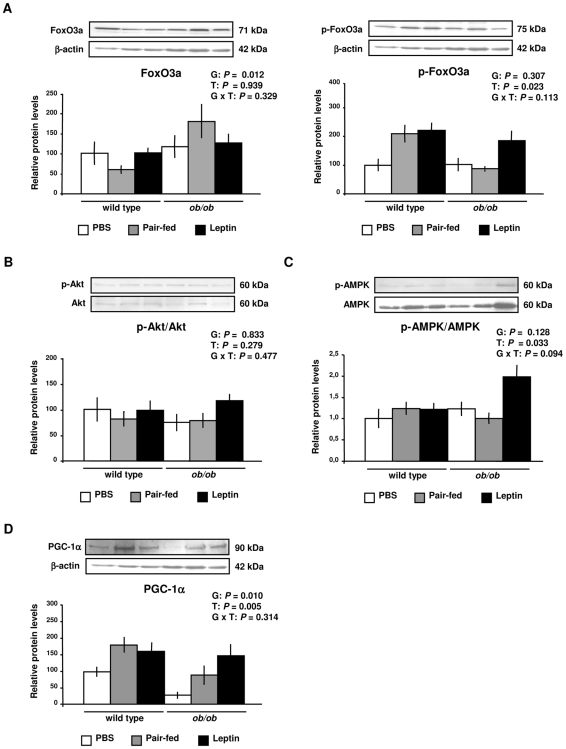
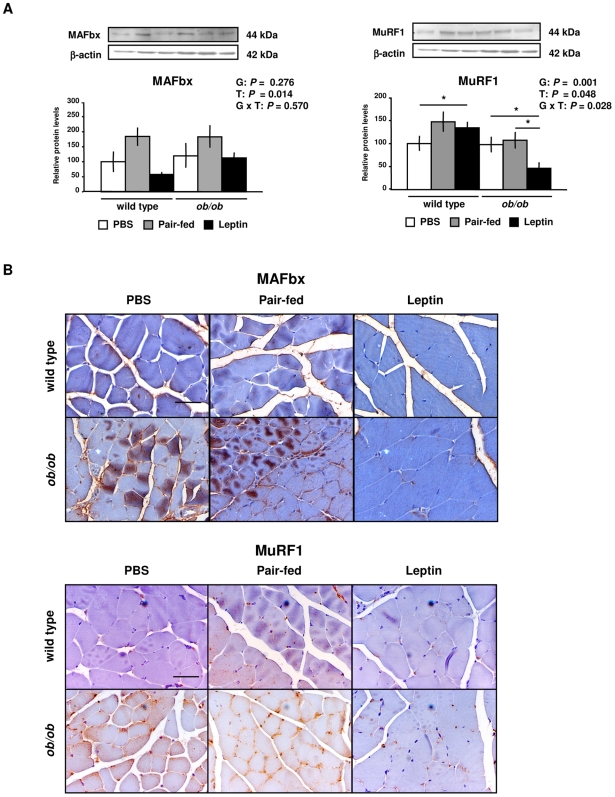
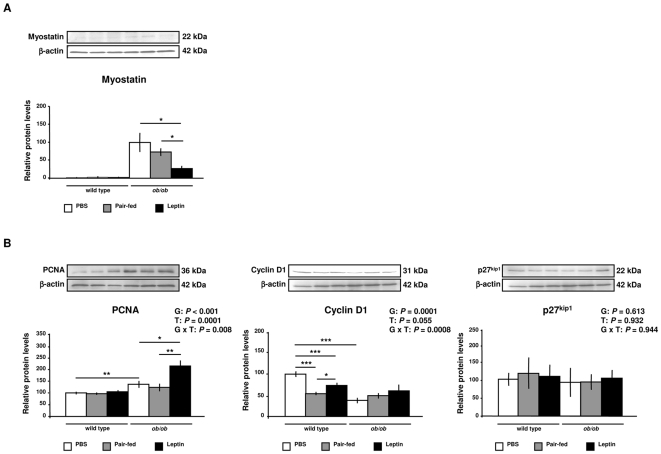
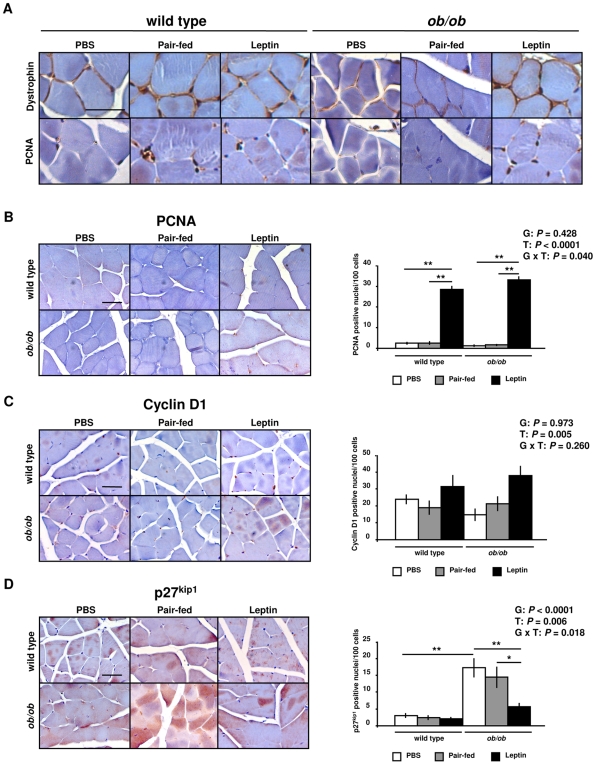
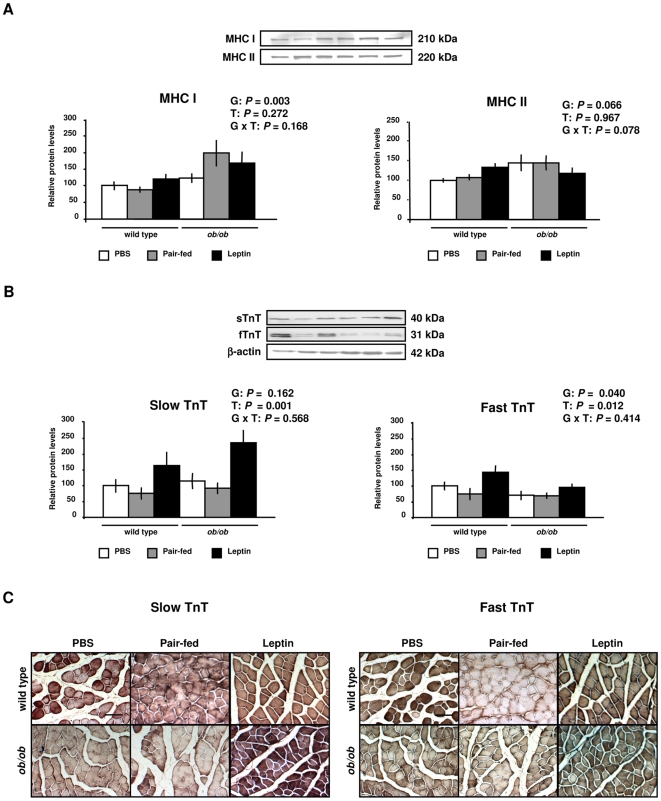
Absence of leptin has been associated with reduced skeletal muscle mass in leptin-deficient ob/ob mice. The aim of our study was to examine the effect of leptin on the catabolic and anabolic pathways regulating muscle mass. Gastrocnemius, extensor digitorum longus and soleus muscle mass as well as fiber size were significantly lower in ob/ob mice compared to wild type littermates, being significantly increased by leptin administration (P<0.001). This effect was associated with an inactivation of the muscle atrophy-related transcription factor forkhead box class O3 (FoxO3a) (P<0.05), and with a decrease in the protein expression levels of the E3 ubiquitin-ligases muscle atrophy F-box (MAFbx) (P<0.05) and muscle RING finger 1 (MuRF1) (P<0.05). Moreover, leptin increased (P<0.01) protein expression levels of peroxisome proliferator-activated receptor gamma coactivator-1alpha (PGC-1alpha), a regulator of muscle fiber type, and decreased (P<0.05) myostatin protein, a negative regulator of muscle growth. Leptin administration also activated (P<0.01) the regulators of cell cycle progression proliferating cell nuclear antigen (PCNA) and cyclin D1, and increased (P<0.01) myofibrillar protein troponin T. The present study provides evidence that leptin treatment may increase muscle mass of ob/ob mice by inhibiting myofibrillar protein degradation as well as enhancing muscle cell proliferation.
Overview
The claims and statistics of this paper haven’t been checked yet.
Run the check — free, no account needed. It reads the open-access text and checks the sources it cites.
Integrity signals
Registry
Cites
Statistics
Figures
Verification
Claims the paper makes
The claims and statistics of this paper haven’t been checked yet.
Run the check — free, no account needed. It reads the open-access text and checks the sources it cites.
Claims other papers make about this one
Each is checked against this paper’s own text: does it say what the citing paper says it does?
The check wasn’t confident either way, so it gives no verdict — never disputed.
In the citing paper
“Leptin is considered a pro-inflammatory adipokine; however, chronic exercise reduces circulating leptin levels and its associated inflammatory burden, thereby contributing to an overall anti-inflammatory phenotype in physically trained individuals”
From Exercise-Induced Muscle–Fat Crosstalk: Molecular Mediators and Their Pharmacological Modulation for the Maintenance of Metabolic Flexibility in Aging (2025) · cites this paper as [101]
Experimental — accuracy not yet measured
Self-check
Percentages, sums and reported differences re-computed from the paper’s own numbers.
The self-check needs the paper’s full text.
Citations
Cites
1 retracted
FOXO1 Regulates the Expression of 4E-BP1 and Inhibits mTOR Signaling in Mammalian Skeletal Muscle
Southgate, R. J., Neill, B., Prelovsek, O., El‐Osta, A., Kamei, Y., Miura, S., Ezaki, O., McLoughlin, T. J., Zhang, W., Unterman, T. G., et al. (2007) · Journal of Biological Chemistry · doi:10.1074/jbc.m702039200 · Cited by 112
RetractedBradford, M. M. (1976) · Analytical Biochemistry · doi:10.1016/0003-2697(76)90527-3 · Cited by 255,302
Effects of the obese Gene Product on Body Weight Regulation in ob / ob Mice
Pelleymounter, M. A., Cullen, M. J., Baker, M. B., Hecht, R., Winters, D., Boone, T., & Collins, F. (1995) · Science · doi:10.1126/science.7624776 · Cited by 4,017
Regulation of skeletal muscle mass in mice by a new TGF-p superfamily member
McPherron, A. C., Lawler, A. M., & Lee, S.-J. (1997) · Nature · doi:10.1038/387083a0 · Cited by 4,013
Identification of ubiquitin ligases required for skeletal muscle atrophy.
Bodine, S. C., Latres, E., Baumhueter, S., Lai, V. K.-M., Nunez, L., Clarke, B. A., Poueymirou, W. T., Panaro, F. J., Na, E., Dharmarajan, K., et al. (2001) · Science · doi:10.1126/science.1065874 · Cited by 3,521
Sandri, M., Sandri, C., Gilbert, A., Skurk, C., Calabria, E., Picard, A., Walsh, K., Schiaffino, S., Lecker, S. H., & Goldberg, A. L. (2004) · Cell · doi:10.1016/s0092-8674(04)00400-3 · Cited by 3,012
Glycogen synthase kinase-3β regulates cyclin D1 proteolysis and subcellular localization
Diehl, J. A., Cheng, M., Roussel, M. F., & Sherr, C. J. (1998) · Genes & Development · doi:10.1101/gad.12.22.3499 · Cited by 2,130
Stitt, T. N., Drujan, D., Clarke, B. A., Panaro, F., Timofeyva, Y., Kline, W. O., Gonzalez, M., Yancopoulos, G. D., & Glass, D. J. (2004) · Molecular Cell · doi:10.1016/s1097-2765(04)00211-4 · Cited by 1,964
FoxO3 Controls Autophagy in Skeletal Muscle In Vivo
Mammucari, C., Milan, G., Romanello, V., Masiero, E., Rudolf, R., Del Piccolo, P., Burden, S. J., Di Lisi, R., Sandri, C., Zhao, J., et al. (2007) · Cell Metabolism · doi:10.1016/j.cmet.2007.11.001 · Cited by 1,953
Atrogin-1, a muscle-specific F-box protein highly expressed during muscle atrophy
Gomes, M. D., Lecker, S. H., Jagoe, R. T., Navon, A., & Goldberg, A. L. (2001) · Proceedings of the National Academy of Sciences · doi:10.1073/pnas.251541198 · Cited by 1,774
Cited by
Sorted by citations
Transcriptional mechanisms regulating skeletal muscle differentiation, growth and homeostasis
Braun, T., & Gautel, M. (2011) · Nature Reviews Molecular Cell Biology · doi:10.1038/nrm3118 · Cited by 713
Growth and the regulation of myotomal muscle mass in teleost fish
Johnston, I. A., Bower, N. I., & Macqueen, D. J. (2011) · Journal of Experimental Biology · doi:10.1242/jeb.038620 · Cited by 494
Regulation of adipocyte lipolysis
Frühbeck, G., Méndez-Giménez, L., Fernández‐Formoso, J. A., Fernández, S., & Rodrı́guez, A. (2014) · Nutrition Research Reviews · doi:10.1017/s095442241400002x · Cited by 447
Self-citationLeptin resistance and diet-induced obesity: central and peripheral actions of leptin
Sáinź, N., Barrenetxe, J., Moreno-Aliaga, M. J., & Martínez, J. A. (2014) · Metabolism · doi:10.1016/j.metabol.2014.10.015 · Cited by 445
The muscle fiber type–fiber size paradox: hypertrophy or oxidative metabolism?
Wessel, T. V., HAAN, A. D., van der Laarse, W. J., & Jaspers, R. T. (2010) · European Journal of Applied Physiology · doi:10.1007/s00421-010-1545-0 · Cited by 303
Ilich, J. Z., Kelly, O. J., Inglis, J. E., Panton, L. B., Duque, G., & Ormsbee, M. J. (2014) · Ageing Research Reviews · doi:10.1016/j.arr.2014.02.007 · Cited by 282
The effects of obesity on skeletal muscle regeneration
Akhmedov, D., & Berdeaux, R. (2013) · Frontiers in Physiology · doi:10.3389/fphys.2013.00371 · Cited by 241
Insulin resistance and hyperinsulinaemia in the development and progression of cancer
Godsland, I. F. (2009) · Clinical Science · doi:10.1042/cs20090399 · Cited by 233
Blundell, J. E., Caudwell, P., Gibbons, C., Hopkins, M., Näslund, E., King, N. A., & Finlayson, G. (2012) · British Journal of Nutrition · doi:10.1017/s0007114511003138 · Cited by 225
Frühbeck, G., Catalán, V., Rodrı́guez, A., Ramírez, B., Becerril, S., Salvador, J., Portincasa, P., Colina, I., & Gómez‐Ambrosi, J. (2017) · Scientific Reports · doi:10.1038/s41598-017-06997-0 · Cited by 217
Self-citationBlundell, J. E., Caudwell, P., Gibbons, C., Hopkins, M., Naslund, E., King, N., & Finlayson, G. (2012) · Disease Models & Mechanisms · doi:10.1242/dmm.009837 · Cited by 208
Crosstalk between adipokines and myokines in fat browning
Rodríguez, A., Becerril, S., Ezquerro, S., Méndez-Giménez, L., & Frühbeck, G. (2016) · Acta Physiologica · doi:10.1111/apha.12686 · Cited by 196
Self-citationRecent progress toward understanding the molecular mechanisms that regulate skeletal muscle mass
Goodman, C. A., Mayhew, D. L., & Hornberger, T. A. (2011) · Cellular Signalling · doi:10.1016/j.cellsig.2011.07.013 · Cited by 183
MG53-induced IRS-1 ubiquitination negatively regulates skeletal myogenesis and insulin signalling
Yi, J.-S., Park, J. S., Ham, Y., Nguyen, N. T. B., Lee, N.-R., Hong, J. H., Kim, B.-W., Lee, H., Lee, C. S., Jeong, B., et al. (2013) · Nature Communications · doi:10.1038/ncomms3354 · Cited by 179
Sarcopenia in the elderly: basic and clinical issues
Wang, C., & Bai, L. (2012) · Geriatrics & Gerontology International · doi:10.1111/j.1447-0594.2012.00851.x · Cited by 170
Giesbertz, P., Padberg, I., Rein, D., Ecker, J., Hoefle, A. S., Spanier, B., & Daniel, H. (2015) · Diabetologia · doi:10.1007/s00125-015-3656-y · Cited by 168
Impairment of Peripheral Circadian Clocks Precedes Metabolic Abnormalities in ob/ob Mice
Ando, H., Kumazaki, M., Motosugi, Y., Ushijima, K., Maekawa, T., Ishikawa, E., & Fujimura, A. (2011) · Endocrinology · doi:10.1210/en.2010-1068 · Cited by 166
Hamrick, M. W., Herberg, S., Arounleut, P., He, H.-Z., Shiver, A. L., Qi, R.-Q., Zhou, L., Isales, C. M., & Mi, Q. (2010) · Biochemical and Biophysical Research Communications · doi:10.1016/j.bbrc.2010.08.079 · Cited by 157
Adipose tissue immunity and cancer
Catalán, V., Gómez‐Ambrosi, J., Rodríguez, A., & Frühbeck, G. (2013) · Frontiers in Physiology · doi:10.3389/fphys.2013.00275 · Cited by 140
Self-citationIrisin: A renaissance in metabolism?
Polyzos, S. A., Kountouras, J., Shields, K., & Mantzoros, C. S. (2013) · Metabolism · doi:10.1016/j.metabol.2013.04.008 · Cited by 131
Interplay of skeletal muscle and adipose tissue: sarcopenic obesity.
Park, M., & Choi, K. M. (2023) · Metabolism: Clinical and Experimental · doi:10.1016/j.metabol.2023.155577 · Cited by 106
Rodrı́guez, A., Becerril, S., Méndez-Giménez, L., Ramírez, B., Sáinź, N., Catalán, V., Gómez‐Ambrosi, J., & Frühbeck, G. (2014) · International Journal of Obesity · doi:10.1038/ijo.2014.166 · Cited by 130
Self-citationAdipose tissue protects against sepsis-induced muscle weakness in mice: from lipolysis to ketones
Goossens, C., Weckx, R., Derde, S., Dufour, T., Perre, S. V., Pauwels, L., Thiessen, S., Veldhoven, P. P. V., den Berghe, G. V., & Langouche, L. (2019) · Critical Care · doi:10.1186/s13054-019-2506-6 · Cited by 124
Molecular Mechanisms of Obesity-Induced Osteoporosis and Muscle Atrophy
Roy, B., Curtis, M. E., Fears, L., Nahashon, S. N., & Fentress, H. M. (2016) · Frontiers in Physiology · doi:10.3389/fphys.2016.00439 · Cited by 122
Pasco, J. A., Holloway‐Kew, K. L., Dobbins, A. G., Kotowicz, M. A., Williams, L. J., & Brennan-Olsen, S. L. (2014) · BMC Obesity · doi:10.1186/2052-9538-1-9 · Cited by 113
Plasma and Muscle Myostatin in Relation to Type 2 Diabetes
Brandt, C., Nielsen, A. R., Fischer, C. P., Hansen, J. B., Pedersen, B. K., & Plomgaard, P. (2012) · PLoS ONE · doi:10.1371/journal.pone.0037236 · Cited by 103
Ostler, J. E., Maurya, S. K., Dials, J., Roof, S. R., Devor, S. T., Ziolo, M. T., & Periasamy, M. (2014) · American Journal of Physiology-Endocrinology and Metabolism · doi:10.1152/ajpendo.00277.2013 · Cited by 102
Diet-induced obesity alters skeletal muscle fiber types of male but not female mice
DeNies, M. S., Johnson, J., Maliphol, A. B., Bruno, M., Kim, A., Rizvi, A., Rustici, K., & Medler, S. (2014) · Physiological Reports · doi:10.1002/phy2.204 · Cited by 94
Current and Future Pharmacologic Treatment of Sarcopenia
Rolland, Y., Onder, G., Morley, J. E., Guyonnet, S., van Kan, G. A., & Vellas, B. J. (2011) · Clinics in Geriatric Medicine · doi:10.1016/j.cger.2011.03.008 · Cited by 95
Role of hormones in sarcopenia
Priego, T., Martı́n, A. I., González‐Hedström, D., Granado, M., & López‐Calderón, A. (2021) · Vitamins and hormones · doi:10.1016/bs.vh.2020.12.021 · Cited by 103
Searching for the link between inflammaging and sarcopenia
Wang, T. (2022) · Ageing Research Reviews · doi:10.1016/j.arr.2022.101611 · Cited by 90
Irisin, a Link among Fatty Liver Disease, Physical Inactivity and Insulin Resistance
Arias, M., Ranchal, I., Romero‐Gómez, M., & Crespo, J. (2014) · International Journal of Molecular Sciences · doi:10.3390/ijms151223163 · Cited by 87
Jung, H. W., Kang, A. N., Kang, S., Park, Y., & Song, M. (2017) · Nutrients · doi:10.3390/nu9010033 · Cited by 88
Lancha, A., Rodríguez, A., Catalán, V., Becerril, S., Sáinź, N., Ramírez, B., Burrell, M. A., Salvador, J., Frühbeck, G., & Gómez‐Ambrosi, J. (2014) · PLoS ONE · doi:10.1371/journal.pone.0098398 · Cited by 86
Self-citationRole of the Cytokine-like Hormone Leptin in Muscle-bone Crosstalk with Aging
Hamrick, M. W. (2017) · Journal of Bone Metabolism · doi:10.11005/jbm.2017.24.1.1 · Cited by 77
Cameron, J. D., Sigal, R. J., Kenny, G. P., Alberga, A. S., Prud’homme, D., Phillips, P., Doucette, S. P., & Goldfield, G. S. (2016) · Applied Physiology, Nutrition, and Metabolism · doi:10.1139/apnm-2015-0479 · Cited by 80
Martı́n, A. I., Priego, T., & López‐Calderón, A. (2018) · Advances in experimental medicine and biology · doi:10.1007/978-981-13-1435-3_9 · Cited by 84
Elevated skeletal muscle irisin precursor FNDC5 mRNA in obese OLETF rats
Roberts, M. D., Bayless, D. S., Jenkins, N. T., Padilla, J., Childs, T. E., Martin, J. S., Dalbo, V. J., Booth, F. W., Rector, R. S., & Laughlin, M. H. (2013) · Metabolism · doi:10.1016/j.metabol.2013.02.002 · Cited by 73
Fuentes, E. N., Safian, D., Einarsdottir, I. E., Valdés, J. A., Elorza, Á. A., Molina, A., & Björnsson, B. T. (2013) · General and Comparative Endocrinology · doi:10.1016/j.ygcen.2013.02.009 · Cited by 72
Pathophysiology of sarcopenia: Genetic factors and their interplay with environmental factors
Aslam, M. A., Ma, E. B., & Huh, J. Y. (2023) · Metabolism · doi:10.1016/j.metabol.2023.155711 · Cited by 76
Frühbeck, G., Catalán, V., Rodrı́guez, A., Ramírez, B., Becerril, S., Portincasa, P., & Gómez‐Ambrosi, J. (2017) · Scientific Reports · doi:10.1038/s41598-017-02848-0 · Cited by 73
Self-citationRodrı́guez, A., Moreno‐Castellanos, N., Balaguer, I., Méndez-Giménez, L., Becerril, S., Catalán, V., Gómez‐Ambrosi, J., Portincasa, P., Calamita, G., Soveral, G., et al. (2015) · Scientific Reports · doi:10.1038/srep12067 · Cited by 68
Self-citationFunctional Relationship between Leptin and Nitric Oxide in Metabolism
Becerril, S., Rodrı́guez, A., Catalán, V., Ramírez, B., Unamuno, X., Portincasa, P., Gómez‐Ambrosi, J., & Frühbeck, G. (2019) · Nutrients · doi:10.3390/nu11092129 · Cited by 71
Self-citationBower, N. I., & Johnston, I. A. (2010) · Physiological Genomics · doi:10.1152/physiolgenomics.00065.2010 · Cited by 70
Sharma, S., Pathak, S., Gupta, G., Sharma, S. K., Singh, L., Sharma, R. K., Mishra, A., & Dua, K. (2017) · Biomedicine & Pharmacotherapy · doi:10.1016/j.biopha.2017.02.048 · Cited by 67
Xiang, L., Nakamura, Y., Lim, Y., Yamasaki, Y., Kurokawa-Nose, Y., Maruyama, W., Osawa, T., Matsuura, A., Motoyama, N., & Tsuda, L. (2011) · Aging · doi:10.18632/aging.100396 · Cited by 67
Peripheral signalling involved in energy homeostasis control
Lancha, A., Frühbeck, G., & Gómez‐Ambrosi, J. (2012) · Nutrition Research Reviews · doi:10.1017/s0954422412000145 · Cited by 66
Self-citationRole of aquaglyceroporins and caveolins in energy and metabolic homeostasis
Méndez-Giménez, L., Rodrı́guez, A., Balaguer, I., & Frühbeck, G. (2014) · Molecular and Cellular Endocrinology · doi:10.1016/j.mce.2014.06.017 · Cited by 61
Self-citationTam, E. M. S., Liu, Z., Lam, T. P., Ting, T., Cheung, G., Ng, B. K. W., Lee, S. K. M., Qiu, Y., & Cheng, J. C. Y. (2015) · Spine · doi:10.1097/brs.0000000000001376 · Cited by 60
Leptin mediates the regulation of muscle mass and strength by adipose tissue
Collins, K. H., Gui, C., Ely, E. V., Lenz, K. L., Harris, C. A., Guilak, F., & Meyer, G. A. (2022) · The Journal of Physiology · doi:10.1113/jp283034 · Cited by 54
Vamvini, M. T., Aronis, K. N., Chamberland, J. P., & Mantzoros, C. S. (2011) · The Journal of Clinical Endocrinology & Metabolism · doi:10.1210/jc.2011-1665 · Cited by 53
Fré, C. H. D., Fré, M. A. D., Kwanten, W. J., Op de Beeck, B., Gaal, L. F. V., & Francque, S. (2018) · Obesity Reviews · doi:10.1111/obr.12776 · Cited by 53
Sáinź, N., Rodrı́guez, A., Catalán, V., Becerril, S., Ramírez, B., Gómez‐Ambrosi, J., & Frühbeck, G. (2010) · Mediators of Inflammation · doi:10.1155/2010/784343 · Cited by 51
Self-citationSarcopenia and cachexia: molecular mechanisms and therapeutic interventions
Wang, T., Zhou, D., & Hong, Z. (2025) · MedComm · doi:10.1002/mco2.70030 · Cited by 46
Arounleut, P., Bowser, M., Upadhyay, S. K., Shi, X., Fulzele, S., Johnson, M. H., Stranahan, A. M., Hill, W., Isales, C. M., & Hamrick, M. W. (2013) · PLoS ONE · doi:10.1371/journal.pone.0072330 · Cited by 49
Becerril, S., Rodríguez, A., Catalán, V., Méndez-Giménez, L., Ramírez, B., Sáinź, N., Llorente, M., Unamuno, X., Gómez‐Ambrosi, J., & Frühbeck, G. (2018) · International Journal of Obesity · doi:10.1038/s41366-018-0005-5 · Cited by 48
Self-citationDifferential control of muscle mass in type 1 and type 2 diabetes mellitus
Sala, D., & Antonio Zorzano, A. (2015) · Cellular and Molecular Life Sciences · doi:10.1007/s00018-015-1954-7 · Cited by 45
The role of endocrine hormones in the pathogenesis of adolescent idiopathic scoliosis
Liang, Z., Guo, C., Li, J., & Zhang, H. (2021) · The FASEB Journal · doi:10.1096/fj.202100759r · Cited by 41
Tero-Vescan, A., Degens, H., Matsakas, A., Ștefănescu, R., Ősz, B. E., & Slevin, M. (2025) · Pharmaceuticals · doi:10.3390/ph18081222 · Cited by 44
Adipokines in healthy skeletal muscle and metabolic disease
Coles, C. A. (2016) · Advances in experimental medicine and biology · doi:10.1007/978-3-319-27511-6_6 · Cited by 39
Xu, X., Dong, Z., Li, Y., Yang, Y., Zeng, Y., Qu, X., & Kong, B. (2012) · The International Journal of Biochemistry & Cell Biology · doi:10.1016/j.biocel.2012.12.010 · Cited by 38
A Pegylated Leptin Antagonist Ameliorates CKD-Associated Cachexia in Mice
Cheung, W. W., Ding, W. Q., Gunta, S. S., Gu, Y., Tabakman, R., Klapper, L. N., Gertler, A., & MAK, R. H. K. (2013) · Journal of the American Society of Nephrology · doi:10.1681/asn.2013040432 · Cited by 39
Wilhelmsen, A., Tsintzas, K., & Jones, S. W. (2021) · GeroScience · doi:10.1007/s11357-021-00322-4 · Cited by 42
Vankrunkelsven, W., Derde, S., Gunst, J., Perre, S. V., Declerck, E., Pauwels, L., Derese, I., den Berghe, G. V., & Langouche, L. (2022) · Journal of Cachexia Sarcopenia and Muscle · doi:10.1002/jcsm.12904 · Cited by 37
Is sprint exercise a leptin signaling mimetic in human skeletal muscle?
Guerra, B., Olmedillas, H., Guadalupe‐Grau, A., Ponce‐González, J. G., Morales‐Álamo, D., Fuentes, T., Chapinal, E., Fernández‐Pérez, L., de Pablos-Velasco, P. L., Santana, A., et al. (2011) · Journal of Applied Physiology · doi:10.1152/japplphysiol.00805.2010 · Cited by 34
Effect of Food Restriction and Leptin Supplementation on Fetal Programming in Mice
Pennington, K. A., Harper, J. L., Sigafoos, A. N., Beffa, L. M., Carleton, S. M., Phillips, C. L., & Schulz, L. C. (2012) · Endocrinology · doi:10.1210/en.2012-1119 · Cited by 34
Role of Adipokines in Sarcopenia
Lu, W., Feng, W., Lai, J., Yuan, D., Xiao, W., & Li, Y. (2023) · Chinese Medical Journal · doi:10.1097/cm9.0000000000002255 · Cited by 34
Olmedillas, H., Sanchis‐Moysi, J., Fuentes, T., Guadalupe‐Grau, A., Ponce‐González, J. G., Morales‐Álamo, D., Santana, A., Dorado, C., Calbet, J. A. L., & Guerra, B. (2009) · European Journal of Applied Physiology · doi:10.1007/s00421-009-1281-5 · Cited by 32
Galve, A., Burgos, C., Silio, L. F., Varona, L., Rodríguez, C., Óvilo, C., & López‐Buesa, P. (2012) · Livestock Science · doi:10.1016/j.livsci.2012.01.010 · Cited by 34
Unravelling the role of fatty acid metabolism in cancer through the FOXO3-FOXM1 axis
Saavedra-García, P., Nichols, K., Mahmud, Z., Fan, L. Y.-N., & Lam, E. W. ‐. (2017) · Molecular and Cellular Endocrinology · doi:10.1016/j.mce.2017.01.012 · Cited by 32
Guo, Q., Luo, Q., & Song, G. (2024) · Journal of Cachexia Sarcopenia and Muscle · doi:10.1002/jcsm.13440 · Cited by 35
Neuronal control of bone and muscle
Houweling, P. J., Kulkarni, R. N., & Baldock, P. A. J. (2015) · Bone · doi:10.1016/j.bone.2015.05.006 · Cited by 30
Impact of adipokines and myokines on fat browning
Rodríguez, A., Catalán, V., Ramírez, B., Unamuno, X., Portincasa, P., Gómez‐Ambrosi, J., Frühbeck, G., & Becerril, S. (2020) · Journal of Physiology and Biochemistry · doi:10.1007/s13105-020-00736-2 · Cited by 31
Self-citationCarroll, A. M. (2012) · Frontiers in Genetics · doi:10.3389/fgene.2011.00099 · Cited by 29
Brinkoetter, M. T., Magkos, F., Vamvini, M. T., & Mantzoros, C. S. (2011) · American Journal of Physiology-Endocrinology and Metabolism · doi:10.1152/ajpendo.00146.2011 · Cited by 28
Stucchi, P., Guzmán‐Ruiz, R., Gil‐Ortega, M., Merino, B., Somoza, B., Cano, V., de Castro, J., Sevillano, J., Ramos, P., Fernández‐Alfonso, M. S., et al. (2011) · Biochimie · doi:10.1016/j.biochi.2011.06.020 · Cited by 27
Sáinź, N., Rodrı́guez, A., Catalán, V., Becerril, S., Ramírez, B., Lancha, A., Burgos‐Ramos, E., Gómez‐Ambrosi, J., & Frühbeck, G. (2012) · PLoS ONE · doi:10.1371/journal.pone.0029389 · Cited by 27
Self-citationKao, T., Peng, T., Chen, W., Chi, Y., Chen, C., & Yang, W. (2021) · Journal of Inflammation Research · doi:10.2147/jir.s335694 · Cited by 25
Leptin signaling in skeletal muscle after bed rest in healthy humans
Guerra, B., Ponce‐González, J. G., Morales‐Álamo, D., Guadalupe‐Grau, A., Kiilerich, K., Fuentes, T., Ringholm, S., Biensø, R. S., Santana, A., Lundby, C., et al. (2013) · European Journal of Applied Physiology · doi:10.1007/s00421-013-2779-4 · Cited by 25
Borg, M. L., Massart, J., De Castro Barbosa, T., Archilla‐Ortega, A., Smith, J. A. B., Lanner, J. T., Alsina‐Fernandez, J., Yaden, B., Culver, A. E., Karlsson, H. K. R., et al. (2021) · Journal of Cachexia, Sarcopenia and Muscle · doi:10.1002/jcsm.12746 · Cited by 23
Liang, Z., & Zhang, L. (2026) · Frontiers in Pharmacology · doi:10.3389/fphar.2026.1733798 · Cited by 32
Musculoskeletal deterioration in men accompanies increases in body fat
Pasco, J. A., Gould, H., Brennan-Olsen, S. L., Nicholson, G. C., & Kotowicz, M. A. (2013) · Obesity · doi:10.1002/oby.20496 · Cited by 24
Anorexia, undernutrition, weight loss, sarcopenia, and cachexia of aging
Hao, R., & Guo, H. W. (2012) · European Review of Aging and Physical Activity · doi:10.1007/s11556-012-0103-7 · Cited by 26
The bone-muscle unit: from mechanical coupling to soluble factors-mediated signaling
Malvandi, A. M., Gerosa, L., Banfi, G., & Lombardi, G. (2025) · Molecular Aspects of Medicine · doi:10.1016/j.mam.2025.101367 · Cited by 22
Skeletal Lipocalin-2 Is Associated with Iron-Related Oxidative Stress in ob/ob Mice with Sarcopenia
Choi, E. B., Jeong, J. H., Jang, H. M., Ahn, Y. J., Kim, K. H., An, H. S., Lee, J. Y., Jeong, E. A., Lee, J., Shin, H. J., et al. (2021) · Antioxidants · doi:10.3390/antiox10050758 · Cited by 21
Disturbed energy metabolism after lung and heart transplantation
Førli, L., Bollerslev, J., Simonsen, S., Isaksen, G. A., Godang, K., Pripp, A. H., & Bjørtuft, Ø. (2010) · Clinical Transplantation · doi:10.1111/j.1399-0012.2010.01379.x · Cited by 22
Altarejos, J. Y., Pangilinan, J., Podgrabinska, S., Akıncı, B., Foss‐Freitas, M. C., Neidert, A., Ray, Y., Zheng, W., Kim, S., Kamat, V., et al. (2023) · Science Translational Medicine · doi:10.1126/scitranslmed.add4897 · Cited by 21
Yang, J., Bromage, T. G., Zhao, Q., Xu, B. H., Gao, W. L., Tian, H. F., Tang, H. J., Liu, D. W., & Zhao, X. (2011) · PLoS ONE · doi:10.1371/journal.pone.0019833 · Cited by 20
The therapeutic potential of GPR43: a novel role in modulating metabolic health
Cornall, L. M., Mathai, M. L., Hryciw, D. H., & McAinch, A. J. (2013) · Cellular and Molecular Life Sciences · doi:10.1007/s00018-013-1419-9 · Cited by 18
Li, W., Qiu, L., Guan, J., Sun, Y., Zhao, J., & Du, . (2022) · BMC Genomics · doi:10.1186/s12864-022-08857-2 · Cited by 18
Upregulated Expression of AQP 7 in the Skeletal Muscles of Obese ob/ob Mice
Wakayama, Y., Hirako, S., Ogawa, T., Jimi, T., & Shioda, S. (2014) · ACTA HISTOCHEMICA ET CYTOCHEMICA · doi:10.1267/ahc.13032 · Cited by 18
Gysel, T., Tonoli, C., Pardaens, S., Cambier, D. C., Kaufman, J.-M., Zmierczak, H.-G., Goemaere, S., Lapauw, B., & Calders, P. (2016) · Europe PMC (PubMed Central) · Cited by 18
The crosstalk between BAT thermogenesis and skeletal muscle dysfunction
Chen, Y., Hu, Q., Wang, C., & Wang, T. (2023) · Frontiers in Physiology · doi:10.3389/fphys.2023.1132830 · Cited by 16
iNOS Gene Ablation Prevents Liver Fibrosis in Leptin-Deficient ob/ob Mice
Becerril, S., Rodrı́guez, A., Catalán, V., Ramírez, B., Unamuno, X., Gómez‐Ambrosi, J., & Frühbeck, G. (2019) · Genes · doi:10.3390/genes10030184 · Cited by 17
Self-citationPark, A., Battaglino, R. A., Nguyen, N. M. H., & Morse, L. R. (2018) · PLoS ONE · doi:10.1371/journal.pone.0198969 · Cited by 16
Schlitt, J. M., & Schulz, L. C. (2011) · Endocrine · doi:10.1007/s12020-011-9548-0 · Cited by 15
Long-Term PGC1β Overexpression Leads to Apoptosis, Autophagy and Muscle Wasting
Sopariwala, D. H., Yadav, V., Badin, P.-M., Likhite, N., Sheth, M., Lorca, S., Vila, I. K., Kim, E. R., Tong, Q., Song, M. S., et al. (2017) · Scientific Reports · doi:10.1038/s41598-017-10238-9 · Cited by 14
Kawao, N., Ishida, M., & Kaji, H. (2019) · PLoS ONE · doi:10.1371/journal.pone.0224403 · Cited by 13
Brzóska, E., Kalkowski, L., Kowalski, K., Michalski, P., Kowalczyk, P., Mierzejewski, B., Walczak, P., Ciemerych, M. A., & Janowski, M. (2019) · Stem Cells and Development · doi:10.1089/scd.2019.0073 · Cited by 12
Dunisławska, A., Siwek, M. Z., Sławińska, A., Lepczyński, A., Herosimczyk, A., Kolodziejski, P. A., & Bednarczyk, M. F. (2020) · Animals · doi:10.3390/ani10040687 · Cited by 12
Metadata
- Authors
- Sáinz, N., Rodríguez, A., Catalán, V., Becerril, S., Ramírez, B., Gómez-Ambrosi, J., & Frühbeck, G.
- Affiliations
- Instituto de Salud Carlos III (ES)
- Corresponding author
- Frühbeck, Gema
- Venue
- PLoS ONE
- Publisher
- Public Library of Science (PLoS)
- Published
- 2009-09-04
- Volume
- 4
- Issue
- 9
- Pages
- e6808
- ISSN
- 1932-6203 (ISSN-L)
- PMC
- PMC2733298
- OpenAlex
- W2002233417
- Cited by
- 135
- References
- 92
- Citations by year
- 2026: 3 · 2025: 8 · 2024: 3 · 2023: 7 · 2022: 5 · 2021: 7 · 2020: 6 · 2019: 7 · 2018: 6 · 2017: 10 · 2016: 6 · 2015: 7 · 2014: 13 · 2013: 15 · 2012: 11
- FWCI
- 4.30
- Type
- journal article
- Language
- en
- Open access
- gold
- doi.org
- Locations
- PLoS ONE (publishedVersion, cc-by)
- PubMed Central (publishedVersion, cc-by)
- PubMed (publishedVersion)
- Deposito Adademico Digital Universidad De Navarra (University of Navarra) (submittedVersion, other-oa)
- DOAJ (DOAJ: Directory of Open Access Journals) (submittedVersion, cc-by-sa)
- Figshare (submittedVersion, cc-by)
- Funders
- Centro de Investigación Biomédica en Red-Fisiopatología de la Obesidad y Nutrición
- Gobierno de Navarra
- Instituto de Salud Carlos III
- Topics
- Life Sciences › Biochemistry, Genetics and Molecular Biology › Molecular Biology › Muscle Physiology and Disorders
- Health Sciences › Nursing › Nutrition and Dietetics › Muscle metabolism and nutrition
- Life Sciences › Neuroscience › Endocrine and Autonomic Systems › Regulation of Appetite and Obesity
- Keywords
- leptin, ob/ob mice, FOXO3, PGC-1α, atrogin-1, MuRF1, myostatin, muscle atrophy, muscle fiber type, myofibrillar protein degradation, muscle cell proliferation, cyclin D1, proliferating cell nuclear antigen, troponin T, skeletal muscle
- MeSH terms
- Peroxisome Proliferator-Activated Receptor Gamma Coactivator 1-alpha, Forkhead Box Protein O3, Animals, Male, Mice, Inbred C57BL, Muscles, Transcription Factors, Trans-Activators, Proliferating Cell Nuclear Antigen, Cyclin D1, Troponin T, Oligonucleotide Array Sequence Analysis, Leptin, Gene Expression Profiling, Cell Proliferation, Mice, Forkhead Transcription Factors, Myostatin
About these checks
Registry, retraction, Cites and statistics results are computed, not judged, with one exception: a printed reference that no index lists is read once by a model before it counts as a citation error. Claims are extracted by a model and kept only when their quote appears verbatim in the text; each cited source is then checked, with a model’s help, for whether it says what the claim relies on. Those verdicts can be wrong — read the claim’s quote and the cited source before relying on one.
Statistics and arithmetic are recomputed, not judged.
Confidence bands are shown only for fields calibrated on our annotated test set. None is calibrated yet, so no band is shown.
What counts as a claim ›How we measure confidence ›How we check this ›
Are you an author, or do you see a problem with this page? Request a review
