

The DOI matches its Crossref record; 6 of the 6 references it cites were found in a registry or an index.
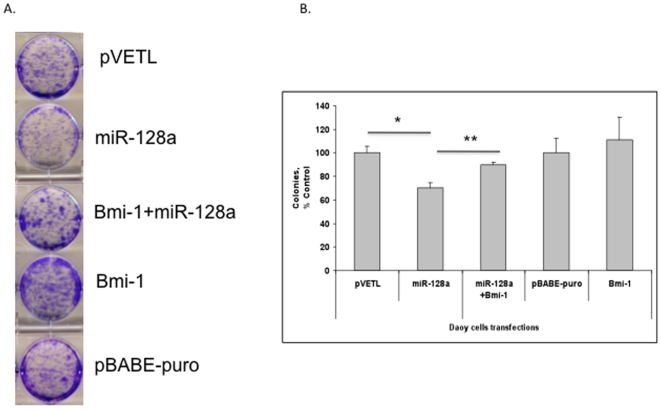
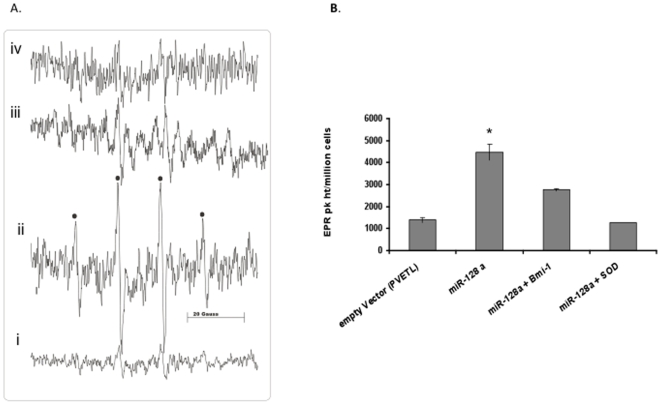
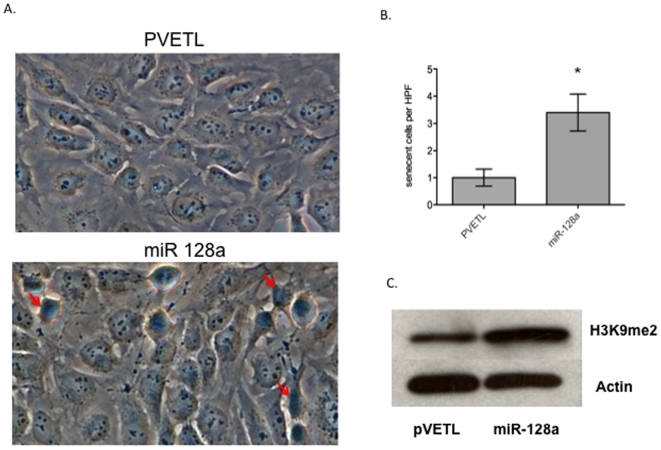
MicroRNA 128a Increases Intracellular ROS Level by Targeting Bmi-1 and Inhibits Medulloblastoma Cancer Cell Growth by Promoting Senescence
Overview
The claims and statistics of this paper haven’t been checked yet.
Run the check — free, no account needed. It reads the open-access text and checks the sources it cites.
Integrity signals
Registry
Cites
Statistics
Figures
Verification
Claims the paper makes
The claims and statistics of this paper haven’t been checked yet.
Run the check — free, no account needed. It reads the open-access text and checks the sources it cites.
Claims other papers make about this one
Each is checked against this paper’s own text: does it say what the citing paper says it does?
In the citing paper
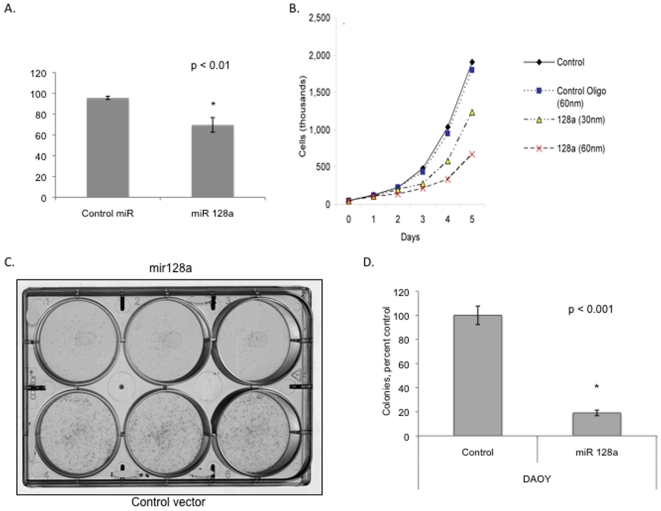
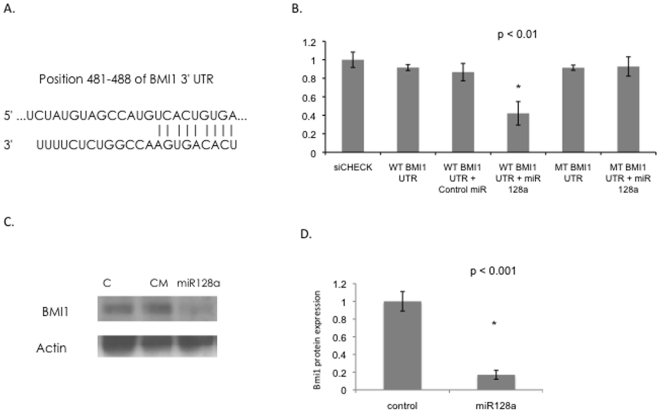
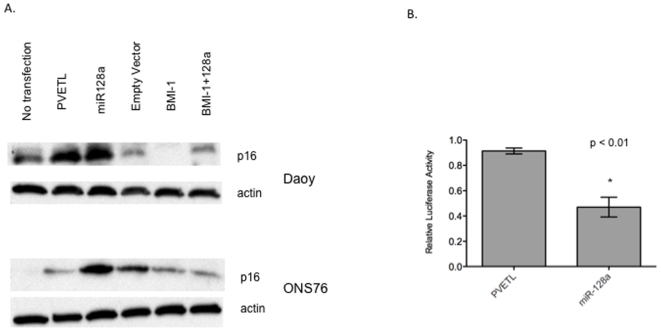
“Reintroducing miR-128-3p into medulloblastoma cells inhibited their growth in vitro by increasing the level of reactive oxygen species (ROS) and promoting cellular senescence through targeting a proto-oncogene BMI1 (B cell-specific Moloney murine leukemia virus integration site 1).82”
From MiR-128-3p – a gray eminence of the human central nervous system (2024) · cites this paper as [82]
In the citing paper
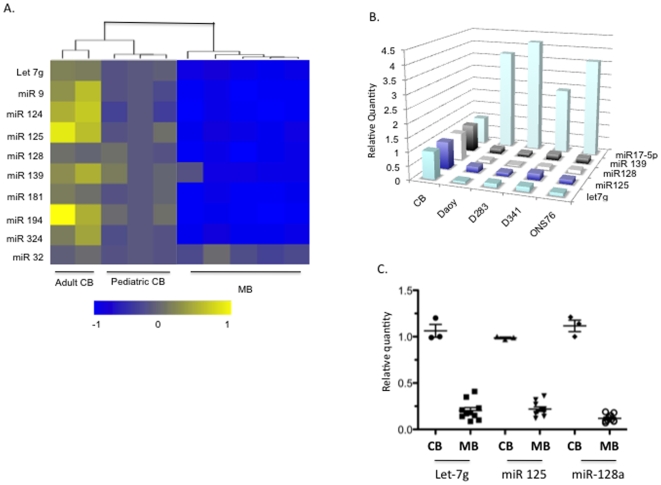
“In this tumor type, miR-128-3p is severely suppressed compared with the normal cerebellum.”
From MiR-128-3p – a gray eminence of the human central nervous system (2024) · cites this paper as [82]
Self-check
Percentages, sums and reported differences re-computed from the paper’s own numbers.
The self-check needs the paper’s full text.
Citations
Cites
The functions of animal microRNAs
Ambros, V. (2004) · Nature · doi:10.1038/nature02871 · Cited by 10,728
Combinatorial microRNA target predictions
Krek, A., Grün, D., Poy, M. N., Wolf, R., Rosenberg, L., Epstein, E. J., MacMenamin, P., da Piedade, I., Gunsalus, K. C., Stoffel, M., et al. (2005) · Nature Genetics · doi:10.1038/ng1536 · Cited by 4,603
Association of reactive oxygen species levels and radioresistance in cancer stem cells
Diehn, M., Cho, R. W., Lobo, N. A., Kalisky, T., Dorie, M. J., Kulp, A. N., Qian, D., Lam, J. S., Ailles, L. E., Wong, M., et al. (2009) · Nature · doi:10.1038/nature07733 · Cited by 2,555
Jacobs, J. J. L., Kieboom, K., Marino, S., DePinho, R. A., & van Lohuizen, M. (1999) · Nature · doi:10.1038/16476 · Cited by 1,580
Sempere, L. F., Freemantle, S., Pitha-Rowe, I., Moss, E., Dmitrovsky, E., & Ambros, V. (2004) · Genome Biology · doi:10.1186/gb-2004-5-3-r13 · Cited by 1,578
Bmi1 regulates mitochondrial function and the DNA damage response pathway
Liu, J., Cao, L., Chen, J., Song, S., Lee, I. H., Quijano, C., Liu, H., Keyvanfar, K., Chen, H., Cao, L.-Y., et al. (2009) · Nature · doi:10.1038/nature08040 · Cited by 474
Research works printed but not linked: 32
- JT Rutka, 2004, Advances in the treatment of pediatric brain tumors., Expert Rev Neurother, 4, 879, 10.1586/14737175.4.5.879 · DOI
- RK Mulhern, 2005, Neurocognitive consequences of risk-adapted therapy for childhood medulloblastoma., J Clin Oncol, 23, 5511, 10.1200/JCO.2005.00.703 · DOI
- SK Singh, 2004, Identification of human brain tumour initiating cells., Nature, 432, 396, 10.1038/nature03128 · DOI
- R Wechsler-Reya, 2001, The developmental biology of brain tumors., Annu Rev Neurosci, 24, 385, 10.1146/annurev.neuro.24.1.385 · DOI
- JB Rubin, 2002, Medulloblastoma: a problem of developmental biology., Cancer Cell, 2, 7, 10.1016/S1535-6108(02)00090-9 · DOI
- A Lee, 2005, Isolation of neural stem cells from the postnatal cerebellum., Nat Neurosci, 8, 723, 10.1038/nn1473 · DOI
- S Marino, 2005, Medulloblastoma: developmental mechanisms out of control., Trends Mol Med, 11, 17, 10.1016/j.molmed.2004.11.008 · DOI
- E Ferretti, 2009, MicroRNA profiling in human medulloblastoma., Int J Cancer, 124, 568, 10.1002/ijc.23948 · DOI
- PA Northcott, 2009, The miR-17/92 polycistron is up-regulated in sonic hedgehog-driven medulloblastomas and induced by N-myc in sonic hedgehog-treated cerebellar neural precursors., Cancer Res, 69, 3249, 10.1158/0008-5472.CAN-08-4710 · DOI
- J Pierson, 2008, Regulation of cyclin dependent kinase 6 by microRNA 124 in medulloblastoma., J Neurooncol, 90, 1, 10.1007/s11060-008-9624-3 · DOI · Paper page
- T Du, 2005, microPrimer: the biogenesis and function of microRNA., Development, 132, 4645, 10.1242/dev.02070 · DOI
- AJ Giraldez, 2005, MicroRNAs regulate brain morphogenesis in zebrafish., Science, 308, 833, 10.1126/science.1109020 · DOI · Paper page
- L He, 2005, A microRNA polycistron as a potential human oncogene., Nature, 435, 828, 10.1038/nature03552 · DOI
- S Costinean, 2006, Pre-B cell proliferation and lymphoblastic leukemia/high-grade lymphoma in E(mu)-miR155 transgenic mice., Proc Natl Acad Sci U S A, 103, 7024, 10.1073/pnas.0602266103 · DOI
- J Lu, 2005, MicroRNA expression profiles classify human cancers., Nature, 435, 834, 10.1038/nature03702 · DOI
- MS Kumar, 2007, Impaired microRNA processing enhances cellular transformation and tumorigenesis., Nat Genet, 39, 673, 10.1038/ng2003 · DOI
- MF Corsten, 2007, MicroRNA-21 knockdown disrupts glioma growth in vivo and displays synergistic cytotoxicity with neural precursor cell delivered S-TRAIL in human gliomas., Cancer Res, 67, 8994, 10.1158/0008-5472.CAN-07-1045 · DOI · Paper page
- J Silber, 2008, miR-124 and miR-137 inhibit proliferation of glioblastoma multiforme cells and induce differentiation of brain tumor stem cells., BMC Med, 6, 14, 10.1186/1741-7015-6-14 · DOI · Paper page
- T Uziel, 2009, The miR-17∼92 cluster collaborates with the Sonic Hedgehog pathway in medulloblastoma., Proc Natl Acad Sci U S A, 106, 2812, 10.1073/pnas.0809579106 · DOI
- MC Thompson, 2006, Genomics identifies medulloblastoma subgroups that are enriched for specific genetic alterations., J Clin Oncol, 24, 1924, 10.1200/JCO.2005.04.4974 · DOI
- A Grimson, 2007, MicroRNA Targeting Specificity in Mammals: Determinants beyond Seed Pairing., Mol Cell, 27, 91, 10.1016/j.molcel.2007.06.017 · DOI · Paper page
- J Godlewski, 2008, Targeting of the Bmi-1 oncogene/stem cell renewal factor by microRNA-128 inhibits glioma proliferation and self-renewal., Cancer Res, 68, 9125, 10.1158/0008-5472.CAN-08-2629 · DOI · Paper page
- AV Molofsky, 2003, Bmi-1 dependence distinguishes neural stem cell self-renewal from progenitor proliferation., Nature, 425, 962, 10.1038/nature02060 · DOI
- C Leung, 2004, Bmi1 is essential for cerebellar development and is overexpressed in human medulloblastomas., Nature, 428, 337, 10.1038/nature02385 · DOI
- D Mihic-Probst, 2007, Consistent expression of the stem cell renewal factor BMI-1 in primary and metastatic melanoma., Int J Cancer, 121, 1764, 10.1002/ijc.22891 · DOI
- AV Molofsky, 2005, Bmi-1 promotes neural stem cell self-renewal and neural development but not mouse growth and survival by repressing the p16Ink4a and p19Arf senescence pathways., Genes Dev, 19, 1432, 10.1101/gad.1299505 · DOI
- T Finkel, 1999, Signal transduction by reactive oxygen species in non-phagocytic cells., J Leukoc Biol, 65, 337, 10.1002/jlb.65.3.337 · DOI
- GM Rosen, 1984, Detection of superoxide generated by endothelial cells., Proc Natl Acad Sci U S A, 81, 7269, 10.1073/pnas.81.23.7269 · DOI
- T Lu, 2008, Free radicals and senescence., Exp Cell Res, 314, 1918, 10.1016/j.yexcr.2008.01.011 · DOI · Paper page
- YS Song, 2005, Dinstinct ROS and biochemical profiles in cells undergoing DNA damage-induced senescence and apoptosis., Mech Ageing Dev, 126, 580, 10.1016/j.mad.2004.11.008 · DOI
- E Hara, 1996, Regulation of p16CDKN2 expression and its implications for cell immortalization and senescence., Mol Cell Biol, 16, 859, 10.1128/MCB.16.3.859 · DOI · Paper page
- R Vibhakar, 2007, Dickkopf-1 is an epigenetically silenced candidate tumor suppressor gene in medulloblastoma., Neuro-oncol, 9, 135, 10.1215/15228517-2006-038 · DOI
Cited by
Sorted by citations
Adlakha, Y. K., & Saini, N. (2014) · Molecular Cancer · doi:10.1186/1476-4598-13-33 · Cited by 213
Policastro, L. L., Ibañez, I. L., Notcovich, C., Duran, H. A., & Podhajcer, O. L. (2013) · Antioxidants & Redox Signaling · doi:10.1089/ars.2011.4367 · Cited by 120
MicroRNA controls of cellular senescence
Suh, N. (2018) · BMB Reports · doi:10.5483/bmbrep.2018.51.10.209 · Cited by 78
MicroRNAs, Long Non-Coding RNAs, and Circular RNAs in the Redox Control of Cell Senescence
Lettieri-Barbato, D., Aquilano, K., Punziano, C., Minopoli, G., & Faraonio, R. (2022) · Antioxidants · doi:10.3390/antiox11030480 · Cited by 51
Genovesi, L. A., Anderson, D., Carter, K. W., Giles, K. M., & Dallas, P. B. (2012) · BMC Research Notes · doi:10.1186/1756-0500-5-507 · Cited by 23
MiR-128-3p – a gray eminence of the human central nervous system
Kiel, K., Król, S. K., Bronisz, A., & Godlewski, J. (2024) · Molecular Therapy Nucleic Acids · doi:10.1016/j.omtn.2024.102141 · Cited by 15
Metadata
- Authors
- Venkataraman, S., Alimova, I., Fan, R., Harris, P., Foreman, N., & Vibhakar, R.
- Venue
- PLoS ONE
- Publisher
- Public Library of Science (PLoS)
- Published
- 2010-06-21
- Volume
- 5
- Issue
- 6
- Pages
- e10748
- ISSN
- 1932-6203
- PMC
- PMC2888574
- Cited by
- 156
- References
- 6
- Language
- en
About these checks
Registry, retraction, Cites and statistics results are computed, not judged, with one exception: a printed reference that no index lists is read once by a model before it counts as a citation error. Claims are extracted by a model and kept only when their quote appears verbatim in the text; each cited source is then checked, with a model’s help, for whether it says what the claim relies on. Those verdicts can be wrong — read the claim’s quote and the cited source before relying on one.
Statistics and arithmetic are recomputed, not judged.
Confidence bands are shown only for fields calibrated on our annotated test set. None is calibrated yet, so no band is shown.
What counts as a claim ›How we measure confidence ›How we check this ›
Are you an author, or do you see a problem with this page? Request a review
