

The DOI matches its Crossref record; 84 of the 86 references it cites were found in a registry or an index.
Multiple Indices of Diffusion Identifies White Matter Damage in Mild Cognitive Impairment and Alzheimer’s Disease
Open accessAbstract
The study of multiple indices of diffusion, including axial (DA), radial (DR) and mean diffusion (MD), as well as fractional anisotropy (FA), enables WM damage in Alzheimer's disease (AD) to be assessed in detail. Here, tract-based spatial statistics (TBSS) were performed on scans of 40 healthy elders, 19 non-amnestic MCI (MCIna) subjects, 14 amnestic MCI (MCIa) subjects and 9 AD patients. Significantly higher DA was found in MCIna subjects compared to healthy elders in the right posterior cingulum/precuneus. Significantly higher DA was also found in MCIa subjects compared to healthy elders in the left prefrontal cortex, particularly in the forceps minor and uncinate fasciculus. In the MCIa versus MCIna comparison, significantly higher DA was found in large areas of the left prefrontal cortex. For AD patients, the overlap of FA and DR changes and the overlap of FA and MD changes were seen in temporal, parietal and frontal lobes, as well as the corpus callosum and fornix. Analysis of differences between the AD versus MCIna, and AD versus MCIa contrasts, highlighted regions that are increasingly compromised in more severe disease stages. Microstructural damage independent of gross tissue loss was widespread in later disease stages. Our findings suggest a scheme where WM damage begins in the core memory network of the temporal lobe, cingulum and prefrontal regions, and spreads beyond these regions in later stages. DA and MD indices were most sensitive at detecting early changes in MCIa.
Overview
The claims and statistics of this paper haven’t been checked yet.
Run the check — free, no account needed. It reads the open-access text and checks the sources it cites.
Integrity signals
Registry
Cites
Statistics
Figures
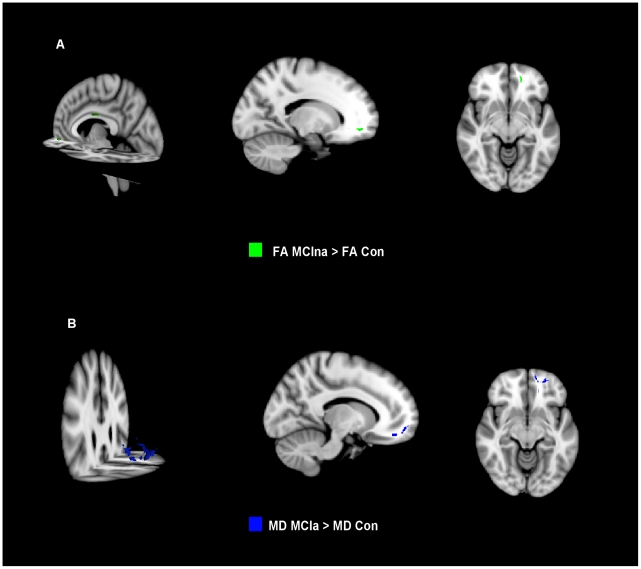
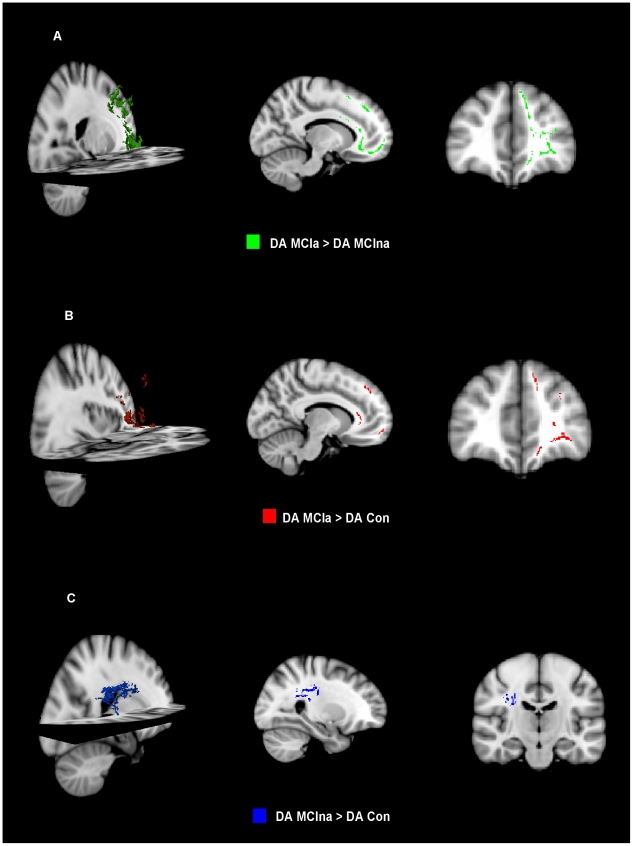
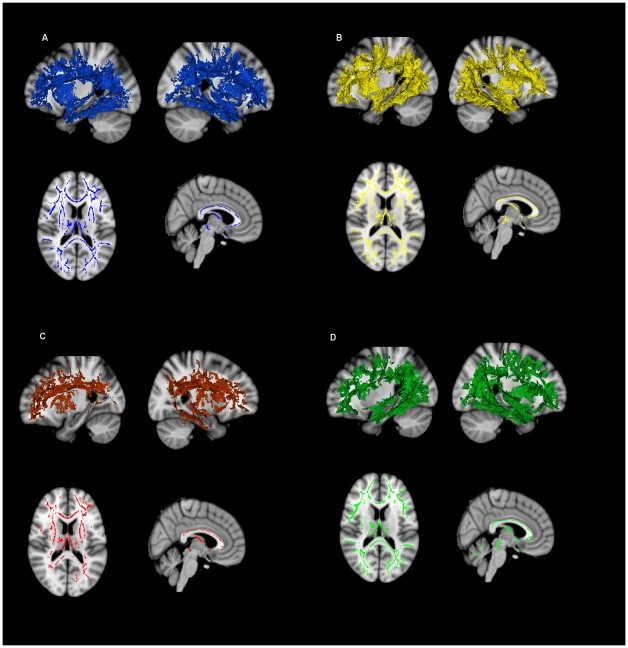
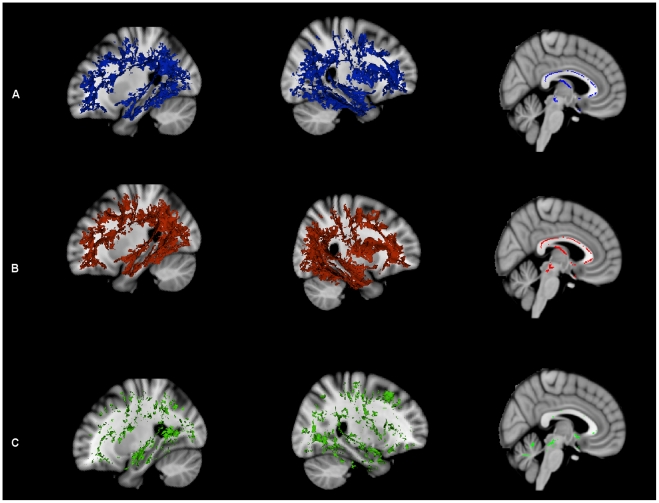
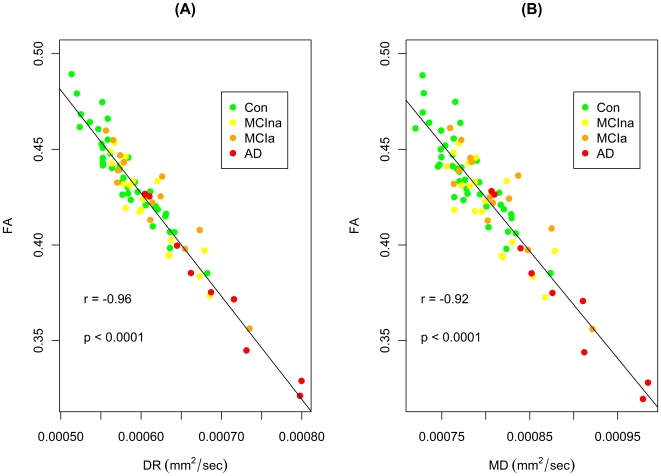
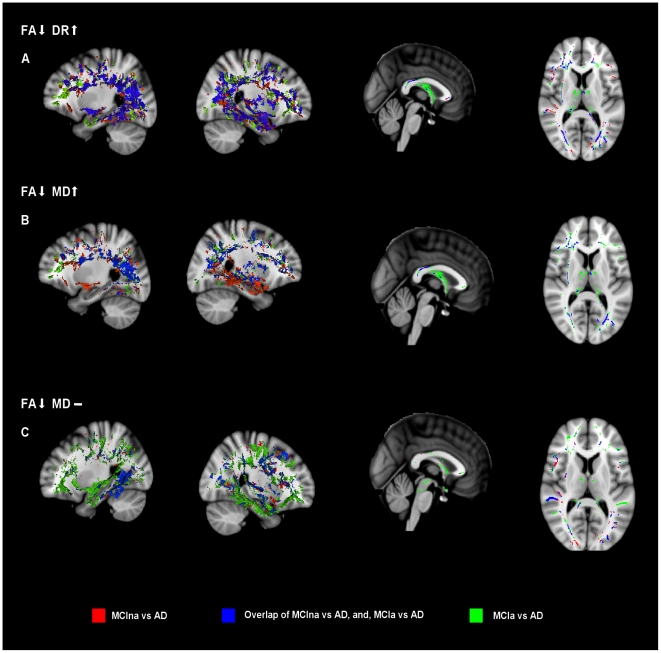
Verification
Claims the paper makes
The claims and statistics of this paper haven’t been checked yet.
Run the check — free, no account needed. It reads the open-access text and checks the sources it cites.
Claims other papers make about this one
Each is checked against this paper’s own text: does it say what the citing paper says it does?
The source backs part of the claim, not all of it — or backs it for a different population, condition or comparison.
In the citing paper
“but AxDDTI may be more sensitive to unspecific microscopic cellular loss earlier in the disease (O’Dwyer et al., 2011), perhaps making it more sensitive in the healthier participants of the ADNI3 dataset.”
From Diffusion MRI Indices and Their Relation to Cognitive Impairment in Brain Aging: The Updated Multi-protocol Approach in ADNI3 (2019) · cites this paper as O’Dwyer et al., 2011
Experimental — accuracy not yet measured
Self-check
Percentages, sums and reported differences re-computed from the paper’s own numbers.
The self-check needs the paper’s full text.
Citations
Cites
Folstein, M. F., Folstein, S. E., & McHugh, P. R. (1975) · Journal of Psychiatric Research · doi:10.1016/0022-3956(75)90026-6 · Cited by 88,282
McKhann, G., Drachman, D., Folstein, M., Katzman, R., Price, D., & Stadlan, E. M. (1984) · Neurology · doi:10.1212/wnl.34.7.939 · Cited by 27,915
Neuropathological stageing of Alzheimer-related changes.
Braak, H., & Braak, E. (1991) · Acta Neuropathologica · doi:10.1007/bf00308809 · Cited by 16,123
Advances in functional and structural MR image analysis and implementation as FSL
Smith, S. M., Jenkinson, M., Woolrich, M. W., Beckmann, C. F., Behrens, T. E. J., Johansen-Berg, H., Bannister, P. R., De Luca, M., Drobnjak, I., Flitney, D. E., et al. (2004) · NeuroImage · doi:10.1016/j.neuroimage.2004.07.051 · Cited by 13,630
Fast robust automated brain extraction
Smith, S. M. (2002) · Human Brain Mapping · doi:10.1002/hbm.10062 · Cited by 10,496
Mild cognitive impairment as a diagnostic entity
Petersen, R. C. (2004) · Journal of Internal Medicine · doi:10.1111/j.1365-2796.2004.01388.x · Cited by 7,864
Tract-based spatial statistics: Voxelwise analysis of multi-subject diffusion data
Smith, S. M., Jenkinson, M., Johansen‐Berg, H., Rueckert, D., Nichols, T. E., Mackay, C. E., Watkins, K. E., Ciccarelli, O., Cader, M. Z., Matthews, P. M., et al. (2006) · NeuroImage · doi:10.1016/j.neuroimage.2006.02.024 · Cited by 6,598
Nonparametric permutation tests for functional neuroimaging: A primer with examples
Nichols, T. E., & Holmes, A. P. (2002) · Human Brain Mapping · doi:10.1002/hbm.1058 · Cited by 6,256
MR signal abnormalities at 1.5 T in Alzheimer's dementia and normal aging
Fazekas, F., Chawluk, J. B., Alavi, A. A., Hurtig, H. I., & Zimmerman, R. A. (1987) · American Journal of Roentgenology · doi:10.2214/ajr.149.2.351 · Cited by 5,327
SMITH, S., & NICHOLS, T. (2009) · NeuroImage · doi:10.1016/j.neuroimage.2008.03.061 · Cited by 5,250
Research works printed but not linked: 1
- AZ Burzynska, 2010, Age-related differences in white matter microstructure: region-specific patterns of diffusivity., Neuroimage, 49, 2104, 10.1016/j.neuroimage.2009.09.041 · DOI
Cited by
Sorted by citations
Brain atrophy in Alzheimer’s Disease and aging
Pini, L., Pievani, M., Bocchetta, M., Altomare, D., Bosco, P., Cavedo, E., Galluzzi, S., Marizzoni, M., & Frisoni, G. B. (2016) · Ageing Research Reviews · doi:10.1016/j.arr.2016.01.002 · Cited by 836
Effectiveness of regional DTI measures in distinguishing Alzheimer’s disease, MCI, and normal aging
Nir, T. M., Jahanshad, N., Villalon-Reina, J. E., Toga, A. W., Jack, C. R., Weiner, M. W., & Thompson, P. M. (2013) · NeuroImage: Clinical · doi:10.1016/j.nicl.2013.07.006 · Cited by 348
Amlien, I. K., & Fjell, A. M. (2014) · Neuroscience · doi:10.1016/j.neuroscience.2014.02.017 · Cited by 219
Alzheimer disease: new concepts on its neurobiology and the clinical role imaging will play
Jack, C. R. (2012) · Radiology · doi:10.1148/radiol.12110433 · Cited by 211
Relevance of Magnetic Resonance Imaging for Early Detection and Diagnosis of Alzheimer Disease
Teipel, S. J., Grothe, M. J., Lista, S., Toschi, N., Garaci, F., & Hampel, H. J. (2013) · Medical Clinics of North America · doi:10.1016/j.mcna.2012.12.013 · Cited by 198
Self-citation
Metadata
- Authors
- O'Dwyer, L., Lamberton, F., Bokde, A. L. W., Ewers, M., Faluyi, Y. O., Tanner, C., Mazoyer, B., O'Neill, D., Bartley, M., Collins, D. R., Coughlan, T., Prvulovic, D., & Hampel, H.
- Affiliations
- Centre National de la Recherche Scientifique (FR)
- Trinity College Dublin (IE)
- San Francisco VA Medical Center (US)
- Cambridgeshire and Peterborough NHS Foundation Trust (GB)
- Goethe University Frankfurt (DE)
- Venue
- PLoS ONE
- Publisher
- Public Library of Science (PLoS)
- Published
- 2011-06-30
- Volume
- 6
- Issue
- 6
- Pages
- e21745
- ISSN
- 1932-6203 (ISSN-L)
- PMC
- PMC3128090
- OpenAlex
- W2111813385
- Cited by
- 119
- References
- 86
- Citations by year
- 2026: 1 · 2025: 5 · 2024: 2 · 2023: 9 · 2022: 5 · 2021: 6 · 2020: 7 · 2019: 7 · 2018: 4 · 2017: 10 · 2016: 8 · 2015: 10 · 2014: 10 · 2013: 19 · 2012: 14
- FWCI
- 10.77
- Type
- journal article
- Language
- en
- Open access
- gold
- doi.org
- Locations
- PLoS ONE (publishedVersion, cc-by)
- PubMed Central (publishedVersion, cc-by)
- PubMed (publishedVersion)
- Arrow@dit (Dublin Institute of Technology) (submittedVersion, cc-by-nc-sa)
- HAL (submittedVersion)
- DOAJ (DOAJ: Directory of Open Access Journals) (submittedVersion, cc-by-sa)
- Publication Server of Goethe University Frankfurt am Main (Goethe University Frankfurt) (submittedVersion, cc-by)
- Funders
- Irish Research Council for Science, Engineering and Technology
- Science Foundation Ireland (08/IN.1/B1846)
- Irish Research Council
- Topics
- Health Sciences › Medicine › Radiology, Nuclear Medicine and Imaging › Advanced Neuroimaging Techniques and Applications
- Health Sciences › Medicine › Psychiatry and Mental health › Dementia and Cognitive Impairment Research
- Life Sciences › Neuroscience › Cellular and Molecular Neuroscience › Alzheimer's disease research and treatments
- Keywords
- white matter injury, mild cognitive impairment, Alzheimer's disease, diffusion MRI, axial diffusion, radial diffusion, fractional anisotropy, tract-based spatial statistics, posterior cingulum, precuneus, prefrontal cortex, uncinate fasciculus, forceps minor, fornix, corpus callosum, temporal lobe, memory networks, disease progression
- MeSH terms
- Aged, Alzheimer Disease, Female, Humans, Male, Middle Aged, Diffusion Magnetic Resonance Imaging, Cognitive Dysfunction
About these checks
Registry, retraction, Cites and statistics results are computed, not judged, with one exception: a printed reference that no index lists is read once by a model before it counts as a citation error. Claims are extracted by a model and kept only when their quote appears verbatim in the text; each cited source is then checked, with a model’s help, for whether it says what the claim relies on. Those verdicts can be wrong — read the claim’s quote and the cited source before relying on one.
Statistics and arithmetic are recomputed, not judged.
Confidence bands are shown only for fields calibrated on our annotated test set. None is calibrated yet, so no band is shown.
What counts as a claim ›How we measure confidence ›How we check this ›
Are you an author, or do you see a problem with this page? Request a review
