

The DOI matches its Crossref record; 78 of the 82 references it cites were found in a registry or an index.
The Regulation of Skeletal Muscle Protein Turnover during the Progression of Cancer Cachexia in the ApcMin/+ Mouse
Open accessAbstract
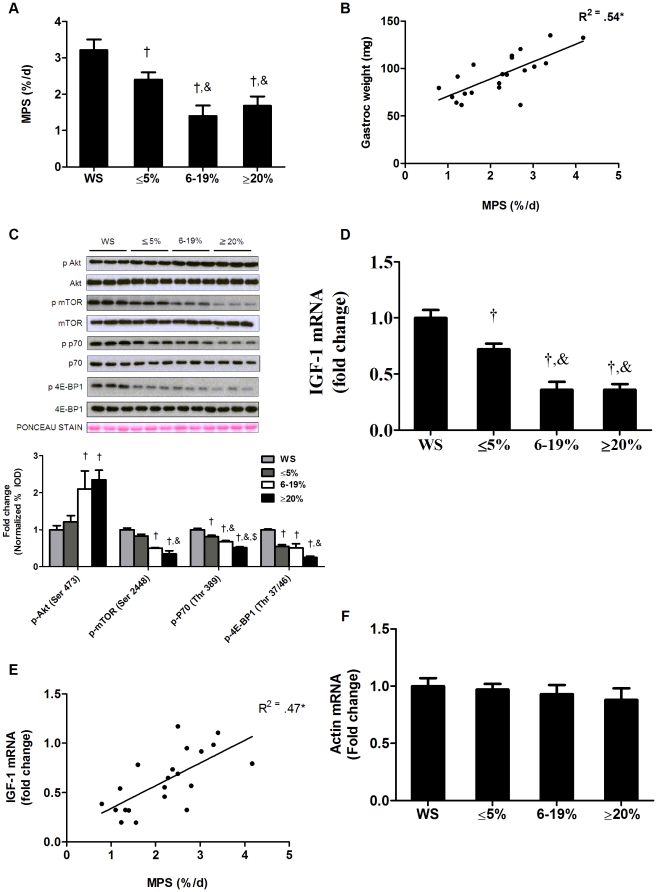
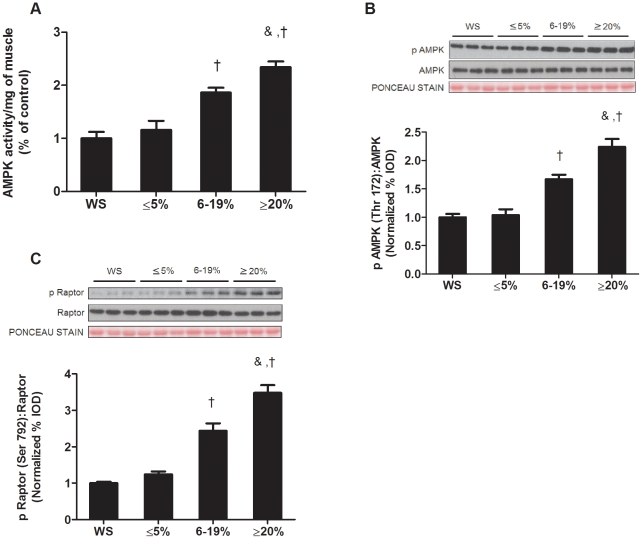
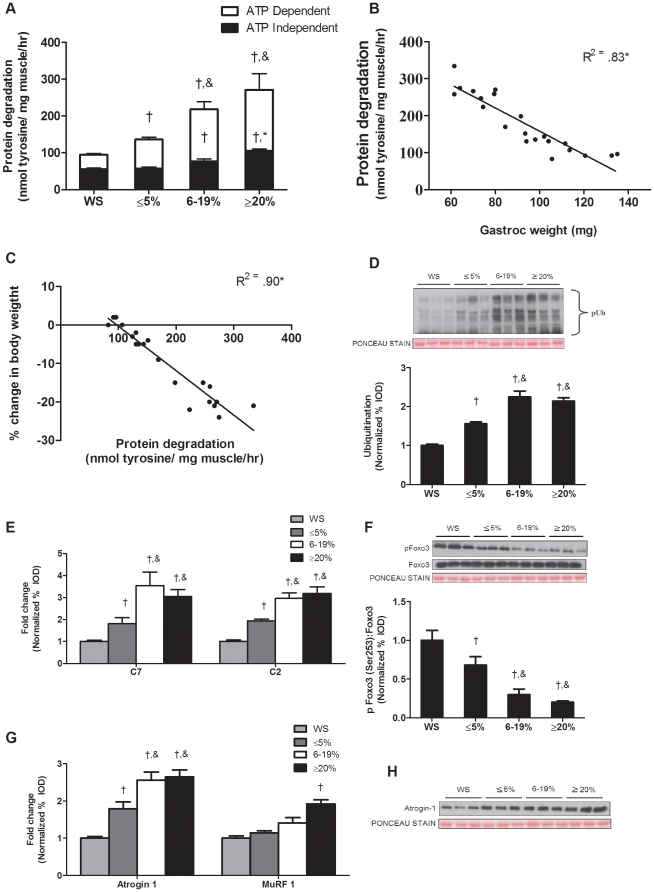
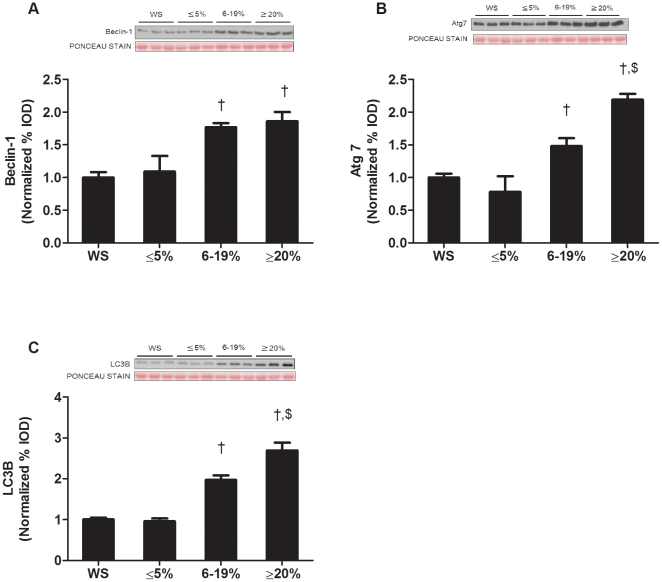
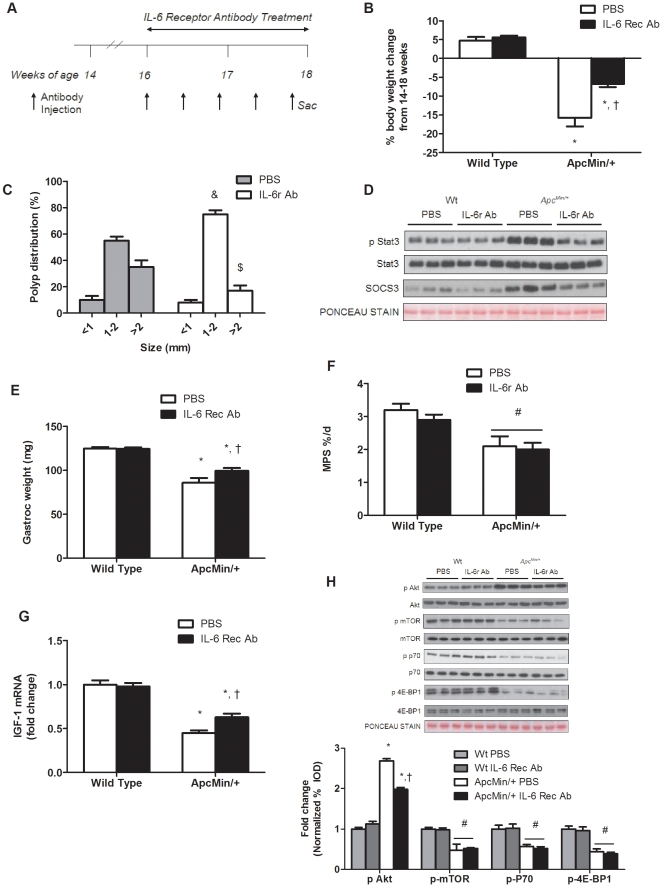
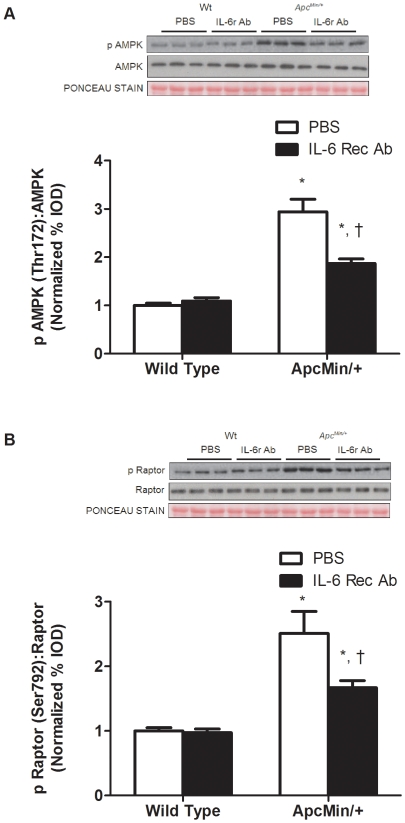
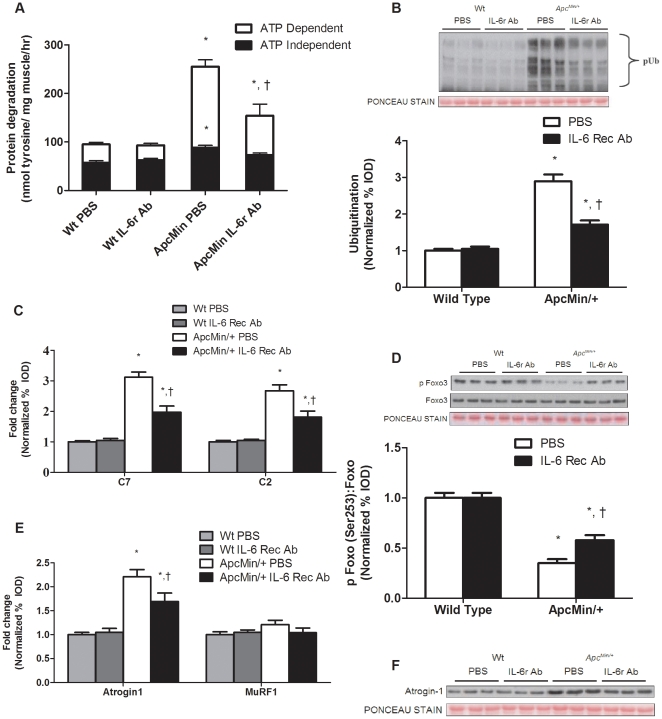
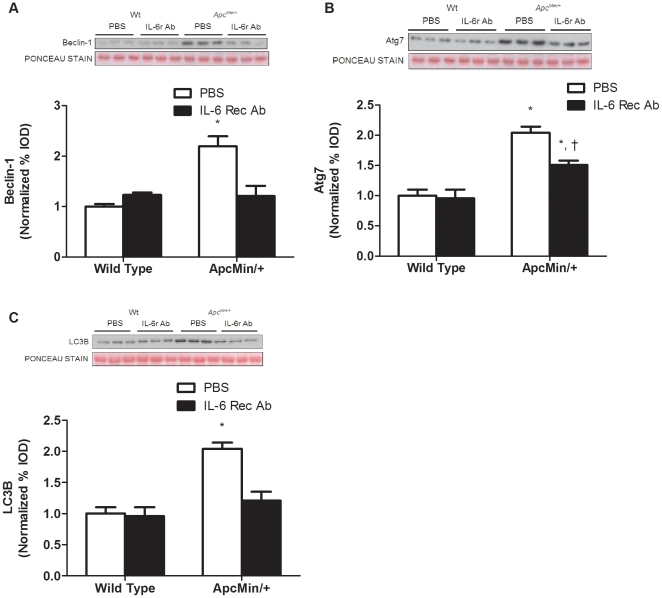
Muscle wasting that occurs with cancer cachexia is caused by an imbalance in the rates of muscle protein synthesis and degradation. The Apc(Min/+) mouse is a model of colorectal cancer that develops cachexia that is dependent on circulating IL-6. However, the IL-6 regulation of muscle protein turnover during the initiation and progression of cachexia in the Apc(Min/+) mouse is not known. Cachexia progression was studied in Apc(Min/+) mice that were either weight stable (WS) or had initial (≤5%), intermediate (6-19%), or extreme (≥20%) body weight loss. The initiation of cachexia reduced %MPS 19% and a further ∼50% with additional weight loss. Muscle IGF-1 mRNA expression and mTOR targets were suppressed with the progression of body weight loss, while muscle AMPK phosphorylation (Thr 172), AMPK activity, and raptor phosphorylation (Ser 792) were not increased with the initiation of weight loss, but were induced as cachexia progressed. ATP dependent protein degradation increased during the initiation and progression of cachexia. However, ATP independent protein degradation was not increased until cachexia had progressed beyond the initial phase. IL-6 receptor antibody administration prevented body weight loss and suppressed muscle protein degradation, without any effect on muscle %MPS or IGF-1 associated signaling. In summary, the %MPS reduction during the initiation of cachexia is associated with IGF-1/mTOR signaling repression, while muscle AMPK activation and activation of ATP independent protein degradation occur later in the progression of cachexia. IL-6 receptor antibody treatment blocked cachexia progression through the suppression of muscle protein degradation, while not rescuing the suppression of muscle protein synthesis. Attenuation of IL-6 signaling was effective in blocking the progression of cachexia, but not sufficient to reverse the process.
Overview
The claims and statistics of this paper haven’t been checked yet.
Run the check — free, no account needed. It reads the open-access text and checks the sources it cites.
Integrity signals
Registry
Cites
Statistics
Figures
Verification
Claims the paper makes
The claims and statistics of this paper haven’t been checked yet.
Run the check — free, no account needed. It reads the open-access text and checks the sources it cites.
Claims other papers make about this one
Each is checked against this paper’s own text: does it say what the citing paper says it does?
The source backs part of the claim, not all of it — or backs it for a different population, condition or comparison.
In the citing paper
“The link between IL-6/STAT3 signaling and muscle and adipose tissue wasting is well established in mouse models of cachexia (White et al., 2011; Silva et al., 2015) and has been reinforced preliminarily in clinical studies.”
From Targeting Janus Kinases and Signal Transducer and Activator of Transcription 3 To Treat Inflammation, Fibrosis, and Cancer: Rationale, Progress, and Caution (2020) · cites this paper as White et al., 2011
Experimental — accuracy not yet measured
Self-check
Percentages, sums and reported differences re-computed from the paper’s own numbers.
The self-check needs the paper’s full text.
Citations
Cites
Bradford, M. M. (1976) · Analytical Biochemistry · doi:10.1016/0003-2697(76)90527-3 · Cited by 255,302 · cited 1×
“Briefly, frozen gastrocnemius muscle was homogenized in Mueller buffer and protein concentration determined by the Bradford method [49].”
TSC2 Mediates Cellular Energy Response to Control Cell Growth and Survival
Inoki, K., Zhu, T., & Guan, K.-L. (2003) · Cell · doi:10.1016/s0092-8674(03)00929-2 · Cited by 3,914 · cited 1×
“AMPK activation can reduce muscle mTOR signaling and protein synthesis [60,61,62] through multiple mechanisms, including activation of TSC2 [23,63], direct inhibition of mTOR itself [64], or inhibition of raptor [23].”
AMPK Phosphorylation of Raptor Mediates a Metabolic Checkpoint
Gwinn, D. M., Shackelford, D. B., Egan, D. F., Mihaylova, M. M., Mery, A., Vasquez, D. S., Turk, B. E., & Shaw, R. J. (2008) · Molecular Cell · doi:10.1016/j.molcel.2008.03.003 · Cited by 3,849 · cited 4×
“AMPK can inhibit mTOR signaling through several mechanisms, including phosphorylation of raptor at Ser792 [23], which prevent binding and subsequent phosphorylation of p70S6K and 4EBP1.”
InfluentialKim, D., Sarbassov, D. D., Ali, S. M., King, J. E., Latek, R. R., Erdjument‐Bromage, H., Tempst, P., & Sabatini, D. M. (2002) · Cell · doi:10.1016/s0092-8674(02)00808-5 · Cited by 3,051 · cited 1×
“Raptor acts as a scaffolding protein to recruit downstream targets of mTOR, S6K and 4EBP1 [65,66].”
Sandri, M., Sandri, C., Gilbert, A., Skurk, C., Calabria, E., Picard, A., Walsh, K., Schiaffino, S., Lecker, S. H., & Goldberg, A. L. (2004) · Cell · doi:10.1016/s0092-8674(04)00400-3 · Cited by 3,012 · cited 1×
“IGF-1 signaling can also regulate muscle protein degradation through the suppression of forkhead box O (FOXO), whose transcriptional targets include muscle atrogin-1/MAFbx, Muscle RING Finger-1 (MuRF1) and autophagy-related genes [16,17,18].”
Evans, W., Morley, J., Argilés, J., Bales, C., Baracos, V., Guttridge, D., Jatoi, A., Kalantar-zadeh, K., Lochs, H., Mantovani, G., et al. (2008) · Clinical Nutrition · doi:10.1016/j.clnu.2008.06.013 · Cited by 2,341 · cited 1×
“Skeletal muscle mass loss is a hallmark of cachexia, and muscle mass preservation is critical for the survival of many cancer patients [1].”
Raptor, a Binding Partner of Target of Rapamycin (TOR), Mediates TOR Action
Hara, K., Maruki, Y., Long, X., Yoshino, K.-I., Oshiro, N., Sujuti, H., Tokunaga, C., Avruch, J., & Yonezawa, K. (2002) · Cell · doi:10.1016/s0092-8674(02)00833-4 · Cited by 1,810 · cited 1×
“Raptor acts as a scaffolding protein to recruit downstream targets of mTOR, S6K and 4EBP1 [65,66].”
Muscaritoli, M., Anker, S. D., Argilés, J., Aversa, Z., Bauer, J. M., Biolo, G., Boirie, Y., Bosaeus, I., Cederholm, T., Costelli, P., et al. (2010) · Clinical Nutrition · doi:10.1016/j.clnu.2009.12.004 · Cited by 1,732 · cited 1×
“accelerates during the progression of cachexia [5].”
Multiple types of skeletal muscle atrophy involve a common program of changes in gene expression
Lecker, S. H., Jagoe, R. T., Gilbert, A., Gomes, M., Baracos, V., Bailey, J., Price, S. R., Mitch, W. E., & Goldberg, A. L. (2004) · The FASEB Journal · doi:10.1096/fj.03-0610com · Cited by 1,539 · cited 3×
“expression of autophagy [26,31] and lysosomal [31] related”
Zhao, J., Brault, J. J., Schild, A., Cao, P., Sandri, M., Schiaffino, S., Lecker, S. H., & Goldberg, A. L. (2007) · Cell Metabolism · doi:10.1016/j.cmet.2007.11.004 · Cited by 1,489 · cited 2×
“IGF-1 signaling can also regulate muscle protein degradation through the suppression of forkhead box O (FOXO), whose transcriptional targets include muscle atrogin-1/MAFbx, Muscle RING Finger-1 (MuRF1) and autophagy-related genes [16,17,18].”
Research works printed but not linked: 2
- ML Asp, 2010, Evidence for the contribution of insulin resistance to the development of cachexia in tumor-bearing mice., Int J Cancer, 126, 756, 10.1002/ijc.24784 · DOI
- RA Frost, 2007, Protein kinase B/Akt: a nexus of growth factor and cytokine signaling in determining muscle mass., J Appl Physiol, 103, 378, 10.1152/japplphysiol.00089.2007 · DOI · Paper page
Cited by
Sorted by citations
Cancer Cachexia: Mediators, Signaling, and Metabolic Pathways
Fearon, K. C. H., Glass, D. J., & Guttridge, D. C. (2012) · Cell Metabolism · doi:10.1016/j.cmet.2012.06.011 · Cited by 1,244
“IL-6 receptor antibody blocked cachexia progression via suppression of muscle protein degradation, while not rescuing the suppression of synthesis (White et al., 2011).”
BackgroundGreen justice or just green? Provision of urban green spaces in Berlin, Germany
Kabisch, N., & Haase, D. (2013) · Landscape and Urban Planning · doi:10.1016/j.landurbplan.2013.11.016 · Cited by 953
A PGC-1α isoform induced by resistance training regulates skeletal muscle hypertrophy
Ruas, J. L., White, J. P., Rao, R. R., Kleiner, S., Brannan, K. T., Harrison, B. C., Greene, N. P., Wu, J., Estall, J. L., Irving, B. A., et al. (2012) · Cell · doi:10.1016/j.cell.2012.10.050 · Cited by 677
“Cancer-induced cachexia has been shown to occur concomitantly with dysregulation of myostatin and IGF1 expression in muscle (Busquets et al., 2012; Fearon et al., 2012; White et al., 2011).”
Self-citationMechanisms of IGF-1-Mediated Regulation of Skeletal Muscle Hypertrophy and Atrophy
Yoshida, T., & Delafontaine, P. (2020) · Cells · doi:10.3390/cells9091970 · Cited by 772
Bonetto, A., Aydogdu, T., Jin, X., Zhang, Z., Zhan, R., Puzis, L., Koniaris, L. G., & Zimmers, T. A. (2012) · American Journal of Physiology-Endocrinology and Metabolism · doi:10.1152/ajpendo.00039.2012 · Cited by 463
Breaking new ground in mapping human settlements from space – The Global Urban Footprint
Esch, T., Heldens, W., Hirner, A., Keil, M., Marconcini, M., Roth, A., Zeidler, J., Dech, S., & Strano, E. (2017) · ISPRS Journal of Photogrammetry and Remote Sensing · doi:10.1016/j.isprsjprs.2017.10.012 · Cited by 403
Green spaces of European cities revisited for 1990–2006
Kabisch, N., & Haase, D. (2013) · Landscape and Urban Planning · doi:10.1016/j.landurbplan.2012.10.017 · Cited by 374
Bharadwaj, U., Kasembeli, M. M., Robinson, P., & Tweardy, D. J. (2020) · Pharmacological Reviews · doi:10.1124/pr.119.018440 · Cited by 314
“The link between IL-6/STAT3 signaling and muscle and adipose tissue wasting is well established in mouse models of cachexia (White et al., 2011; Silva et al., 2015) and has been reinforced preliminarily in clinical studies.”
BackgroundCancer cachexia: molecular mechanisms and treatment strategies
Setiawan, T., Sari, I. N., Wijaya, Y. T., Julianto, N. M., Muhammad, J. A., Lee, H., Chae, J. H., & Kwon, H. Y. (2023) · Journal of Hematology & Oncology · doi:10.1186/s13045-023-01454-0 · Cited by 342
Chen, Y.-M., Wei, L., Chiu, Y.-S., Hsu, Y.-J., Tsai, T.-Y., Wang, M.-F., & Huang, C.-C. (2016) · Nutrients · doi:10.3390/nu8040205 · Cited by 297
Brown, J. L., Rosa‐Caldwell, M. E., Lee, D. E., Blackwell, T. A., Brown, L. A., Perry, R. A., Haynie, W. S., Hardee, J. P., Carson, J. A., Wiggs, M. P., et al. (2017) · Journal of Cachexia, Sarcopenia and Muscle · doi:10.1002/jcsm.12232 · Cited by 288
Self-citationFrantzeskaki, N., & Kabisch, N. (2016) · Environmental Science & Policy · doi:10.1016/j.envsci.2016.01.010 · Cited by 244
Balancing demand and supply of multiple urban ecosystem services on different spatial scales
Larondelle, N., & Lauf, S. (2016) · Ecosystem Services · doi:10.1016/j.ecoser.2016.09.008 · Cited by 241
Testosterone regulation of Akt/mTORC1/FoxO3a signaling in skeletal muscle
White, J. P., Gao, S., Puppa, M., Sato, S., Welle, S. L., & Carson, J. A. (2012) · Molecular and Cellular Endocrinology · doi:10.1016/j.mce.2012.10.019 · Cited by 267
“In skeletal muscle, the activation of FoxO1 and 3 have been identified in conditions of muscle atrophy such as starvation (Lecker et al., 2004), diabetes (Lee et al., 2004) and cachexia (Lecker et al., 2004; White et al., 2011).”
BackgroundMethodInfluentialSelf-citationWhite, J. P., Puppa, M., Sato, S., Gao, S., Price, R. L., Baynes, J., Kostek, M. C., Matesic, L. E., & Carson, J. A. (2012) · Skeletal Muscle · doi:10.1186/2044-5040-2-14 · Cited by 225
Self-citationSTAT3 in the systemic inflammation of cancer cachexia
Zimmers, T. A., Fishel, M. L., & Bonetto, A. (2016) · Seminars in Cell and Developmental Biology · doi:10.1016/j.semcdb.2016.02.009 · Cited by 231
Ribosome biogenesis: Emerging evidence for a central role in the regulation of skeletal muscle mass
Chaillou, T., Kirby, T. J., & McCarthy, J. J. (2014) · Journal of Cellular Physiology · doi:10.1002/jcp.24604 · Cited by 211
“An alteration of mTORC1 signaling was observed in several models of cachexia (Schakman et al., 2008; Chen et al., 2011; White et al., 2011) while recent evidence indicates that critically ill (Constantin et al., 2011) and hypoxemic COPD (Favier et al., 2010) patients also show altered mTORC1…”
BackgroundKasembeli, M. M., Bharadwaj, U., Robinson, P., & Tweardy, D. J. (2018) · International Journal of Molecular Sciences · doi:10.3390/ijms19082299 · Cited by 199
Regulation of muscle protein synthesis and the effects of catabolic states
Gordon, B. S., Kelleher, A. R., & Kimball, S. R. (2013) · The International Journal of Biochemistry & Cell Biology · doi:10.1016/j.biocel.2013.05.039 · Cited by 219
“Expression of the IGF-1 mRNA in skeletal muscle is significantly reduced upon initiation of cachexia in a mouse model of colon cancer (White et al., 2011), and administration of IGF-1 to rats inoculated with AH-130 cancer cells helps maintain bodyweight, lean body mass, and muscle weight (Schmidt…”
BackgroundInfluentialJohns, N., Stephens, N. A., & Fearon, K. C. H. (2013) · The International Journal of Biochemistry & Cell Biology · doi:10.1016/j.biocel.2013.05.032 · Cited by 196
Role of interleukin-6 in cachexia
Narsale, A. A., & Carson, J. A. (2014) · Current Opinion in Supportive and Palliative Care · doi:10.1097/spc.0000000000000091 · Cited by 205
Self-citationSex Differences in Muscle Wasting
Anderson, L. J., Liu, H. M., & Garcia, J. M. (2017) · Advances in experimental medicine and biology · doi:10.1007/978-3-319-70178-3_9 · Cited by 226
Muscle mTORC1 suppression by IL-6 during cancer cachexia: a role for AMPK
White, J. P., Puppa, M., Gao, S., Sato, S., Welle, S. L., & Carson, J. A. (2013) · American Journal of Physiology-Endocrinology and Metabolism · doi:10.1152/ajpendo.00410.2012 · Cited by 187
Self-citationDu, S., Xiong, Z., Wang, Y.-C., & Guo, L. (2016) · doi:10.1016/j.rse.2016.02.063 · Cited by 184
VanderVeen, B. N., Fix, D. K., & Carson, J. A. (2017) · Oxidative Medicine and Cellular Longevity · doi:10.1155/2017/3292087 · Cited by 188
Self-citationGut Barrier Dysfunction in the ApcMin/+ Mouse Model of Colon Cancer Cachexia
Puppa, M. J., White, J. P., Sato, S., Cairns, M., Baynes, J., & Carson, J. (2011) · Biochimica et Biophysica Acta · doi:10.1016/j.bbadis.2011.08.010 · Cited by 156
Self-citationCarson, J. A., & Manolagas, S. C. (2015) · Bone · doi:10.1016/j.bone.2015.04.015 · Cited by 173
Self-citationIncreased gut permeability in cancer cachexia: mechanisms and clinical relevance
Bindels, L. B., Neyrinck, A. M., Loumaye, A., Catry, E., Walgrave, H., Cherbuy, C., Leclercq, S., Van Hul, M., Plovier, H., Pachikian, B., et al. (2018) · Oncotarget · doi:10.18632/oncotarget.24804 · Cited by 147
Molecular mechanism of sarcopenia and cachexia: recent research advances
Sakuma, K., Aoi, W., & Yamaguchi, A. (2017) · Pflügers Archiv - European Journal of Physiology · doi:10.1007/s00424-016-1933-3 · Cited by 160
Skeletal muscle glycoprotein 130's role in Lewis lung carcinoma–induced cachexia
Puppa, M. J., Gao, S., Narsale, A. A., & Carson, J. A. (2014) · The FASEB Journal · doi:10.1096/fj.13-240580 · Cited by 143
Self-citationInterdependence of Muscle Atrophy and Bone Loss Induced by Mechanical Unloading
Lloyd, S. A. J., Lang, C. H., Zhang, Y., Paul, E. M., Laufenberg, L. J., Lewis, G. S., & Donahue, H. J. (2013) · Journal of Bone and Mineral Research · doi:10.1002/jbmr.2113 · Cited by 129
The effect of exercise on IL‐6‐induced cachexia in the ApcMin/+ mouse
Puppa, M., White, J. P., Velázquez, K. T., Baltgalvis, K. A., Sato, S., Baynes, J., & Carson, J. A. (2011) · Journal of Cachexia Sarcopenia and Muscle · doi:10.1007/s13539-011-0047-1 · Cited by 120
Self-citationHyatt, H. W., & Powers, S. K. (2021) · Antioxidants · doi:10.3390/antiox10040588 · Cited by 134
Muscle-to-tumor crosstalk: The effect of exercise-induced myokine on cancer progression
Huang, Q., Wu, M., Wu, X., Zhang, Y., & Xia, Y. (2022) · Biochimica et Biophysica Acta (BBA) - Reviews on Cancer · doi:10.1016/j.bbcan.2022.188761 · Cited by 124
Configuration Models of Random Hypergraphs and their Applications
Chodrow, P. S., & Gleeson, J. (2019) · J. Complex Networks · doi:10.48550/arxiv.1902.09302 · Cited by 111
Siddiqui, J. A., Pothuraju, R., Jain, M., Batra, S. K., & Nasser, M. W. (2020) · Biochimica et Biophysica Acta (BBA) - Reviews on Cancer · doi:10.1016/j.bbcan.2020.188359 · Cited by 126
“Treatment with IL-6 receptor antibody prevented the progression of cancer cachexia via suppression of muscle protein degradation [100].”
BackgroundMartin, A., Gallot, Y. S., & Freyssenet, D. G. (2023) · Journal of Cachexia Sarcopenia and Muscle · doi:10.1002/jcsm.13073 · Cited by 127
Loumaye, A., & Thissen, J. (2017) · Clinical Biochemistry · doi:10.1016/j.clinbiochem.2017.07.011 · Cited by 112
Epigenetic targeting of bromodomain protein BRD4 counteracts cancer cachexia and prolongs survival
Segatto, M., Fittipaldi, R., Pin, F., Sartori, R., Dae Ko, K., Zare, H., Fenizia, C., Zanchettin, G., Pierobon, E. S., Hatakeyama, S., et al. (2017) · Nature Communications · doi:10.1038/s41467-017-01645-7 · Cited by 101
Carson, J. A., Hardee, J. P., & VanderVeen, B. N. (2015) · Seminars in Cell and Developmental Biology · doi:10.1016/j.semcdb.2015.11.005 · Cited by 109
Self-citationSex Differences in Cancer Cachexia
Zhong, X.-L., & Zimmers, T. (2020) · Current Osteoporosis Reports · doi:10.1007/s11914-020-00628-w · Cited by 98
Protein imbalance in the development of skeletal muscle wasting in tumour‐bearing mice
Brown, J. L., Lee, D. E., Rosa‐Caldwell, M. E., Brown, L. A., Perry, R. A., Haynie, W. S., Huseman, K., Sataranatarajan, K., Remmen, H. V., Washington, T. A., et al. (2018) · Journal of Cachexia Sarcopenia and Muscle · doi:10.1002/jcsm.12354 · Cited by 117
Mueller, T. C., Bachmann, J., Prokopchuk, O., Friess, H., & Martignoni, M. E. (2016) · BMC Cancer · doi:10.1186/s12885-016-2121-8 · Cited by 95
Leucine as a treatment for muscle wasting: a critical review.
Ham, D. J., Caldow, M., Lynch, G., & Koopman, R. (2014) · Clinical Nutrition · doi:10.1016/j.clnu.2014.09.016 · Cited by 90
Hall, D. T., Griss, T., Ma, J. F., Sanchez, B. J., Sadek, J., Tremblay, A. M. K., Mubaid, S., Omer, A., Ford, R. J., Bedard, N., et al. (2018) · EMBO Molecular Medicine · doi:10.15252/emmm.201708307 · Cited by 88
“This observation is corroborated by a previous study in the ApcMin/+ colon cancer model that showed that AMPK activation occurs in the later stages of cachectic progression (White et al, 2011).”
BackgroundResultInfluentialKhamoui, A. V., Park, B., Kim, D.-H., Yeh, M.-C., Oh, S.-L., Elam, M., Jo, E., Arjmandi, B., Salazar, G., Grant, S., et al. (2016) · Metabolism: Clinical and Experimental · doi:10.1016/j.metabol.2016.01.014 · Cited by 87
“For instance, inhibited insulin-like growth factor-I (IGF-I) activity along with enhanced myostatin signaling has been reported in skeletal muscles of several cancer cachexiamodels [26–28].”
BackgroundBallarò, R., Beltrà, M., Lucia, S. D., Pin, F., Ranjbar, K., Hulmi, J. J., Costelli, P., & Penna, F. (2019) · The FASEB Journal · doi:10.1096/fj.201801862r · Cited by 104
STAT3 in Skeletal Muscle Function and Disorders
Guadagnin, E., Mázala, D. A. G., & Chen, Y. (2018) · International Journal of Molecular Sciences · doi:10.3390/ijms19082265 · Cited by 93
“A contributing factor to skeletal muscle wasting is the decrease protein synthesis due to the AMP-activated kinase (AMPK)-dependent repression of mTOR signaling, which is most evident in the later stages of cancer cachexia [78].”
BackgroundSilva, A. F., Zortéa, M., Carvalho, S., Leite, J., Torres, I. L. D. S., Fregni, F., & Caumo, W. (2017) · Scientific Reports · doi:10.1038/s41598-017-00185-w · Cited by 99
Muscle Wasting Diseases: Novel Targets and Treatments
Furrer, R., & Handschin, C. (2018) · The Annual Review of Pharmacology and Toxicology · doi:10.1146/annurev-pharmtox-010818-021041 · Cited by 94
Aerobic exercise training as therapy for cardiac and cancer cachexia
Alves, C. R. R., Cunha, T. F., da Paixão, N. A., & Brum, P. C. (2014) · Life Sciences · doi:10.1016/j.lfs.2014.11.029 · Cited by 79
Marceca, G. P., Londhe, P., & Calore, F. (2020) · Frontiers in Oncology · doi:10.3389/fonc.2020.00298 · Cited by 92
Understanding the Role of Exercise in Cancer Cachexia Therapy
Hardee, J. P., Counts, B. R., & Carson, J. A. (2017) · American Journal of Lifestyle Medicine · doi:10.1177/1559827617725283 · Cited by 111
Self-citationSerological muscle loss biomarkers: an overview of current concepts and future possibilities
Nedergaard, A., Karsdal, M., Sun, S., & Henriksen, K. (2012) · Journal of Cachexia, Sarcopenia and Muscle · doi:10.1007/s13539-012-0086-2 · Cited by 76
“On the other hand, during critical illness, muscle loss can exceed several percent per day [6].”
BackgroundSex Differences in the Relationship of IL-6 Signaling to Cancer Cachexia Progression
Hetzler, K. L., Hardee, J., Puppa, M. J., Narsale, A. A., Sato, S., Davis, J., & Carson, J. (2014) · Biochimica et Biophysica Acta · doi:10.1016/j.bbadis.2014.12.015 · Cited by 75
Self-citationExercise as an anti-inflammatory therapy for cancer cachexia: a focus on interleukin-6 regulation
Daou, H. N. (2019) · American Journal of Physiology-Regulatory, Integrative and Comparative Physiology · doi:10.1152/ajpregu.00147.2019 · Cited by 93
Concurrent evolution of cancer cachexia and heart failure: bilateral effects exist
Kazemi‐Bajestani, S. M. R., Becher, H. H., Fassbender, K., Chu, Q. S.-C., & Baracos, V. E. (2014) · Journal of Cachexia Sarcopenia and Muscle · doi:10.1007/s13539-014-0137-y · Cited by 79
“kinase B (Akt), and mammalian target of rapamycin (mTOR) signaling pathways [15, 16].”
BackgroundQuercetin supplementation attenuates the progression of cancer cachexia in ApcMin/+ mice.
Velázquez, K. T., Enos, R. T., Narsale, A. A., Puppa, M. J., Davis, J., Murphy, E., & Carson, J. (2014) · Journal of NutriLife · doi:10.3945/jn.113.188367 · Cited by 71
“On the other hand, IL-6 overexpression was shown to accelerate cachexia development (8,11).”
BackgroundMethodInfluentialSelf-citationMartı́n, A. I., Priego, T., & López‐Calderón, A. (2018) · Advances in experimental medicine and biology · doi:10.1007/978-981-13-1435-3_9 · Cited by 84
Impaired regeneration: A role for the muscle microenvironment in cancer cachexia
Talbert, E. E., & Guttridge, D. C. (2015) · Seminars in Cell and Developmental Biology · doi:10.1016/j.semcdb.2015.09.009 · Cited by 71
Moderate Exercise Improves Experimental Cancer Cachexia by Modulating the Redox Homeostasis
Ballarò, R., Penna, F., Pin, F., Gómez‐Cabrera, M. C., Viña, J., & Costelli, P. (2019) · Cancers · doi:10.3390/cancers11030285 · Cited by 73
Autophagy as a Therapeutic Target to Enhance Aged Muscle Regeneration
Lee, D. E., Bareja, A., Bartlett, D. B., & White, J. P. (2019) · Cells · doi:10.3390/cells8020183 · Cited by 65
Self-citationLiver Inflammation and Metabolic Signaling in ApcMin/+ Mice: The Role of Cachexia Progression
Narsale, A. A., Enos, R. T., Puppa, M. J., Chatterjee, S., Murphy, E., Fayad, R., Peña, M. O., Durstine, J., & Carson, J. (2015) · PLoS ONE · doi:10.1371/journal.pone.0119888 · Cited by 64
Self-citationCancer-Mediated Muscle Cachexia: Etiology and Clinical Management
Siff, T. E., Parajuli, P., Razzaque, M. S., & Atfi, A. (2021) · Trends in Endocrinology and Metabolism · doi:10.1016/j.tem.2021.03.007 · Cited by 73
Muscle wasting in animal models of severe illness
Holeček, M. (2012) · International journal of experimental pathology (Print) · doi:10.1111/j.1365-2613.2012.00812.x · Cited by 62
“…area (GM) Baltgalvis et al. (2010) ApcMin ⁄ + mice at 14–20 weeks Mouse flmuscle mass (GM) ›proteolysis (› atrogin-1 and MuRf-1 in GM) flprotein synthesis (GM) White et al. (2011) , sacrifice time after inoculation of tumour cells; SOL, m. soleus; TA, m. tibialis anterior; EPI, m.…”
BackgroundActivation of Akt–mTORC1 signalling reverts cancer‐dependent muscle wasting
Geremia, A., Sartori, R., Baraldo, M., Nogara, L., Balmaceda, V., Dumitras, A. G., Ciciliot, S., Scalabrin, M., Nolte, H., & Blaauw, B. (2021) · Journal of Cachexia Sarcopenia and Muscle · doi:10.1002/jcsm.12854 · Cited by 79
Cyclone risk mapping for critical coastal infrastructure: Cases of East Asian seaports
Lam, J., Liu, C., & Gou, X. (2017) · Ocean & Coastal Management · doi:10.1016/j.ocecoaman.2017.02.015 · Cited by 61
Gordon, B. S., Kazi, A. A., Coleman, C., Dennis, M. D., Chau, V., Jefferson, L., & Kimball, S. (2013) · Cellular Signalling · doi:10.1016/j.cellsig.2013.11.035 · Cited by 61
Bladder cancer-induced skeletal muscle wasting: disclosing the role of mitochondria plasticity.
Padrão, A., Oliveira, P., Vitorino, R., Colaço, B., Pires, M., Márquez, M., Castellanos, E., Neuparth, M., Teixeira, C., Costa, C., et al. (2013) · International Journal of Biochemistry and Cell Biology · doi:10.1016/j.biocel.2013.04.014 · Cited by 61
Area postrema neurons mediate interleukin-6 function in cancer cachexia
Sun, Q., van de Lisdonk, D., Ferrer, M., Gegenhuber, B., Wu, M. V., Park, Y., Tuveson, D. A., Tollkühn, J., Janowitz, T., & Li, B. (2024) · Nature Communications · doi:10.1038/s41467-024-48971-1 · Cited by 63
Eccentric contraction-induced myofiber growth in tumor-bearing mice
Hardee, J. P., Mangum, J. E., Gao, S., Sato, S., Hetzler, K. L., Puppa, M., Fix, D. K., & Carson, J. A. (2015) · Journal of Applied Physiology · doi:10.1152/japplphysiol.00416.2015 · Cited by 68
Self-citationManne, N. D. P. K., Lima, M., Enos, R. T., Wehner, P. S., Carson, J. A., & Blough, E. R. (2013) · International Journal of Oncology · doi:10.3892/ijo.2013.1893 · Cited by 61
Self-citationSkeletal muscle function during the progression of cancer cachexia in the male ApcMin/+ mouse
VanderVeen, B. N., Hardee, J. P., Fix, D. K., & Carson, J. A. (2017) · Journal of Applied Physiology · doi:10.1152/japplphysiol.00897.2017 · Cited by 59
Self-citationThe role of TGF-β signaling in muscle atrophy, sarcopenia and cancer cachexia
Lan, X., Deng, C., Wang, Q., Zhao, L., Jiao, B., & Xiang, Y. (2024) · General and Comparative Endocrinology · doi:10.1016/j.ygcen.2024.114513 · Cited by 61
Cachectic skeletal muscle response to a novel bout of low-frequency stimulation
Puppa, M., Murphy, E. A., Fayad, R., Hand, G. A., & Carson, J. A. (2014) · Journal of Applied Physiology · doi:10.1152/japplphysiol.01270.2013 · Cited by 52
Self-citationAMPK as a mediator of tissue preservation: time for a shift in dogma?
Langer, H. T., Rohm, M., Goncalves, M. D., & Sylow, L. (2024) · Nature Reviews Endocrinology · doi:10.1038/s41574-024-00992-y · Cited by 55
Diabetic sarcopenia: metabolic and molecular appraisal
Giha, H. A., Alamin, O. A. O., & Sater, M. S. (2022) · Acta Diabetologica · doi:10.1007/s00592-022-01883-2 · Cited by 66
“With rigorous exercise and dieting, the muscle mass can be doubled; in contrast, in severe diseases, the loss can account for several percent of the muscle mass per day [26].”
BackgroundDevelopment and progression of cancer cachexia: Perspectives from bench to bedside
Lim, S., Brown, J. L., Washington, T. A., & Greene, N. P. (2020) · Sports Medicine and Health Science · doi:10.1016/j.smhs.2020.10.003 · Cited by 63
The Impact of Immune Cells on the Skeletal Muscle Microenvironment During Cancer Cachexia
VanderVeen, B. N., Murphy, E. A., & Carson, J. A. (2020) · Frontiers in Physiology · doi:10.3389/fphys.2020.01037 · Cited by 61
Self-citationChacon‐Cabrera, A., Mateu-Jiménez, M., Langohr, K., Fermoselle, C., García‐Arumí, E., Andreu, A. L., Yélamos, J., & Barreiro, E. (2017) · Journal of Cellular Physiology · doi:10.1002/jcp.25851 · Cited by 53
“The previously reported decrease in the rate ofmyofibrilar protein synthesis observed in models of cachexia (Toth et al., 2013; White et al., 2011, 2012) and aging (Fry et al., 2011) may also partly account for the reduced levels of myosin protein in the cancer cachectic muscles of wild type…”
BackgroundResultInaba, K. (2015) · Cilia · doi:10.1186/s13630-015-0015-z · Cited by 52
Mallard, J., Hucteau, E., Hureau, T. J., & Pagano, A. F. (2021) · Frontiers in Cell and Developmental Biology · doi:10.3389/fcell.2021.719643 · Cited by 62
Linking Cancer Cachexia‐Induced Anabolic Resistance to Skeletal Muscle Oxidative Metabolism
Hardee, J. P., Montalvo, R. N., & Carson, J. A. (2017) · Oxidative Medicine and Cellular Longevity · doi:10.1155/2017/8018197 · Cited by 53
Self-citationHardee, J. P., Counts, B. R., Gao, S., VanderVeen, B. N., Fix, D. K., Koh, H., & Carson, J. A. (2017) · Journal of Cachexia Sarcopenia and Muscle · doi:10.1002/jcsm.12271 · Cited by 50
Self-citationPrioritizing conservation areas for coastal plant diversity under increasing urbanization.
Doxa, A., Albert, C., Leriche, A., & Saatkamp, A. (2017) · Journal of Environmental Management · doi:10.1016/j.jenvman.2017.06.021 · Cited by 48
The therapeutic potential of exercise to treat cachexia
Lira, F. S., Antunes, B. M., Seelaender, M. C. L., & Neto, J. C. R. (2015) · Current Opinion in Supportive and Palliative Care · doi:10.1097/spc.0000000000000170 · Cited by 49
Characterization of the male ApcMin/+ mouse as a hypogonadism model related to cancer cachexia
White, J. P., Puppa, M. J., Narsale, A. A., & Carson, J. (2013) · Biology Open · doi:10.1242/bio.20136544 · Cited by 48
Self-citationBanzhaf, E., Kabisch, S., Knapp, S., Rink, D., Wolff, M., & Kindler, A. (2017) · Land Use Policy · doi:10.1016/j.landusepol.2016.11.012 · Cited by 47
Sarcopenia and cachexia: molecular mechanisms and therapeutic interventions
Wang, T., Zhou, D., & Hong, Z. (2025) · MedComm · doi:10.1002/mco2.70030 · Cited by 46
Nutrient interaction for optimal protein anabolism in resistance exercise
Breen, L., & Phillips, S. M. (2012) · Current Opinion in Clinical Nutrition and Metabolic Care · doi:10.1097/mco.0b013e3283516850 · Cited by 45
Jewson, D., & Granin, N. (2015) · doi:10.1080/09670262.2014.979450 · Cited by 45
The Importance of mTORC1-Autophagy Axis for Skeletal Muscle Diseases
Han, X., Goh, K. Y., Lee, W. X., Choy, S. M., & Tang, H.-W. (2022) · International Journal of Molecular Sciences · doi:10.3390/ijms24010297 · Cited by 48
Shared and distinct mechanisms of skeletal muscle atrophy: A narrative review
Wilburn, D. T., Ismaeel, A., Machek, S. B., Fletcher, E., & Koutakis, P. (2021) · Ageing Research Reviews · doi:10.1016/j.arr.2021.101463 · Cited by 47
Halle, J. L., Pena, G. S., Paez, H. G., Castro, A. J., Rossiter, H. B., Visavadiya, N. P., WHITEHURST, M. A., & Khamoui, A. V. (2019) · American Journal of Physiology-Regulatory, Integrative and Comparative Physiology · doi:10.1152/ajpregu.00028.2019 · Cited by 50
Gordon, B. S., Steiner, J. L., Williamson, D. L., Lang, C. H., & Kimball, S. R. (2016) · American Journal of Physiology-Endocrinology and Metabolism · doi:10.1152/ajpendo.00059.2016 · Cited by 49
Gao, S., & Carson, J. (2016) · American Journal of Physiology - Cell Physiology · doi:10.1152/ajpcell.00052.2015 · Cited by 43
Self-citationCancer-Associated Cachexia: A Systemic Consequence of Cancer Progression
Biswas, A., & Acharyya, S. (2019) · Annual Review of Cancer Biology · doi:10.1146/annurev-cancerbio-030419-033642 · Cited by 42
“Nonetheless, TNF-α blockade has not been successful in treating patients with cancer cachexia in clinical trials conducted in multiple cancer types ( Jatoi et al. 2010, Wiedenmann et al. 2008).”
BackgroundThe Nutritional Challenges of Cancer Cachexia
Gaafer, O., & Zimmers, T. (2021) · JPEN - Journal of Parenteral and Enteral Nutrition · doi:10.1002/jpen.2287 · Cited by 39
Huot, J. R., Novinger, L. J., Pin, F., & Bonetto, A. (2020) · Disease Models & Mechanisms · doi:10.1242/dmm.043166 · Cited by 50
Derangements of amino acids in cachectic skeletal muscle are caused by mitochondrial dysfunction
Kunzke, T., Buck, A., Prade, V. M., Feuchtinger, A., Prokopchuk, O., Martignoni, M., Heisz, S., Hauner, H., Janssen, K., Walch, A., et al. (2019) · Journal of Cachexia, Sarcopenia and Muscle · doi:10.1002/jcsm.12498 · Cited by 37
Metadata
- Authors
- White, J. P., Baynes, J. W., Welle, S. L., Kostek, M. C., Matesic, L. E., Sato, S., & Carson, J. A.
- Affiliations
- University of South Carolina (US)
- University of Rochester Medicine (US)
- Corresponding author
- Carson, James A.
- Venue
- PLoS ONE
- Publisher
- Public Library of Science (PLoS)
- Published
- 2011-09-19
- Volume
- 6
- Issue
- 9
- Pages
- e24650
- ISSN
- 1932-6203 (ISSN-L)
- PMC
- PMC3176277
- OpenAlex
- W2151316758
- Cited by
- 260
- References
- 82
- Citations by year
- 2026: 8 · 2025: 16 · 2024: 21 · 2023: 22 · 2022: 20 · 2021: 29 · 2020: 24 · 2019: 18 · 2018: 18 · 2017: 19 · 2016: 11 · 2015: 11 · 2014: 12 · 2013: 17 · 2012: 12
- FWCI
- 5.59
- Type
- journal article
- Language
- en
- Open access
- gold
- doi.org
- Locations
- PLoS ONE (publishedVersion, cc-by)
- Europe PMC (PubMed Central) (publishedVersion, cc-by)
- PubMed Central (publishedVersion, cc-by)
- PubMed (publishedVersion)
- Scholar Commons (University of South Carolina) (submittedVersion)
- DOAJ (DOAJ: Directory of Open Access Journals) (submittedVersion)
- Figshare (submittedVersion, cc-by)
- Funders
- National Institutes of Health
- Chugai Pharmaceutical
- National Cancer Institute (R01CA121249)
- National Center for Research Resources (P20RR017698)
- Topics
- Life Sciences › Biochemistry, Genetics and Molecular Biology › Molecular Biology › Muscle Physiology and Disorders
- Health Sciences › Medicine › Physiology (medical) › Nutrition and Health in Aging
- Health Sciences › Nursing › Nutrition and Dietetics › Muscle metabolism and nutrition
- Keywords
- cancer cachexia, skeletal muscle protein turnover, muscle protein synthesis, muscle protein degradation, colorectal cancer, IL-6 signaling, AMPK, Raptor phosphorylation, muscle atrophy, weight loss, IL-6 receptor antibody
- MeSH terms
- Adenosine Triphosphate, Animals, Body Weight, Cachexia, Enzyme Activation, Inflammation, Insulin-Like Growth Factor I, Mice, Inbred C57BL, Mice, Mutant Strains, Muscle Proteins, Myofibrils, Neoplasms, Organ Size, Phosphorylation, Protein Biosynthesis, Signal Transduction, Interleukin-6, Disease Progression, Muscle, Skeletal, Adiposity, Mice, AMP-Activated Protein Kinases, TOR Serine-Threonine Kinases, Proteolysis
About these checks
Registry, retraction, Cites and statistics results are computed, not judged, with one exception: a printed reference that no index lists is read once by a model before it counts as a citation error. Claims are extracted by a model and kept only when their quote appears verbatim in the text; each cited source is then checked, with a model’s help, for whether it says what the claim relies on. Those verdicts can be wrong — read the claim’s quote and the cited source before relying on one.
Statistics and arithmetic are recomputed, not judged.
Confidence bands are shown only for fields calibrated on our annotated test set. None is calibrated yet, so no band is shown.
What counts as a claim ›How we measure confidence ›How we check this ›
Are you an author, or do you see a problem with this page? Request a review
