

The DOI matches its Crossref record; 80 of the 80 references it cites were found in a registry or an index.
Chronic Stress Induces Sex-Specific Alterations in Methylation and Expression of Corticotropin-Releasing Factor Gene in the Rat
Open accessAbstract
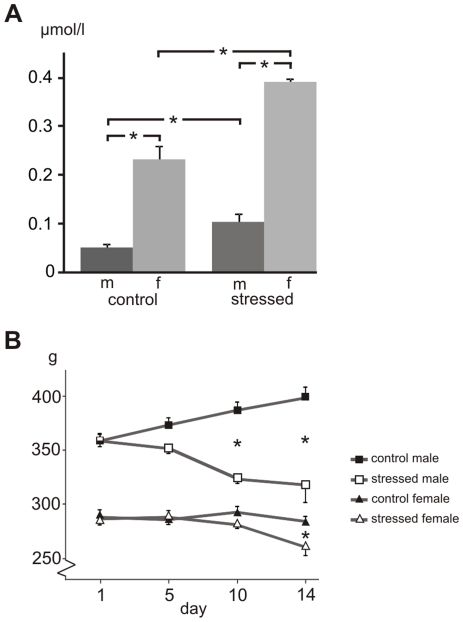
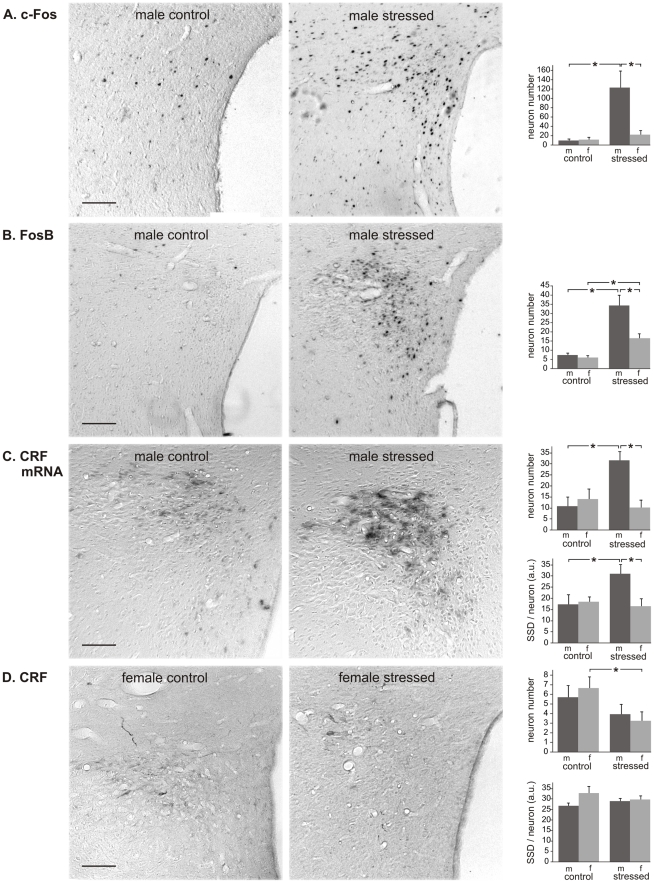
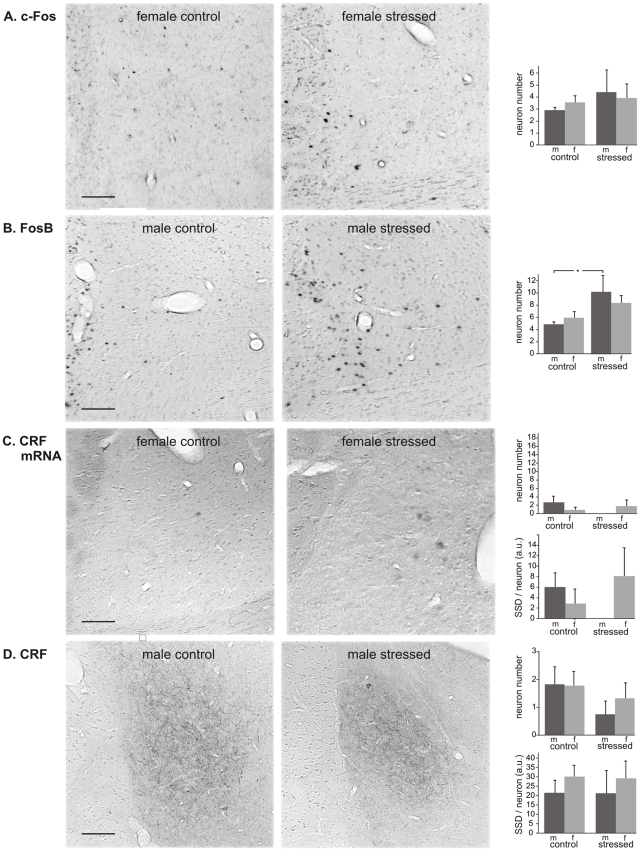
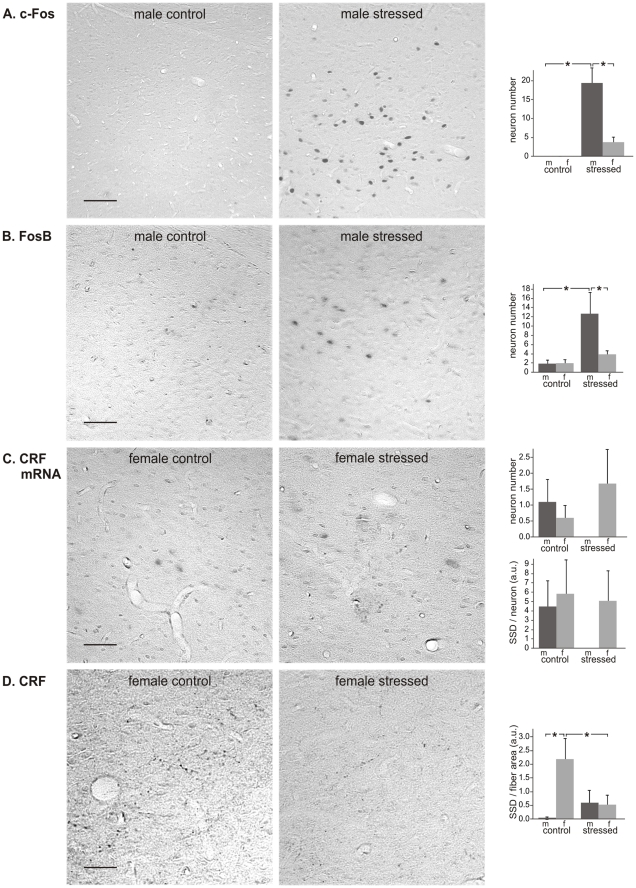
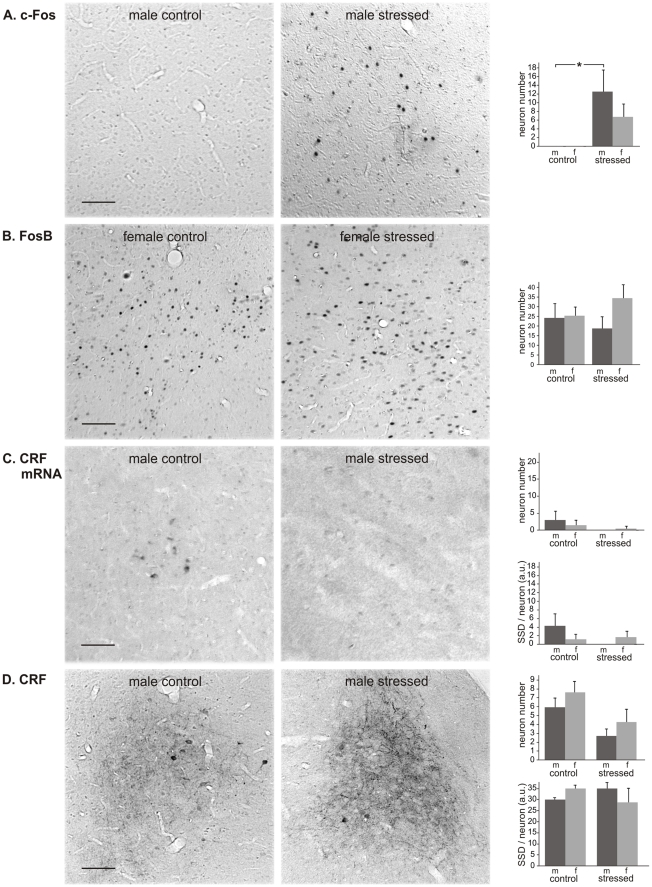
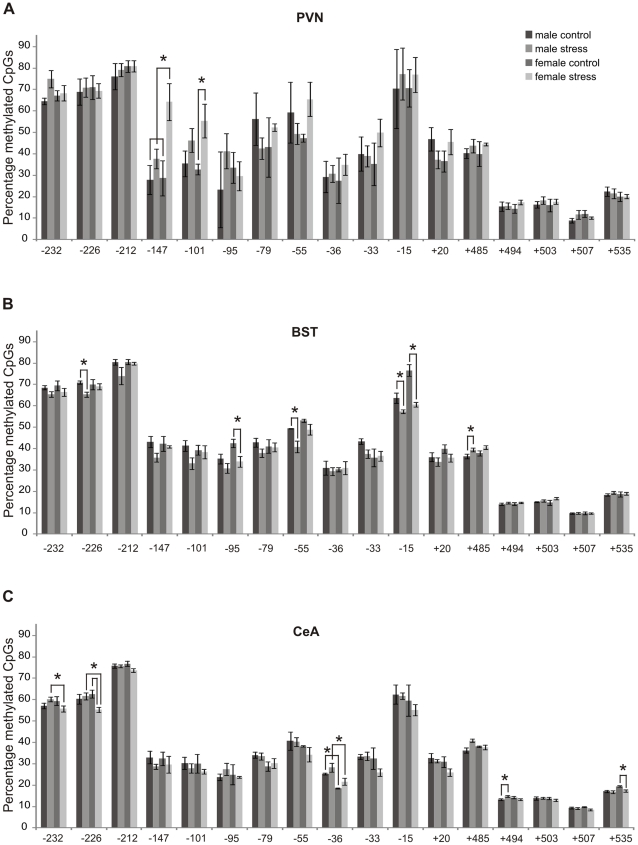
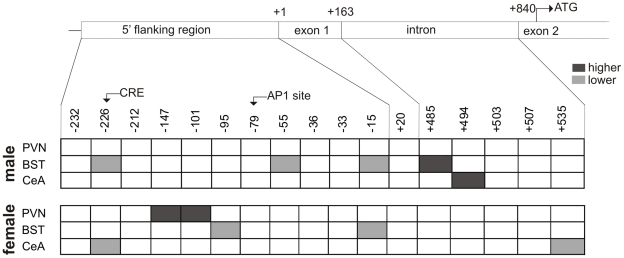
BACKGROUND: Although the higher prevalence of depression in women than in men is well known, the neuronal basis of this sex difference is largely elusive. METHODS: Male and female rats were exposed to chronic variable mild stress (CVMS) after which immediate early gene products, corticotropin-releasing factor (CRF) mRNA and peptide, various epigenetic-associated enzymes and DNA methylation of the Crf gene were determined in the hypothalamic paraventricular nucleus (PVN), oval (BSTov) and fusiform (BSTfu) parts of the bed nucleus of the stria terminalis, and central amygdala (CeA). RESULTS: CVMS induced site-specific changes in Crf gene methylation in all brain centers studied in female rats and in the male BST and CeA, whereas the histone acetyltransferase, CREB-binding protein was increased in the female BST and the histone-deacetylase-5 decreased in the male CeA. These changes were accompanied by an increased amount of c-Fos in the PVN, BSTfu and CeA in males, and of FosB in the PVN of both sexes and in the male BSTov and BSTfu. In the PVN, CVMS increased CRF mRNA in males and CRF peptide decreased in females. CONCLUSIONS: The data confirm our hypothesis that chronic stress affects gene expression and CRF transcriptional, translational and secretory activities in the PVN, BSTov, BSTfu and CeA, in a brain center-specific and sex-specific manner. Brain region-specific and sex-specific changes in epigenetic activity and neuronal activation may play, too, an important role in the sex specificity of the stress response and the susceptibility to depression.
Overview
The claims and statistics of this paper haven’t been checked yet.
Run the check — free, no account needed. It reads the open-access text and checks the sources it cites.
Integrity signals
Registry
Cites
Statistics
Figures
Verification
Claims the paper makes
The claims and statistics of this paper haven’t been checked yet.
Run the check — free, no account needed. It reads the open-access text and checks the sources it cites.
Claims other papers make about this one
Each is checked against this paper’s own text: does it say what the citing paper says it does?
The source backs part of the claim, not all of it — or backs it for a different population, condition or comparison.
In the citing paper
“Rats exposed to variable mild stress manifested decreased HDAC5 in the central amygdala (CeA).150”
From Epigenetic regulation in major depression and other stress-related disorders: molecular mechanisms, clinical relevance and therapeutic potential (2023) · cites this paper as [150]
Experimental — accuracy not yet measuredThe cited source says what the claim attributes to it.
In the citing paper
“Increased DNA methylation levels of Gdnf (Glial cell-derived neurotrophic factor) and Crh in rodent models of chronic stress have been observed, although the effects appear to be both gender and brain region-dependent [42,43].”
Self-check
Percentages, sums and reported differences re-computed from the paper’s own numbers.
The self-check needs the paper’s full text.
Citations
Cites
The Rat Brain in Stereotaxic Coordinates
Paxinos, G., & Watson, C. (1983) · Elsevier eBooks · doi:10.1016/c2009-0-63235-9 · Cited by 28,585
An analysis of variance test for normality (complete samples)
SHAPIRO, S. S., & WILK, M. B. (1965) · Biometrika · doi:10.1093/biomet/52.3-4.591 · Cited by 23,480
Snedecor, G. W., & Cochran, W. G. (1967) · Cited by 6,573
Higgins, S. M. F., Macken, A. P., Cullen, W., Saunders, J., Dunne, C. P., & O’Gorman, C. S. (2013) · PubMed · doi:10.34961/9953 · Cited by 4,807
Stress and the brain: from adaptation to disease
de Kloet, E. R., Joëls, M., & Holsboer, F. (2005) · Nature Reviews Neuroscience · doi:10.1038/nrn1683 · Cited by 4,621
AChE-stained horizontal sections of the rat brain in stereotaxic coordinates
Paxinos, G., WATSON, C. R. R., & Emson, P. C. (1980) · Journal of Neuroscience Methods · doi:10.1016/0165-0270(80)90021-7 · Cited by 4,501
Global mortality, disability, and the contribution of risk factors: Global Burden of Disease Study
Murray, C. J., & Lopez, A. D. (1997) · The Lancet · doi:10.1016/s0140-6736(96)07495-8 · Cited by 4,492 · cited 1×
“Chronic exposure to stressors can result in psychopathologies, of which depression is ranked second in the global burden of disease [1–7].”
BackgroundVale, W., Spiess, J., Rivier, C., & Rivier, J. (1981) · Science · doi:10.1126/science.6267699 · Cited by 3,965
Vale, W., Spiess, J., RIVIER, C. L., & Rivier, J. (1982) · Obstetrical & Gynecological Survey · doi:10.1097/00006254-198205000-00013 · Cited by 3,904
The Corticosteroid Receptor Hypothesis of Depression
Holsboer, F. (2000) · Neuropsychopharmacology · doi:10.1016/s0893-133x(00)00159-7 · Cited by 2,181
Research works printed but not linked: 1
- EJ Nestler, 1999, DeltaFosB: a molecular mediator of long-term neural and behavioral plasticity., Brain Res, 835, 10
Cited by
Sorted by citations
Neurobiological Interactions Between Stress and the Endocannabinoid System
Morena, M., Patel, S., Bains, J. S., & Hill, M. N. (2015) · Neuropsychopharmacology · doi:10.1038/npp.2015.166 · Cited by 698
Pathogenesis of depression: Insights from human and rodent studies
Ménard, C., Hodes, G. E., & Russo, S. J. (2016) · Neuroscience · doi:10.1016/j.neuroscience.2015.05.053 · Cited by 593
Babenko, O., Kovalchuk, I., & Metz, G. A. S. (2015) · Neuroscience & Biobehavioral Reviews · doi:10.1016/j.neubiorev.2014.11.013 · Cited by 513
Epigenetics of the depressed brain: role of histone acetylation and methylation
Sun, H., Kennedy, P. J., & Nestler, E. J. (2013) · Neuropsychopharmacology · doi:10.1038/npp.2012.73 · Cited by 413
Sex Differences in the HPA Axis
Goel, N., Workman, J. L., Lee, T. T., Innala, L., & Viau, V. (2014) · Comprehensive physiology · doi:10.1002/cphy.c130054 · Cited by 472
Sex differences in anxiety and emotional behavior
Donner, N. C., & Lowry, C. A. (2013) · Pflügers Archiv - European Journal of Physiology · doi:10.1007/s00424-013-1271-7 · Cited by 379
Epigenetic basis of mental illness
Nestler, E. J., Peña, C. J., Kundakovic, M., Mitchell, A., & Akbarian, S. (2016) · The Neuroscientist · doi:10.1177/1073858415608147 · Cited by 342
Epigenetic Mechanisms of Depression and Antidepressant Action
Vialou, V., Feng, J., Robison, A. J., & Nestler, E. J. (2013) · Annual Review of Pharmacology and Toxicology · doi:10.1146/annurev-pharmtox-010611-134540 · Cited by 277
The Corticotropin-Releasing Factor Family: Physiology of the Stress Response
Deussing, J. M., & Chen, A. (2018) · Physiological Reviews · doi:10.1152/physrev.00042.2017 · Cited by 271
Self-citationPrenatal stress and epigenetics
Cao-Lei, L., de Rooij, S. R., King, S., Matthews, S. G., Metz, G. A. S., Roseboom, T. J., & Szyf, M. (2017) · Neuroscience & Biobehavioral Reviews · doi:10.1016/j.neubiorev.2017.05.016 · Cited by 253
Yuan, M., Yang, B., Rothschild, G., Mann, J. J., Sanford, L. D., Tang, X., Huang, C., Wang, C., & Zhang, W. (2023) · Signal Transduction and Targeted Therapy · doi:10.1038/s41392-023-01519-z · Cited by 246
“150 Acetylation in the amygdala could potentially be an advantageous adaptation.”
BackgroundStress, burnout and depression: A systematic review on DNA methylation mechanisms
Bakusic, J., Schaufeli, W., Claes, S., & Godderis, L. (2017) · Journal of Psychosomatic Research · doi:10.1016/j.jpsychores.2016.11.005 · Cited by 223
Chen, J., Evans, A. N., Liu, Y., Honda, M., Saavedra, J. M., & Aguilera, G. (2012) · Journal of Neuroendocrinology · doi:10.1111/j.1365-2826.2012.02306.x · Cited by 199
Epigenetic signaling in psychiatric disorders: stress and depression
Bagot, R. C., Labonté, B., Peña, C. J., & Nestler, E. J. (2014) · Dialogues in Clinical Neuroscience · doi:10.31887/dcns.2014.16.3/rbagot · Cited by 171
Endocannabinoid system, stress and HPA axis
Micale, V., & Drago, F. (2018) · European Journal of Pharmacology · doi:10.1016/j.ejphar.2018.07.039 · Cited by 189
Epigenetic Signaling in Psychiatric Disorders
Peña, C. J., Bagot, R. C., Labonté, B., & Nestler, E. J. (2014) · Journal of Molecular Biology · doi:10.1016/j.jmb.2014.03.016 · Cited by 163
Sex Differences in Molecular and Cellular Substrates of Stress
Bangasser, D. A., & Valentino, R. J. (2012) · Cellular and Molecular Neurobiology · doi:10.1007/s10571-012-9824-4 · Cited by 160
Development of the HPA axis: Where and when do sex differences manifest?
Panagiotakopoulos, L., & Neigh, G. N. (2014) · Frontiers in Neuroendocrinology · doi:10.1016/j.yfrne.2014.03.002 · Cited by 148
Epigenetic programming of the neuroendocrine stress response by adult life stress
Dirven, B. C. J., Homberg, J. R., Kozicz, T., & Henckens, M. J. A. G. (2017) · Journal of Molecular Endocrinology · doi:10.1530/jme-17-0019 · Cited by 135
Self-citationEpigenetics and depression: return of the repressed
Dalton, V. S., Kolshus, E., & McLoughlin, D. M. (2013) · Journal of Affective Disorders · doi:10.1016/j.jad.2013.10.028 · Cited by 142
Genome-wide Methylomic Analysis of Monozygotic Twins Discordant for Adolescent Depression
Dempster, E. L., Wong, C. C. Y., Lester, K. J., Burrage, J., Gregory, A. M., Mill, J. S., & Eley, T. C. (2014) · Biological Psychiatry · doi:10.1016/j.biopsych.2014.04.013 · Cited by 132
Importance of epigenetic mechanisms in visceral pain induced by chronic water avoidance stress
Tran, L., Chaloner, A., Sawalha, A. H., & van-Meerveld, B. G. (2012) · Psychoneuroendocrinology · doi:10.1016/j.psyneuen.2012.09.016 · Cited by 124
Faulk, C. D., Barks, A. K., Liu, K., Goodrich, J. M., & Dolinoy, D. C. (2013) · Epigenomics · doi:10.2217/epi.13.49 · Cited by 114
Cytochrome P450 expression and regulation in the brain
Kuban, W., & Daniel, W. A. (2020) · Drug Metabolism Reviews · doi:10.1080/03602532.2020.1858856 · Cited by 111
Seo, M. K., Ly, N. N., Lee, C. H., Cho, H. Y., Choi, C. M., Nhu, L. H., Lee, J. G., Lee, B. J., Kim, G.-M., Yoon, B. J., et al. (2016) · Neuropharmacology · doi:10.1016/j.neuropharm.2016.02.009 · Cited by 108
Epigenetics and depressive disorders: a review of current progress and future directions
Januar, V., Saffery, R., & Ryan, J. (2015) · International Journal of Epidemiology · doi:10.1093/ije/dyu273 · Cited by 99
Sex differences: Transcriptional signatures of stress exposure in male and female brains
Brivio, E., Lopez, J. P., & Chen, A. (2020) · Genes, Brain and Behavior · doi:10.1111/gbb.12643 · Cited by 95
Self-citationZaidan, H., Leshem, M., & Gaisler-Salomon, I. (2013) · Biological Psychiatry · doi:10.1016/j.biopsych.2013.04.014 · Cited by 94
Epigenetic Risk Factors in PTSD and Depression
Raabe, F. J., & Spengler, D. (2013) · Frontiers in Psychiatry · doi:10.3389/fpsyt.2013.00080 · Cited by 100
Roth, T. L. (2013) · Development and Psychopathology · doi:10.1017/s0954579413000618 · Cited by 95
Lee, S., Kang, B., Kim, J. H., Min, J., Kim, H. S., Ryu, H., Park, H., Bae, S., Oh, D.-H., Choi, M., et al. (2018) · Scientific Reports · doi:10.1038/s41598-018-30875-y · Cited by 99
Effects of Psychological Stress on Hypertension in Middle-Aged Chinese: A Cross-Sectional Study
Hu, B., Liu, X., Yin, S., Fan, H., Feng, F., & Yuan, J. (2015) · PLoS ONE · doi:10.1371/journal.pone.0129163 · Cited by 88
Ahmed, A. A., Ma, W., Ni, Y., Zhou, Q., & Zhao, R. (2013) · Hormones and Behavior · doi:10.1016/j.yhbeh.2013.12.002 · Cited by 87
Ryan, J., Chaudieu, I., Ancelin, M.-L., & Saffery, R. (2016) · Epigenomics · doi:10.2217/epi-2016-0083 · Cited by 85
Progress in Epigenetics of Depression
Peña, C. J., & Nestler, E. J. (2018) · Progress in Molecular Biology and Translational Science · doi:10.1016/bs.pmbts.2017.12.011 · Cited by 84
Lenglos, C., Mitra, A., Guèvremont, G., & Timofeeva, E. (2013) · Genes Brain & Behavior · doi:10.1111/gbb.12028 · Cited by 82
Tiwari, A., & Gonzalez, A. (2018) · Clinical Psychology Review · doi:10.1016/j.cpr.2018.01.006 · Cited by 71
Hu, P., Liu, J., Maita, I., Kwok, C., Gu, E., Gergues, M. M., Kelada, F., Phan, M., Zhou, J.-N., Swaab, D. F., et al. (2020) · The Journal of Neuroscience · doi:10.1523/jneurosci.2410-19.2020 · Cited by 71
Corticotropin releasing factor in neuroplasticity
Regev, L., & Baram, T. Z. (2013) · Frontiers in Neuroendocrinology · doi:10.1016/j.yfrne.2013.10.001 · Cited by 72
Dearden, L., & Balthasar, N. (2014) · Endocrinology · doi:10.1210/en.2014-1131 · Cited by 75
Østerås, B., Sigmundsson, H., & Haga, M. (2015) · BMC Public Health · doi:10.1186/s12889-015-2414-x · Cited by 72
Uddin, M., Sipahi, L., Li, J., & Koenen, K. C. (2013) · Depression and Anxiety · doi:10.1002/da.22167 · Cited by 66
Weaver, I. C. G., Korgan, A. C., Lee, K., Wheeler, R. V., Hundert, A. S., & Goguen, D. (2017) · Frontiers in Behavioral Neuroscience · doi:10.3389/fnbeh.2017.00041 · Cited by 69
Molecular mechanisms of psychiatric diseases
Blokhin, I. O., Khorkova, O., Saveanu, R. V., & Wahlestedt, C. (2020) · Neurobiology of Disease · doi:10.1016/j.nbd.2020.105136 · Cited by 64
Placental CRH as a Signal of Pregnancy Adversity and Impact on Fetal Neurodevelopment
Kassotaki, I., Valsamakis, G., Mastorakos, G. P., & Grammatopoulos, D. K. (2021) · Frontiers in Endocrinology · doi:10.3389/fendo.2021.714214 · Cited by 67
Zhou, A., & Ryan, J. (2023) · Genes · doi:10.3390/genes14081639 · Cited by 57
“factor) and Crh in rodent models of chronic stress have been observed, although the effects appear to be both gender and brain region-dependent [42,43].”
BackgroundCellular and molecular mechanisms of sexual differentiation in the mammalian nervous system
Forger, N. G., Strahan, J. A., & Castillo‐Ruiz, A. (2016) · Frontiers in Neuroendocrinology · doi:10.1016/j.yfrne.2016.01.001 · Cited by 58
Elharrar, E., Warhaftig, G., Issler, O., Sztainberg, Y., Dikshtein, Y., Zahut, R., Redlus, L., Chen, A., & Yadid, G. (2013) · Biological Psychiatry · doi:10.1016/j.biopsych.2013.05.039 · Cited by 55
Self-citationLong-term impact of chronic variable stress in adolescence versus adulthood
Cotella, E. M., Gómez, A. S., Lemen, P. M., Chen, C., Fernández, G., Hansen, C., Herman, J. P., & Paglini, M. G. (2018) · Progress in Neuro-Psychopharmacology and Biological Psychiatry · doi:10.1016/j.pnpbp.2018.08.003 · Cited by 55
Tanti, A., Lutz, P.-É., Kim, J., O’Leary, L. A., Théroux, J., Turecki, G., & Mechawar, N. (2019) · Neuropsychopharmacology · doi:10.1038/s41386-019-0471-z · Cited by 56
van der Doelen, R. H. A., Arnoldussen, I. A. C., Ghareh, H., van Och, L., Homberg, J. R., & Kozicz, T. (2015) · Development and Psychopathology · doi:10.1017/s0954579414001345 · Cited by 55
Self-citationChemoarchitecture of the bed nucleus of the stria terminalis: Neurophenotypic diversity and function
Hammack, S. E., Braas, K. M., & May, V. (2021) · Handbook of clinical neurology · doi:10.1016/b978-0-12-819975-6.00025-x · Cited by 51
Andaloussi, Z. I. L., Taghzouti, K., & Abboussi, O. (2018) · International Journal of Developmental Neuroscience · doi:10.1016/j.ijdevneu.2018.11.007 · Cited by 53
Vuppaladhadiam, L., Ehsan, C., Akkati, M., & Bhargava, A. (2020) · Cells · doi:10.3390/cells9040839 · Cited by 50
The secret language of destiny: stress imprinting and transgenerational origins of disease
Zucchi, F. C. R., Yao, Y., & Metz, G. A. S. (2012) · Frontiers in Genetics · doi:10.3389/fgene.2012.00096 · Cited by 51
Scheich, B., Vincze, P., Szőke, É., Borbély, É., Hunyady, Á., Szolcsányi, J., Dénes, Á., Környei, Z., Gaszner, B., & Helyes, Z. (2017) · European Journal of Pain · doi:10.1002/ejp.1043 · Cited by 48
Self-citationPorcu, A., Vaughan, M. E., Nilsson, A., Arimoto, N., Lamia, K. A., & Welsh, D. K. (2020) · Proceedings of the National Academy of Sciences · doi:10.1073/pnas.2000258117 · Cited by 44
Kormos, V., Gáspár, L., Kovács, L. Á., Farkas, J. I., Gaszner, T., CSERNUS, V. J., Balogh, A., Hashimoto, H., Reglődi, D., Helyes, Z., et al. (2016) · Neuroscience · doi:10.1016/j.neuroscience.2016.06.004 · Cited by 49
Self-citationScheich, B., Csekő, K., Borbély, É., Ábrahám, I. M., CSERNUS, V. J., Gaszner, B., & Helyes, Z. (2017) · Neuroscience · doi:10.1016/j.neuroscience.2017.01.039 · Cited by 47
Self-citationWILLIAMS, E. S., Mazei‐Robison, M. S., & Robison, A. J. (2021) · Cold Spring Harbor Perspectives in Biology · doi:10.1101/cshperspect.a039198 · Cited by 44
Brown, A., Fiori, L. M., & Turecki, G. (2019) · Frontiers in Genetics · doi:10.3389/fgene.2019.00229 · Cited by 39
The Lasting Legacy of Social Stress on the Epigenome of the Hypothalamic–Pituitary–Adrenal Axis
Hoffmann, A., & Spengler, D. (2012) · Epigenomics · doi:10.2217/epi.12.34 · Cited by 37
Estrogen in prefrontal cortex blocks stress-induced cognitive impairments in female rats
Yuen, E. Y., Jing, W., & Yan, Z. (2015) · The Journal of Steroid Biochemistry and Molecular Biology · doi:10.1016/j.jsbmb.2015.08.028 · Cited by 36
Transcriptional regulation of corticotropin-releasing hormone gene in stress response
Zhou, J.-N., & Fang, H. (2018) · IBRO Reports · doi:10.1016/j.ibror.2018.08.003 · Cited by 36
Pandey, G. N., Rizavi, H. S., Bhaumik, R., & Ren, X. (2019) · Psychoneuroendocrinology · doi:10.1016/j.psyneuen.2019.04.015 · Cited by 34
Duan, D.-M., Tu, Y., Liu, P., & Jiao, S. (2016) · Neural Regeneration Research · doi:10.4103/1673-5374.193238 · Cited by 33
Gao, Y., & Rodríguez, L. V. (2022) · Frontiers in Physiology · doi:10.3389/fphys.2022.818993 · Cited by 35
Corticotropin-Releasing Hormone Receptor 1 Gene Variants in Irritable Bowel Syndrome
Sato, N., Suzuki, N., Sasaki, A., Aizawa, E., Obayashi, T., Kanazawa, M., Mizuno, T., Kano, M., Aoki, M., & Fukudo, S. (2012) · PLoS ONE · doi:10.1371/journal.pone.0042450 · Cited by 25
Epigenetic mechanisms underlying stress-induced depression
de Carvalho, L. M., Chen, W.-Y., & Lasek, A. W. (2020) · International review of neurobiology · doi:10.1016/bs.irn.2020.08.001 · Cited by 33
Yuen, E. Y., Wei, J., & Yan, Z. (2017) · The International Journal of Neuropsychopharmacology · doi:10.1093/ijnp/pyx052 · Cited by 31
Perinatal stress and epigenetics.
(2021) · Handbook of Clinical Neurology · doi:10.1016/b978-0-12-820107-7.00008-2 · Cited by 28
Epigenetics of Fear, Anxiety and Stress – Focus on Histone Modifications
Ell, M. A., Schiele, M. A., Iovino, N., & Domschke, K. (2023) · Current Neuropharmacology · doi:10.2174/1570159x21666230322154158 · Cited by 29
Chaby, L. E., Sadik, N., Burson, N. A., Lloyd, S. C., O’Donnel, K., Winters, J. J., Conti, A. C., Liberzon, I., & Perrine, S. A. (2020) · Scientific Reports · doi:10.1038/s41598-020-74481-3 · Cited by 26
Janitzky, K., Peine, A., Kröber, A., Yanagawa, Y., Schwegler, H., & Roskoden, T. (2014) · Behavioural Brain Research · doi:10.1016/j.bbr.2014.06.020 · Cited by 27
Stress and Resilience in Functional Somatic Syndromes – A Structural Equation Modeling Approach
Fischer, S., Lemmer, G., Gollwitzer, M., & Nater, U. M. (2014) · PLoS ONE · doi:10.1371/journal.pone.0111214 · Cited by 27
Tezval, H., Dubrowinskaja, N., Peters, I., Reese, C., Serth, K., Atschekzei, F., Hennenlotter, J., Stenzl, A., Kuczyk, M. A., & Serth, J. (2016) · PLoS ONE · doi:10.1371/journal.pone.0163873 · Cited by 26
Heterogeneity in major depressive disorder: The need for biomarker-based personalized treatments
Suseelan, S., & Pinna, G. (2022) · Advances in clinical chemistry · doi:10.1016/bs.acc.2022.09.001 · Cited by 28
Rosinger, Z. J., Guzman, R. M. D., Jacobskind, J. S., Saglimbeni, B., Malone, M., Fico, D., Justice, N. J., Forni, P. E., & Zuloaga, D. G. (2020) · Physiology & Behavior · doi:10.1016/j.physbeh.2020.112847 · Cited by 24
Varodayan, F. P., Khom, S., Patel, R. R., Steinman, M. Q., Hedges, D. M., Oleata, C. S., Homanics, G. E., Roberto, M., & Bajo, M. (2017) · Alcohol and Alcoholism · doi:10.1093/alcalc/agx114 · Cited by 24
The molecular basis of depression: implications of sex-related differences in epigenetic regulation
Kawatake-Kuno, A., Murai, T., & Uchida, S. (2021) · Frontiers in Molecular Neuroscience · doi:10.3389/fnmol.2021.708004 · Cited by 23
Chronic stress and adipose tissue in the anorexic state: endocrine and epigenetic mechanisms
Xiao, Y., Liu, D., Cline, M. A., & Gilbert, E. R. (2020) · Adipocyte · doi:10.1080/21623945.2020.1803643 · Cited by 25
Depressive disorder and antidepressants from an epigenetic point of view
Arčan, I. Š., Kouter, K., & Paska, A. V. (2022) · World Journal of Psychiatry · doi:10.5498/wjp.v12.i9.1150 · Cited by 27
Kovács, L. Á., Berta, G., CSERNUS, V. J., Ujvari, B., Füredi, N., & Gaszner, B. (2019) · Frontiers in Aging Neuroscience · doi:10.3389/fnagi.2019.00274 · Cited by 20
Self-citationSink, K. S., Davis, M., & Walker, D. L. (2013) · Learning & Memory · doi:10.1101/lm.032482.113 · Cited by 23
Yadawa, A. K., & Chaturvedi, C. M. (2016) · General and Comparative Endocrinology · doi:10.1016/j.ygcen.2016.03.005 · Cited by 22
Calvez, J., de Ávila, C., Guèvremont, G., & Timofeeva, E. (2016) · Appetite · doi:10.1016/j.appet.2016.09.010 · Cited by 21
Genome and stress-reaction in animals and humans
Dyuzhikova, N. A., & Даев, Е. В. (2018) · Ecological genetics · doi:10.17816/ecogen1614-26 · Cited by 22
Onakomaiya, M. M., Porter, D. M., Oberlander, J. G., & Henderson, L. (2014) · Hormones and Behavior · doi:10.1016/j.yhbeh.2014.04.008 · Cited by 20
Social defeat stress induces genome-wide 5mC and 5hmC alterations in the mouse brain
Kuehner, J. N., Walia, N. R., Seong, R., Li, Y., Martínez-Feduchi, P., & Yao, B. (2023) · G3 Genes Genomes Genetics · doi:10.1093/g3journal/jkad114 · Cited by 20
Andreotti, C., Garrard, P., Venkatraman, S., & Compas, B. E. (2014) · Cognitive Therapy and Research · doi:10.1007/s10608-014-9659-z · Cited by 20
An example of DNA methylation as a means to quantify stress in wildlife using killer whales
Crossman, C. A., Barrett-Lennard, L. G., & Frasier, T. R. (2021) · Scientific Reports · doi:10.1038/s41598-021-96255-1 · Cited by 20
Kolasa, M., Faron‐Górecka, A., Kuśmider, M., Szafran‐Pilch, K., Solich, J., Żurawek, D., Gruca, P., Papp, M., & Dziedzicka‐Wasylewska, M. (2014) · Peptides · doi:10.1016/j.peptides.2014.09.008 · Cited by 19
Agoglia, A. E., Crofton, E. J., & Herman, M. A. (2020) · Neuropharmacology · doi:10.1016/j.neuropharm.2020.108045 · Cited by 20
Agoglia, A. E., Zhu, M., Quadir, S. G., Bluitt, M. N., Douglass, E. A., Hanback, T., Tella, J., Ying, R., Hodge, C. W., & Herman, M. A. (2021) · Addiction Biology · doi:10.1111/adb.13067 · Cited by 19
van der Doelen, R. H. A., Robroch, B., Arnoldussen, I. A. C., Schulpen, M., Homberg, J. R., & Kozicz, T. (2016) · Neuroscience · doi:10.1016/j.neuroscience.2016.10.072 · Cited by 20
Self-citationKovács, L. Á., Füredi, N., Ujvari, B., Golgol, A., & Gaszner, B. (2022) · Frontiers in Aging Neuroscience · doi:10.3389/fnagi.2022.862098 · Cited by 22
Self-citationProtective Effects of PACAP in a Rat Model of Diabetic Neuropathy
Kiss, P., Banki, E., Gaszner, B., Nagy, D., Helyes, Z., Pál, E., Reman, G., Tóth, G. K., Tamás, A., & Reglődi, D. (2021) · International Journal of Molecular Sciences · doi:10.3390/ijms221910691 · Cited by 17
Self-citationTraslaviña, G. A. A., & Franci, C. R. (2012) · Endocrinology · doi:10.1210/en.2012-1333 · Cited by 17
Central Neuroepigenetic Regulation of the Hypothalamic–Pituitary–Adrenal Axis
Dick, A. L. W., & Provençal, N. (2018) · Progress in molecular biology and translational science · doi:10.1016/bs.pmbts.2018.04.006 · Cited by 17
Inslicht, S. S., Richards, A. L., Madden, E., Rao, M. N., O’Donovan, A., Talbot, L. S., Rucker, E., Metzler, T. J., Hauger, R. L., & Neylan, T. C. (2014) · Psychopharmacology · doi:10.1007/s00213-014-3621-3 · Cited by 17
Metadata
- Authors
- Sterrenburg, L., Gaszner, B., Boerrigter, J., Santbergen, L., Bramini, M., Elliott, E., Chen, A., Peeters, B. W. M. M., Roubos, E. W., & Kozicz, T.
- Affiliations
- Radboud University Nijmegen (NL)
- University of Pecs (HU)
- Bar-Ilan University (IL)
- Weizmann Institute of Science (IL)
- Corresponding author
- Kozicz, Tamás
- Venue
- PLoS ONE
- Publisher
- Public Library of Science (PLoS)
- Published
- 2011-11-23
- Volume
- 6
- Issue
- 11
- Pages
- e28128
- ISSN
- 1932-6203 (ISSN-L)
- PMC
- PMC3223222
- OpenAlex
- W2159916106
- Cited by
- 149
- References
- 80
- Citations by year
- 2026: 4 · 2025: 3 · 2024: 1 · 2023: 8 · 2022: 11 · 2021: 12 · 2020: 17 · 2019: 10 · 2018: 10 · 2017: 9 · 2016: 16 · 2015: 9 · 2014: 15 · 2013: 13 · 2012: 10
- FWCI
- 4.90
- Type
- journal article
- Language
- en
- Open access
- gold
- doi.org
- Locations
- PLoS ONE (publishedVersion, cc-by)
- PubMed Central (publishedVersion, cc-by)
- PubMed (publishedVersion)
- Institutional Repository of the University of Granada (University of Granada) (submittedVersion, cc-by-nc-nd)
- DOAJ (DOAJ: Directory of Open Access Journals) (submittedVersion, cc-by-sa)
- Figshare (submittedVersion, cc-by)
- Radboud Repository (Radboud University) (submittedVersion)
- Radboud Repository (Radboud University) (submittedVersion, other-oa)
- Funders
- Nederlandse Organisatie voor Wetenschappelijk Onderzoek (864.05.008)
- Magyar Tudományos Akadémia
- Topics
- Life Sciences › Neuroscience › Behavioral Neuroscience › Stress Responses and Cortisol
- Life Sciences › Biochemistry, Genetics and Molecular Biology › Molecular Biology › Epigenetics and DNA Methylation
- Life Sciences › Neuroscience › Cellular and Molecular Neuroscience › Neurotransmitter Receptor Influence on Behavior
- Keywords
- corticotropin-releasing factor, DNA methylation, sex differences, depression, hypothalamic paraventricular nucleus, bed nucleus of the stria terminalis, central amygdala, CREB-binding protein, HDAC5, c-fos, FosB, immediate early genes, epigenetic regulation, stress response
- MeSH terms
- Animals, Body Weight, Chronic Disease, Corticosterone, Corticotropin-Releasing Hormone, Female, Gene Expression Regulation, Immunohistochemistry, Male, Models, Biological, Paraventricular Hypothalamic Nucleus, Septal Nuclei, Sex Characteristics, Stress, Psychological, Rats, Wistar, In Situ Hybridization, DNA Methylation, Epigenesis, Genetic, Rats
About these checks
Registry, retraction, Cites and statistics results are computed, not judged, with one exception: a printed reference that no index lists is read once by a model before it counts as a citation error. Claims are extracted by a model and kept only when their quote appears verbatim in the text; each cited source is then checked, with a model’s help, for whether it says what the claim relies on. Those verdicts can be wrong — read the claim’s quote and the cited source before relying on one.
Statistics and arithmetic are recomputed, not judged.
Confidence bands are shown only for fields calibrated on our annotated test set. None is calibrated yet, so no band is shown.
What counts as a claim ›How we measure confidence ›How we check this ›
Are you an author, or do you see a problem with this page? Request a review
