

The DOI matches its Crossref record; 26 of the 26 references it cites were found in a registry or an index.
Macrophage Inhibitory Cytokine 1 (MIC-1/GDF15) Decreases Food Intake, Body Weight and Improves Glucose Tolerance in Mice on Normal & Obesogenic Diets
Open accessAbstract
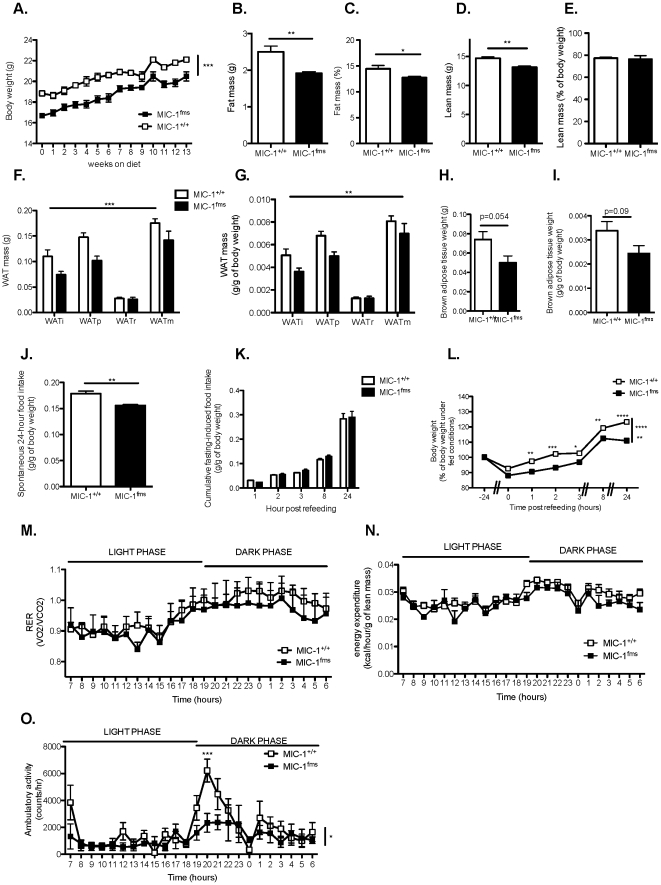
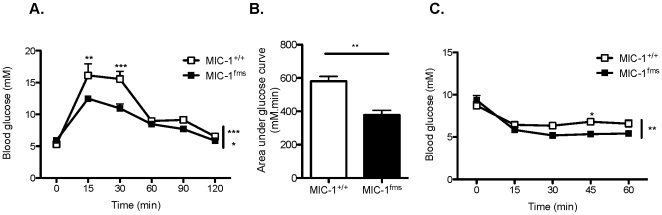
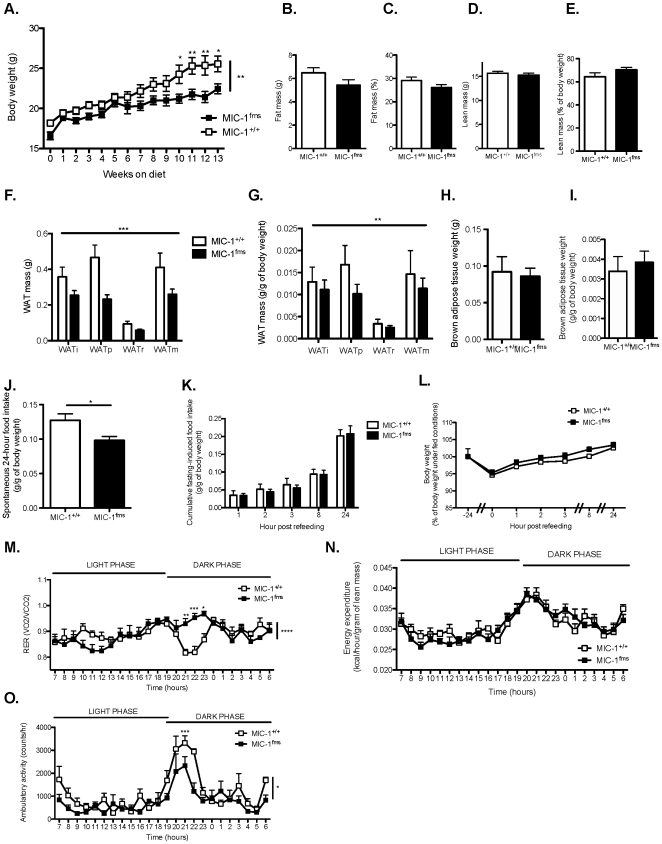
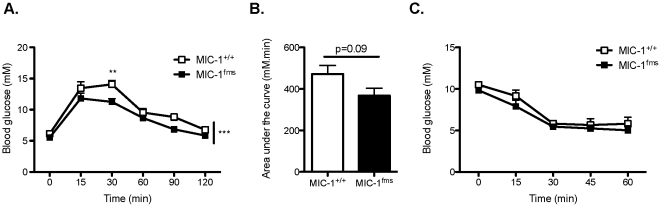
Food intake and body weight are controlled by a variety of central and peripheral factors, but the exact mechanisms behind these processes are still not fully understood. Here we show that that macrophage inhibitory cytokine-1 (MIC-1/GDF15), known to have anorexigenic effects particularly in cancer, provides protection against the development of obesity. Both under a normal chow diet and an obesogenic diet, the transgenic overexpression of MIC-1/GDF15 in mice leads to decreased body weight and fat mass. This lean phenotype was associated with decreased spontaneous but not fasting-induced food intake, on a background of unaltered energy expenditure and reduced physical activity. Importantly, the overexpression of MIC-1/GDF15 improved glucose tolerance, both under normal and high fat-fed conditions. Altogether, this work shows that the molecule MIC-1/GDF15 might be beneficial for the treatment of obesity as well as perturbations in glucose homeostasis.
Overview
The claims and statistics of this paper haven’t been checked yet.
Run the check — free, no account needed. It reads the open-access text and checks the sources it cites.
Integrity signals
Registry
Cites
Statistics
Figures
Verification
Claims the paper makes
The claims and statistics of this paper haven’t been checked yet.
Run the check — free, no account needed. It reads the open-access text and checks the sources it cites.
Claims other papers make about this one
Each is checked against this paper’s own text: does it say what the citing paper says it does?
In the citing paper
“On the contrary, overexpressing GDF-15 led to decreased body weight, fat mass and food intake, improving the glucose tolerance in mouse models (83, 108–110).”
From GDF-15 as a Weight Watcher for Diabetic and Non-Diabetic People Treated With Metformin (2020) · cites this paper as [110]
Self-check
Percentages, sums and reported differences re-computed from the paper’s own numbers.
The self-check needs the paper’s full text.
Citations
Cites
Calculation of substrate oxidation rates in vivo from gaseous exchange.
Frayn, K. N. (1983) · Journal of Applied Physiology · doi:10.1152/jappl.1983.55.2.628 · Cited by 2,365
Adipose tissue as an endocrine organ
Galić, S., Oakhill, J. S., & Steinberg, G. R. (2009) · Molecular and Cellular Endocrinology · doi:10.1016/j.mce.2009.08.018 · Cited by 1,654
The theoretical bases of indirect calorimetry: A review
Ferrannini, E. (1988) · Metabolism · doi:10.1016/0026-0495(88)90110-2 · Cited by 1,604
MIC-1, a novel macrophage inhibitory cytokine, is a divergent member of the TGF-β superfamily
Bootcov, M. R., Bauskin, A. R., Valenzuela, S. M., Moore, A. G., Bansal, M., He, X. Y., Zhang, H. P., Donnellan, M., Mahler, S. M., Pryor, K., et al. (1997) · Proceedings of the National Academy of Sciences · doi:10.1073/pnas.94.21.11514 · Cited by 1,180
New role of bone morphogenetic protein 7 in brown adipogenesis and energy expenditure
Tseng, Y.-H., Kokkotou, E., Schulz, T. J., Huang, T. L., Winnay, J. N., Taniguchi, C. M., Tran, T. T., Suzuki, R., Espinoza, D. O., Yamamoto, Y., et al. (2008) · Nature · doi:10.1038/nature07221 · Cited by 1,099
Obesity in the mouse model of pro-opiomelanocortin deficiency responds to peripheral melanocortin
Yaswen, L. R., Diehl, N. L., Brennan, M. B., & Hochgeschwender, U. (1999) · Nature Medicine · doi:10.1038/12506 · Cited by 1,039
Diet-induced obese mice develop peripheral, but not central, resistance to leptin.
van Heek, M., Compton, D. S., France, C. F., Tedesco, R. P., Fawzi, A. B., Graziano, M. P., Sybertz, E. J., Strader, C. D., & Davis, H. (1997) · Journal of Clinical Investigation · doi:10.1172/jci119171 · Cited by 765
Protection from obesity and diabetes by blockade of TGF-β/smad3 signaling
Yadav, H., Quijano, C., Kamaraju, A. K., Gavrilova, O., Malek, R., Chen, W., Zerfas, P., Zhigang, D., Wright, E. C., Stuelten, C., et al. (2011) · Cell Metabolism · doi:10.1016/j.cmet.2011.04.013 · Cited by 709
Tumor-induced anorexia and weight loss are mediated by the TGF-β superfamily cytokine MIC-1
Johnen, H., Lin, S., Kuffner, T., Brown, D. A., Tsai, V. W.-W., Bauskin, A. R., Wu, L., Pankhurst, G., Jiang, L., Junankar, S., et al. (2007) · Nature Medicine · doi:10.1038/nm1677 · Cited by 612
Self-citationMcLean, J. A., & Tobin, G. (1988) · Cambridge University Press eBooks · doi:10.1017/cbo9780511663161 · Cited by 396
Cited by
Sorted by citations
GFRAL is the receptor for GDF15 and the ligand promotes weight loss in mice and nonhuman primates
Mullican, S. E., Lin-Schmidt, X., Chin, C.-N., Chavez, J. A., Furman, J. L., Armstrong, A. A., Beck, S. C., South, V. J., Dinh, T. Q., Cash-Mason, T. D., et al. (2017) · Nature Medicine · doi:10.1038/nm.4392 · Cited by 774
GFRAL is the receptor for GDF15 and is required for the anti-obesity effects of the ligand
Yang, L., Chang, C.-C., Sun, Z., Madsen, D., Zhu, H., Padkjær, S. B., Wu, X., Huang, T., Hultman, K., Paulsen, S. J., et al. (2017) · Nature Medicine · doi:10.1038/nm.4394 · Cited by 668
GDF15 Provides an Endocrine Signal of Nutritional Stress in Mice and Humans
Patel, S., Alvarez-Guaita, A., Melvin, A., Rimmington, D., Dattilo, A., Miedzybrodzka, E. L., Cimino, I., Maurin, A.-C., Roberts, G. P., Meek, C. L., et al. (2019) · Cell Metabolism · doi:10.1016/j.cmet.2018.12.016 · Cited by 509
GDF15: emerging biology and therapeutic applications for obesity and cardiometabolic disease
Wang, D., Day, E. A., Townsend, L. K., Djordjevic, D., Jørgensen, S. B., & Steinberg, G. R. (2021) · Nature Reviews Endocrinology · doi:10.1038/s41574-021-00529-7 · Cited by 543
GDF15 Is an Inflammation-Induced Central Mediator of Tissue Tolerance
Luan, H. H., Wang, A., Hilliard, B. K., Carvalho, F., Rosen, C. E., Ahasic, A. M., Herzog, E. L., Kang, I., Pisani, M. A., Yu, S., et al. (2019) · Cell · doi:10.1016/j.cell.2019.07.033 · Cited by 527
Adela, R., & Banerjee, S. K. (2015) · Journal of Diabetes Research · doi:10.1155/2015/490842 · Cited by 474
Tsai, V. W.-W., Husaini, Y., Sainsbury, A., Brown, D. A., & Breit, S. N. (2018) · Cell Metabolism · doi:10.1016/j.cmet.2018.07.018 · Cited by 424
Growth differentiation factor 15 is a myomitokine governing systemic energy homeostasis
Chung, H. K., Ryu, D., Kim, K. S., Chang, J. Y., Kim, Y. K., Yi, H.-S., Kang, S. G., Choi, M. J., Lee, S. E., Jung, S.-B., et al. (2017) · Journal of Cell Biology · doi:10.1083/jcb.201607110 · Cited by 357
Day, E. A., Ford, R. J., Smith, B. K., Mohammadi-Shemirani, P., Morrow, M. R., Gutgesell, R. M., Lu, R., Raphenya, A. R., Kabiri, M., McArthur, A. G., et al. (2019) · Nature Metabolism · doi:10.1038/s42255-019-0146-4 · Cited by 307
GDF15 promotes weight loss by enhancing energy expenditure in muscle
Wang, D., Townsend, L. K., DesOrmeaux, G. J., Frangos, S. M., Batchuluun, B., Dumont, L., Kuhre, R. E., Ahmadi, E., Hu, S., Rebalka, I. A., et al. (2023) · Nature · doi:10.1038/s41586-023-06249-4 · Cited by 272
GDF15: a hormone conveying somatic distress to the brain
Lockhart, S. M., Saudek, V., & O’Rahilly, S. (2020) · Endocrine Reviews · doi:10.1210/endrev/bnaa007 · Cited by 256
Ren, Y., Zhao, H., Yin, C., Lan, X., Wu, L., Du, X., Griffiths, H. R., & Gao, D. (2022) · Frontiers in Endocrinology · doi:10.3389/fendo.2022.873699 · Cited by 276
NAG-1/GDF-15 prevents obesity by increasing thermogenesis, lipolysis and oxidative metabolism
Chrysovergis, K., Wang, X., Kosak, J., Lee, S.-H., Kim, J. S., Foley, J. F., Travlos, G., Singh, S., Baek, S. J., & Eling, T. E. (2014) · International Journal of Obesity · doi:10.1038/ijo.2014.27 · Cited by 241
Long-acting MIC-1/GDF15 molecules to treat obesity: Evidence from mice to monkeys
Xiong, Y., Walker, K., Min, X., Hale, C., Tran, T., Komorowski, R., Yang, J., Davda, J., Nuanmanee, N., Kemp, D., et al. (2017) · Science Translational Medicine · doi:10.1126/scitranslmed.aan8732 · Cited by 236
The GDF15-GFRAL Pathway in Health and Metabolic Disease: Friend or Foe?
Breit, S. N., Brown, D. A., & Tsai, V. W.-W. (2020) · Annual Review of Physiology · doi:10.1146/annurev-physiol-022020-045449 · Cited by 237
Baek, S. J., & Eling, T. (2019) · Pharmacology & Therapeutics · doi:10.1016/j.pharmthera.2019.02.008 · Cited by 194
The interplay of immunology and cachexia in infection and cancer
Baazim, H., Antonio-Herrera, L., & Bergthaler, A. (2021) · Nature reviews. Immunology · doi:10.1038/s41577-021-00624-w · Cited by 192
GDF15, an emerging key player in human aging
Conte, M., Giuliani, C., Chiariello, A., Iannuzzi, V., Franceschi, C., & Salvioli, S. (2022) · Ageing Research Reviews · doi:10.1016/j.arr.2022.101569 · Cited by 202
TGF-b superfamily cytokine MIC-1/GDF15 is a physiological appetite and body weight regulator
Tsai, V. W.-W., Macia, L., Johnen, H., Kuffner, T., Manadhar, R., Jørgensen, S. B., Lee-Ng, K. K. M., Zhang, H. P., Wu, L., Marquis, C. P., et al. (2013) · PLoS ONE · doi:10.1371/journal.pone.0055174 · Cited by 188
Exercise increases circulating GDF15 in humans
Kleinert, M., Clemmensen, C., Sjøberg, K. A., Carl, C. S., Jeppesen, J. F., Wojtaszewski, J. F. P., Kiens, B., & Richter, E. A. (2018) · Molecular Metabolism · doi:10.1016/j.molmet.2017.12.016 · Cited by 195
The Adipokine Hypothesis of Heart Failure With a Preserved Ejection Fraction
Packer, M. (2025) · Journal of the American College of Cardiology · doi:10.1016/j.jacc.2025.06.055 · Cited by 213
Pathophysiological role of growth differentiation factor 15 (GDF15) in obesity, cancer, and cachexia
Siddiqui, J. A., Pothuraju, R., Κhan, P., Sharma, G., Muniyan, S., Seshacharyulu, P., Jain, M., Nasser, M. W., & Batra, S. K. (2021) · Cytokine & Growth Factor Reviews · doi:10.1016/j.cytogfr.2021.11.002 · Cited by 187
Kempf, T., Guba-Quint, A., Torgerson, J., Magnone, M. C., Haefliger, C., Bobadilla, M., & Wollert, K. C. (2012) · European Journal of Endocrinology · doi:10.1530/eje-12-0466 · Cited by 176
Insights Into Mechanisms of GDF15 and Receptor GFRAL: Therapeutic Targets
Rochette, L., Zeller, M., Cottin, Y., & Vergely, C. (2020) · Trends in Endocrinology and Metabolism · doi:10.1016/j.tem.2020.10.004 · Cited by 173
Emmerson, P. J., Duffin, K. L., Chintharlapalli, S. R., & Wu, X. (2018) · Frontiers in Physiology · doi:10.3389/fphys.2018.01712 · Cited by 178
GDF15, an update of the physiological and pathological roles it plays: a review
Assadi, A., Zahabi, A., & Hart, R. A. (2020) · Pflügers Archiv - European Journal of Physiology · doi:10.1007/s00424-020-02459-1 · Cited by 146
Regulation of myokine expression: Role of exercise and cellular stress
Ost, M., Coleman, V., Kasch, J., & Klaus, S. (2016) · Free Radical Biology and Medicine · doi:10.1016/j.freeradbiomed.2016.02.018 · Cited by 135
Organoid-based modeling of intestinal development, regeneration, and repair
Sprangers, J., Zaalberg, I. C., & Maurice, M. M. (2020) · Cell Death and Differentiation · doi:10.1038/s41418-020-00665-z · Cited by 137
Novel Noninvasive Approaches to the Treatment of Obesity: From Pharmacotherapy to Gene Therapy
Angelidi, A. M., Belanger, M. J., Kokkinos, A. D., Koliaki, C. C., & Mantzoros, C. S. (2021) · Endocrine Reviews · doi:10.1210/endrev/bnab034 · Cited by 141
Uniting GDF15 and GFRAL: Therapeutic Opportunities in Obesity and Beyond
Mullican, S. E., & Rangwala, S. M. (2018) · Trends in Endocrinology & Metabolism · doi:10.1016/j.tem.2018.05.002 · Cited by 127
Tsai, V. W.-W., Manandhar, R., Jørgensen, S. B., Lee-Ng, K. K. M., Zhang, H. P., Marquis, C. P., Jiang, L., Husaini, Y., Lin, S., Sainsbury, A., et al. (2014) · PLoS ONE · doi:10.1371/journal.pone.0100370 · Cited by 129
Ost, M., Gil, C. I., Coleman, V., Keipert, S., Efstathiou, S., Vidic, V., Weyers, M., & Klaus, S. (2020) · EMBO Reports · doi:10.15252/embr.201948804 · Cited by 124
Hindbrain circuits in the control of eating behaviour and energy balance
Cheng, W., Gordian, D., Ludwig, M. Q., Pers, T. H., Seeley, R. J., & Myers, M. G. (2022) · Nature Metabolism · doi:10.1038/s42255-022-00606-9 · Cited by 129
Benichou, O., Coskun, T., Gonciarz, M. D., Garhyan, P., Adams, A. C., Du, Y., Dunbar, J. D., Martin, J. A., Mather, K. J., Pickard, R. T., et al. (2023) · Cell Metabolism · doi:10.1016/j.cmet.2022.12.011 · Cited by 115
Li, J., Yang, L., Qin, W., Zhang, G., Yuan, J., & Wang, F. (2013) · PLoS ONE · doi:10.1371/journal.pone.0065549 · Cited by 110
Bao, X., Borné, Y., Muhammad, I. F., Nilsson, J. Å., Lind, L., Melander, O., Niu, K., Orho‐Melander, M., & Engström, G. (2018) · Diabetologia · doi:10.1007/s00125-018-4751-7 · Cited by 110
Ketone ester supplementation blunts overreaching symptoms during endurance training overload
Poffé, C., Ramaekers, M., Thienen, R. V., & Hespel, P. (2019) · The Journal of Physiology · doi:10.1113/jp277831 · Cited by 120
Inflammatory Signaling and Brown Fat Activity
Omran, F., & Christian, M. (2020) · Frontiers in Endocrinology · doi:10.3389/fendo.2020.00156 · Cited by 111
GDF15 mediates the metabolic effects of PPARβ/δ by activating AMPK
Aguilar-Recarte, D., Barroso, E., Gumà, A., Pizarro‐Delgado, J., Peña, L., Ruart, M., Palomer, X., Wahli, W., & Vázquez‐Carrera, M. (2021) · Cell Reports · doi:10.1016/j.celrep.2021.109501 · Cited by 111
Tsai, V. W.-W., Lin, S., Brown, D. A., Salis, A., & Breit, S. N. (2015) · International Journal of Obesity · doi:10.1038/ijo.2015.242 · Cited by 109
Growth differentiation factor 15: A novel biomarker with high clinical potential
Desmedt, S., Desmedt, V., Vos, L. D., Delanghe, J., Speeckaert, R., & Speeckaert, M. M. (2019) · Critical Reviews in Clinical Laboratory Sciences · doi:10.1080/10408363.2019.1615034 · Cited by 105
Activation of the hypothalamic–pituitary–adrenal axis by exogenous and endogenous GDF15
Cimino, I., Kim, H., Tung, Y. C. L., Pedersen, K., Rimmington, D., Tadross, J. A., Kohnke, S., Neves‐Costa, A., Barros, A., Joaquim, S., et al. (2021) · Proceedings of the National Academy of Sciences · doi:10.1073/pnas.2106868118 · Cited by 106
Tsai, V. W.-W., Zhang, H. P., Manandhar, R., Lee-Ng, K. K. M., Lebhar, H., Marquis, C. P., Husaini, Y., Sainsbury, A., Brown, D. A., & Breit, S. N. (2017) · International Journal of Obesity · doi:10.1038/ijo.2017.258 · Cited by 104
Brown Adipocytes Secrete GDF15 in Response to Thermogenic Activation
Campderrós, L., Moure, R., Cairó, M., Gavaldà‐Navarro, A., Quesada‐López, T., Cereijo, R., Giralt, M., Villarroya, J., & Villarroya, F. (2019) · Obesity · doi:10.1002/oby.22584 · Cited by 102
Sjøberg, K. A., Sigvardsen, C. M., Alvarado-Diaz, A., Andersen, N. R., Larance, M., Seeley, R. J., Schjerling, P., Knudsen, J. G., Katzilieris‐Petras, G., Clemmensen, C., et al. (2023) · Cell Metabolism · doi:10.1016/j.cmet.2023.06.016 · Cited by 98
Semba, R. D., Gonzalez-Freire, M., Tanaka, T., Biancotto, A., Zhang, P., Shardell, M., Moaddel, R., CHI Consortium, & Ferrucci, L. (2020) · The Journals of Gerontology Series A · doi:10.1093/gerona/glz071 · Cited by 94
GDF15 deficiency promotes high fat diet-induced obesity in mice
Tran, T., Yang, J. O., Gardner, J., & Xiong, Y. (2018) · PLoS ONE · doi:10.1371/journal.pone.0201584 · Cited by 97
Tsai, V. W.-W., Macia, L., Feinle‐Bisset, C., Manandhar, R., Astrup, A. V., Raben, A., Lorenzen, J. K., Schmidt, P. T., Wiklund, F. E., Pedersen, N. L., et al. (2015) · PLoS ONE · doi:10.1371/journal.pone.0133362 · Cited by 96
Worth, A. A., Shoop, R., Tye, K., Feetham, C. H., D’Agostino, G., Dodd, G. T., Reimann, F. M., Gribble, F. M., Beebe, E., Dunbar, J. D., et al. (2020) · eLife · doi:10.7554/elife.55164 · Cited by 92
Growth differentiation factor-15 and its role in diabetes and cardiovascular disease
Eddy, A. C., & Trask, A. J. (2020) · Cytokine & Growth Factor Reviews · doi:10.1016/j.cytogfr.2020.11.002 · Cited by 94
NAG-1/GDF15 accumulates in the nucleus and modulates transcriptional regulation of the Smad pathway
Min, K.-W., Liggett, J. L., SILVA, G. H. D. O., Wu, W., Wang, R., Shen, R.-F., Eling, T. E., & Baek, S. J. (2015) · Oncogene · doi:10.1038/onc.2015.95 · Cited by 90
Growth Differentiation Factor 15 in Adverse Cardiac Remodelling: From Biomarker to Causal Player
Wesseling, M., de Poel, J. H. C., & de Jager, S. C. A. (2020) · ESC Heart Failure · doi:10.1002/ehf2.12728 · Cited by 85
Anorexia/cachexia of chronic diseases: a role for the TGF‐β family cytokine MIC‐1/GDF15
Tsai, V. W.-W., Husaini, Y., Manandhar, R., Lee-Ng, K. K. M., Zhang, H. P., Harriott, K., Jiang, L., Lin, S., Sainsbury, A., Brown, D. A., et al. (2012) · Journal of Cachexia Sarcopenia and Muscle · doi:10.1007/s13539-012-0082-6 · Cited by 86
The roles of FGF21 and GDF15 in mediating the mitochondrial integrated stress response
Jena, J., García-Peña, L. M., & Pereira, R. O. (2023) · Frontiers in Endocrinology · doi:10.3389/fendo.2023.1264530 · Cited by 78
Obesity, Inflammation, and Lung Injury (OILI): The Good
Wang, C. (2014) · Mediators of Inflammation · doi:10.1155/2014/978463 · Cited by 78
GDF15 mediates adiposity resistance through actions on GFRAL neurons in the hindbrain AP/NTS
Tsai, V. W.-W., Zhang, H. P., Manandhar, R., Schofield, P., Christ, D., Lee-Ng, K. K. M., Lebhar, H., Marquis, C. P., Husaini, Y., Brown, D. A., et al. (2019) · International Journal of Obesity · doi:10.1038/s41366-019-0365-5 · Cited by 71
Factors mediating exercise‐induced organ crosstalk
Sabaratnam, R., Wojtaszewski, J. F. P., & Højlund, K. (2022) · Acta Physiologica · doi:10.1111/apha.13766 · Cited by 70
GDF15/GFRAL Pathway as a Metabolic Signature for Cachexia in Patients with Cancer
Ahmed, D. S., Isnard, S., Lin, J. C.-Y., Routy, B., & Routy, J. (2020) · Journal of Cancer · doi:10.7150/jca.50376 · Cited by 71
Exercise training promotes a GDF15-associated reduction in fat mass in older adults with obesity
Zhang, H., Fealy, C. E., & Kirwan, J. P. (2019) · American Journal of Physiology-Endocrinology and Metabolism · doi:10.1152/ajpendo.00439.2018 · Cited by 65
Lee, S. E., Kang, S., Choi, M. J., Jung, S.-B., Ryu, M. J., Chung, H. K., Chang, J. Y., Kim, Y. K., Lee, J. H., Kim, K. S., et al. (2017) · Diabetes · doi:10.2337/db17-0333 · Cited by 65
GDF15 is a major determinant of ketogenic diet-induced weight loss
Lu, J. F., Zhu, M., Xia, B., Zhang, N., Liu, X. P., Liu, H., Zhang, R. X., Xiao, J. Y., Yang, H., Zhang, Y. Q., et al. (2023) · Cell Metabolism · doi:10.1016/j.cmet.2023.11.003 · Cited by 69
Overview of growth differentiation factor 15 (GDF15) in metabolic diseases
Li, J., Hu, X., Xie, Z., Li, J., Huang, C. L., & Huang, Y. (2024) · Biomedicine & Pharmacotherapy · doi:10.1016/j.biopha.2024.116809 · Cited by 72
The regulation of glucose and lipid homeostasis via PLTP as a mediator of BAT–liver communication
Sponton, C. H., Hosono, T., Taura, J., Jedrychowski, M. P., Yoneshiro, T., Wang, Q., Takahashi, M., Matsui, Y., Ikeda, K., Oguri, Y., et al. (2020) · EMBO Reports · doi:10.15252/embr.201949828 · Cited by 55
Growth differentiation factor 15 as a potential therapeutic for treating obesity
Hale, C., & Véniant, M. M. (2020) · Molecular Metabolism · doi:10.1016/j.molmet.2020.101117 · Cited by 54
L’homme, L., Sermikli, B. P., Haas, J. T., Fleury, S., Quemener, S., Guinot, V., Barreby, E., Esser, N., Caiazzo, R. J., Verkindt, H., et al. (2024) · Nature Communications · doi:10.1038/s41467-024-51078-2 · Cited by 54
Schernthaner-Reiter, M. H., Kasses, D., Tugendsam, C., Riedl, M., Peric, S., Prager, G., Krebs, M., Promintzer‐Schifferl, M., Clodi, M., Luger, A., et al. (2016) · European Journal of Endocrinology · doi:10.1530/eje-16-0550 · Cited by 50
Kusminski, C. M., Ghaben, A. L., Morley, T. S., Samms, R. J., Adams, A. C., An, Y., Johnson, J. A., Joffin, N., Onodera, T., Crewe, C., et al. (2019) · Diabetes · doi:10.2337/db19-0327 · Cited by 50
Regulation of Energy Metabolism by Receptor Tyrosine Kinase Ligands
Zhao, M., Jung, Y., Jiang, Z., & Svensson, K. J. (2020) · Frontiers in Physiology · doi:10.3389/fphys.2020.00354 · Cited by 55
Knocking on GDF15’s door for the treatment of type 2 diabetes mellitus
Aguilar-Recarte, D., Barroso, E., Palomer, X., Wahli, W., & Vázquez‐Carrera, M. (2022) · Trends in Endocrinology and Metabolism · doi:10.1016/j.tem.2022.08.004 · Cited by 51
Jurado-Aguilar, J., Barroso, E., Bernard, M., Zhang, M., Peyman, M., Rada, P., Valverde, Á. M., Wahli, W., Palomer, X., & Vázquez‐Carrera, M. (2024) · Metabolism · doi:10.1016/j.metabol.2023.155772 · Cited by 51
Global gene expression patterns of grass carp following compensatory growth
He, L., Pei, Y., Jiang, Y., Li, Y., Liao, L., Zhu, Z., & Wang, Y. (2015) · BMC Genomics · doi:10.1186/s12864-015-1427-2 · Cited by 49
GDF15 Mediates the Effect of Skeletal Muscle Contraction on Glucose-Stimulated Insulin Secretion
Zhang, H., Mulya, A., Nieuwoudt, S., Vandanmagsar, B., McDowell, R. E., Heintz, E. C., Zunica, E. R. M., Collier, J. J., Bozadjieva-Kramer, N., Seeley, R. J., et al. (2023) · Diabetes · doi:10.2337/db22-0019 · Cited by 47
Circulating Levels of GDF15, MMP7 and miR-200c as a Poor Prognostic Signature in Gastric Cancer
Blanco, M., Tarrío, N., Reboredo, M., Haz‐Conde, M., García, J., Quindós, M., Figueroa, A., Antón-Aparicio, L. M., Calvo, L., & Valladares‐Ayerbes, M. (2014) · Future Oncology · doi:10.2217/fon.13.263 · Cited by 47
GDF-15 in Pulmonary and Critical Care Medicine
Verhamme, F. M., Freeman, C. M., Brusselle, G., Bracke, K. R., & Curtis, J. L. (2019) · American Journal of Respiratory Cell and Molecular Biology · doi:10.1165/rcmb.2018-0379tr · Cited by 47
Effect of bariatric surgery on plasma GDF15 in humans
Kleinert, M., Bojsen-Møller, K. N., Jørgensen, N. B., Svane, M. S., Martinussen, C., Kiens, B., Wojtaszewski, J. F. P., Madsbad, S., Richter, E. A., & Clemmensen, C. (2019) · American Journal of Physiology-Endocrinology and Metabolism · doi:10.1152/ajpendo.00010.2019 · Cited by 48
Growth differentiation factor 15 (GDF-15) in endocrinology
Iglesias, P., Silvestre, R. A., & Díez, J. J. (2023) · Endocrine · doi:10.1007/s12020-023-03377-9 · Cited by 45
GDF15 enhances body weight and adiposity reduction in obese mice by leveraging the leptin pathway
Breit, S. N., Manandhar, R., Zhang, H., Lee-Ng, M., Brown, D. A., & Tsai, V. W.-W. (2023) · Cell Metabolism · doi:10.1016/j.cmet.2023.06.009 · Cited by 46
Growth and differentiation factor-15: A link between inflammaging and cardiovascular disease
Nyárády, B. B., Kiss, L. Z., Bagyura, Z., Merkely, B. P., Dósa, E., Láng, O., Kőhidai, L., & Pállinger, É. (2024) · Biomedicine & Pharmacotherapy · doi:10.1016/j.biopha.2024.116475 · Cited by 44
GDF15 antagonism limits severe heart failure and prevents cardiac cachexia
Takaoka, M., Tadross, J. A., Al-Hadithi, A., Zhao, X., Villena-Gutiérrez, R., Tromp, J., Absar, S., Au, M., Harrison, J., Coll, A. P., et al. (2024) · Cardiovascular Research · doi:10.1093/cvr/cvae214 · Cited by 46
GDF15—From Biomarker to Allostatic Hormone
O’Rahilly, S. (2017) · Cell Metabolism · doi:10.1016/j.cmet.2017.10.017 · Cited by 44
Guillaume, M., Riant, É., Fabre, A., Raymond‐Letron, I., Buscato, M., Davezac, M., Tramunt, B., Montagner, A., Smati, S., Zahreddine, R., et al. (2019) · Hepatology Communications · doi:10.1002/hep4.1363 · Cited by 45
Targeted multiple biomarker approach in predicting cardiovascular events in patients with diabetes
Resl, M., Clodi, M., Vila, G., Luger, A., Neuhold, S., Wurm, R., Adlbrecht, C., Strunk, G., Fritzer-Szekeres, M., Prager, R., et al. (2016) · Heart · doi:10.1136/heartjnl-2015-308949 · Cited by 42
Exercise, obesity and CNS control of metabolic homeostasis: a review
Smith, J. K. (2018) · Frontiers in Physiology · doi:10.3389/fphys.2018.00574 · Cited by 40
GDF15 links adipose tissue lipolysis with anxiety
Townsend, L. K., Wang, D., Knuth, C. M., Fayyazi, R., Mohammad, A., Becker, L. J., Tsakiridis, E. E., Desjardins, E. M., Patel, Z., Valvano, C. M., et al. (2025) · Nature Metabolism · doi:10.1038/s42255-025-01264-3 · Cited by 43
Mitochondrial stress and GDF15 in the pathophysiology of sepsis
Fujita, Y., Ito, M., & Ohsawa, I. (2020) · Archives of Biochemistry and Biophysics · doi:10.1016/j.abb.2020.108668 · Cited by 42
Camptothecin effectively treats obesity in mice through GDF15 induction
Lu, J. F., Zhu, M., Xie, B., Shi, X., Liu, H., Zhang, R. X., Xia, B., & Wu, J. W. (2022) · PLoS Biology · doi:10.1371/journal.pbio.3001517 · Cited by 40
Patel, S., Haider, A., Álvarez-Guaita, A., Bidault, G., Moustafa, J. S. E.-S., Guiu‐Jurado, E., Tadross, J. A., Warner, J., Harrison, J., Virtue, S., et al. (2022) · Molecular Metabolism · doi:10.1016/j.molmet.2022.101589 · Cited by 42
GDF-15 as a Weight Watcher for Diabetic and Non-Diabetic People Treated With Metformin
Ouyang, J., Isnard, S., Lin, J., Fombuena, B., Peng, X., Chen, Y., & Routy, J.-P. (2020) · Frontiers in Endocrinology · doi:10.3389/fendo.2020.581839 · Cited by 39
Artesunate treats obesity in male mice and non-human primates through GDF15/GFRAL signalling axis
Guo, X., Asthana, P., Zhai, L., Cheng, K. W., Gurung, S., Huang, J., Wu, J., Zhang, Y., Mahato, A. K., Saarma, M., et al. (2024) · Nature Communications · doi:10.1038/s41467-024-45452-3 · Cited by 44
GDF15: from biomarker to target in cancer cachexia
Hüllwegen, M., Kleinert, M., von Haehling, S., & Fischer, A. (2025) · Trends in cancer · doi:10.1016/j.trecan.2025.06.007 · Cited by 42
Body weight regulation via MT1-MMP-mediated cleavage of GFRAL
Chow, C. F. W., Guo, X., Asthana, P., Zhang, S., Wong, S. K. K., Fallah, S., Che, S., Gurung, S., Wang, Z., Lee, K. B., et al. (2022) · Nature Metabolism · doi:10.1038/s42255-022-00529-5 · Cited by 37
Metformin and the Liver: Unlocking the Full Therapeutic Potential
Perazza, F., Leoni, L., Colosimo, S., Musio, A., Bocedi, G., D’Avino, M., Agnelli, G., Nicastri, A., Rossetti, C., Sacilotto, F., et al. (2024) · Metabolites · doi:10.3390/metabo14040186 · Cited by 39
L’homme, L., Sermikli, B. P., Staels, B., Piette, J. G., Legrand-Poels, S., & Dombrowicz, D. (2020) · Nutrients · doi:10.3390/nu12123771 · Cited by 37
Karusheva, Y., Ratcliff, M., Mörseburg, A., Barker, P., Melvin, A., Sattar, N. A., Burling, K., Backmark, A., Roth, R. G., Jermutus, L., et al. (2022) · The Journal of Applied Laboratory Medicine · doi:10.1093/jalm/jfac055 · Cited by 37
Yilmaz, H., Çelik, H. T., Gurel, O. M., Bilgiç, M. A., Namuslu, M., Bozkurt, H., Ayyildiz, A., İnan, O., Bavbek, N., & Akçay, A. (2014) · Herz · doi:10.1007/s00059-014-4139-5 · Cited by 36
Jacouton, E., Mach, N., Cadiou, J., Lapaque, N., Clément, K., Doré, J., van Hylckama Vlieg, J. E. T., Smokvina, T., & Blottière, H. M. (2015) · PLOS ONE · doi:10.1371/journal.pone.0138880 · Cited by 32
“The last, known for its role in cellular cycle has been recently involved in T2D [32, 33].”
Telaprevir: Clinical Pharmacokinetics, Pharmacodynamics, and Drug–Drug Interactions
Kiang, T. K. L., Wilby, K. J., & Ensom, M. H. H. (2013) · Clinical Pharmacokinetics · doi:10.1007/s40262-013-0053-x · Cited by 32
Engström, L., Font‐Gironès, F., Zajdel, J., Kern, L., Teixidor-Deulofeu, J., Mannerås-Holm, L., Carreras, A., Becattini, B., Björefeldt, A., Hanse, E., et al. (2024) · Cell Reports · doi:10.1016/j.celrep.2024.113960 · Cited by 35
Overall, K. L., Tiira, K., Broach, D., & Bryant, D. (2014) · Veterinary Clinics of North America Small Animal Practice · doi:10.1016/j.cvsm.2014.01.006 · Cited by 35
Diabetes, GDF-15 and incident heart failure: the atherosclerosis risk in communities study
Echouffo-Tcheugui, J. B., Daya, N. R., Ndumele, C. E., Matsushita, K., Hoogeveen, R. C., Ballantyne, C. M., Coresh, J., Shah, A. M., & Selvin, E. (2022) · Diabetologia · doi:10.1007/s00125-022-05678-6 · Cited by 32
Metadata
- Authors
- Macia, L., Tsai, V. W.-W., Nguyen, A. D., Johnen, H., Kuffner, T., Shi, Y.-C., Lin, S., Herzog, H., Brown, D. A., Breit, S. N., & Sainsbury, A.
- Affiliations
- Garvan Institute of Medical Research (AU)
- UNSW Sydney (AU)
- The University of Sydney (AU)
- Corresponding author
- Sainsbury, Amanda
- ORCID
- Venue
- PLoS ONE
- Publisher
- Public Library of Science (PLoS)
- Published
- 2012-04-13
- Volume
- 7
- Issue
- 4
- Pages
- e34868
- ISSN
- 1932-6203 (ISSN-L)
- PMC
- PMC3325923
- OpenAlex
- W2057219729
- Cited by
- 211
- References
- 26
- Citations by year
- 2026: 10 · 2025: 20 · 2024: 20 · 2023: 21 · 2022: 21 · 2021: 18 · 2020: 32 · 2019: 19 · 2018: 12 · 2017: 11 · 2016: 6 · 2015: 6 · 2014: 8 · 2013: 5 · 2012: 2
- FWCI
- 2.97
- Type
- journal article
- Language
- en
- Open access
- gold
- doi.org
- Locations
- PLoS ONE (publishedVersion, cc-by)
- Europe PMC (PubMed Central) (publishedVersion, cc-by)
- PubMed Central (publishedVersion, cc-by)
- PubMed (publishedVersion)
- Monash University Research Portal (Monash University) (submittedVersion, cc-by)
- UNSWorks (University of New South Wales, Sydney, Australia) (submittedVersion, cc-by-nc-nd)
- UNSWorks (UNSW Sydney) (submittedVersion, cc-by-nc-nd)
- DOAJ (DOAJ: Directory of Open Access Journals) (submittedVersion, cc-by-sa)
- The Sydney eScholarship Repository (The University of Sydney) (submittedVersion)
- Funders
- Medical Research Council
- National Health and Medical Research Council (455291)
- Topics
- Life Sciences › Neuroscience › Endocrine and Autonomic Systems › Regulation of Appetite and Obesity
- Health Sciences › Medicine › Cardiology and Cardiovascular Medicine › GDF15 and Related Biomarkers
- Health Sciences › Medicine › Endocrinology, Diabetes and Metabolism › Adipokines, Inflammation, and Metabolic Diseases
- Keywords
- MIC-1, GDF15, obesity, dietary intake, body weight, glucose tolerance, glucose homeostasis, high-fat diet, fat mass, energy expenditure, transgenic overexpression, anorectic effect
- MeSH terms
- Animals, Body Weight, Eating, Female, Glucose, Mice, Transgenic, Obesity, Mice, Growth Differentiation Factor 15
About these checks
Registry, retraction, Cites and statistics results are computed, not judged, with one exception: a printed reference that no index lists is read once by a model before it counts as a citation error. Claims are extracted by a model and kept only when their quote appears verbatim in the text; each cited source is then checked, with a model’s help, for whether it says what the claim relies on. Those verdicts can be wrong — read the claim’s quote and the cited source before relying on one.
Statistics and arithmetic are recomputed, not judged.
Confidence bands are shown only for fields calibrated on our annotated test set. None is calibrated yet, so no band is shown.
What counts as a claim ›How we measure confidence ›How we check this ›
Are you an author, or do you see a problem with this page? Request a review
