

The DOI matches its Crossref record; 37 of the 38 references it cites were found in a registry or an index.
Regression of Atherosclerosis Is Characterized by Broad Changes in the Plaque Macrophage Transcriptome
Open accessAbstract
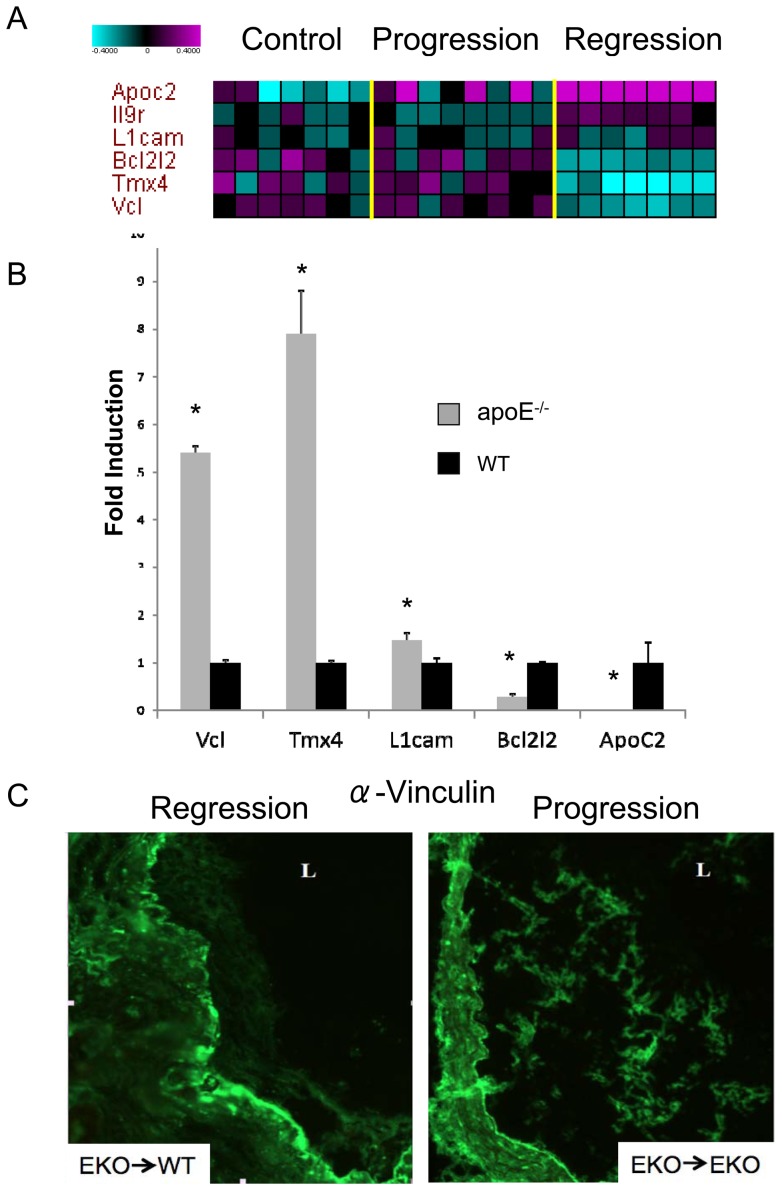
We have developed a mouse model of atherosclerotic plaque regression in which an atherosclerotic aortic arch from a hyperlipidemic donor is transplanted into a normolipidemic recipient, resulting in rapid elimination of cholesterol and monocyte-derived macrophage cells (CD68+) from transplanted vessel walls. To gain a comprehensive view of the differences in gene expression patterns in macrophages associated with regressing compared with progressing atherosclerotic plaque, we compared mRNA expression patterns in CD68+ macrophages extracted from plaque in aortic aches transplanted into normolipidemic or into hyperlipidemic recipients. In CD68+ cells from regressing plaque we observed that genes associated with the contractile apparatus responsible for cellular movement (e.g. actin and myosin) were up-regulated whereas genes related to cell adhesion (e.g. cadherins, vinculin) were down-regulated. In addition, CD68+ cells from regressing plaque were characterized by enhanced expression of genes associated with an anti-inflammatory M2 macrophage phenotype, including arginase I, CD163 and the C-lectin receptor. Our analysis suggests that in regressing plaque CD68+ cells preferentially express genes that reduce cellular adhesion, enhance cellular motility, and overall act to suppress inflammation.
Overview
The claims and statistics of this paper haven’t been checked yet.
Run the check — free, no account needed. It reads the open-access text and checks the sources it cites.
Integrity signals
Registry
Cites
Statistics
Figures
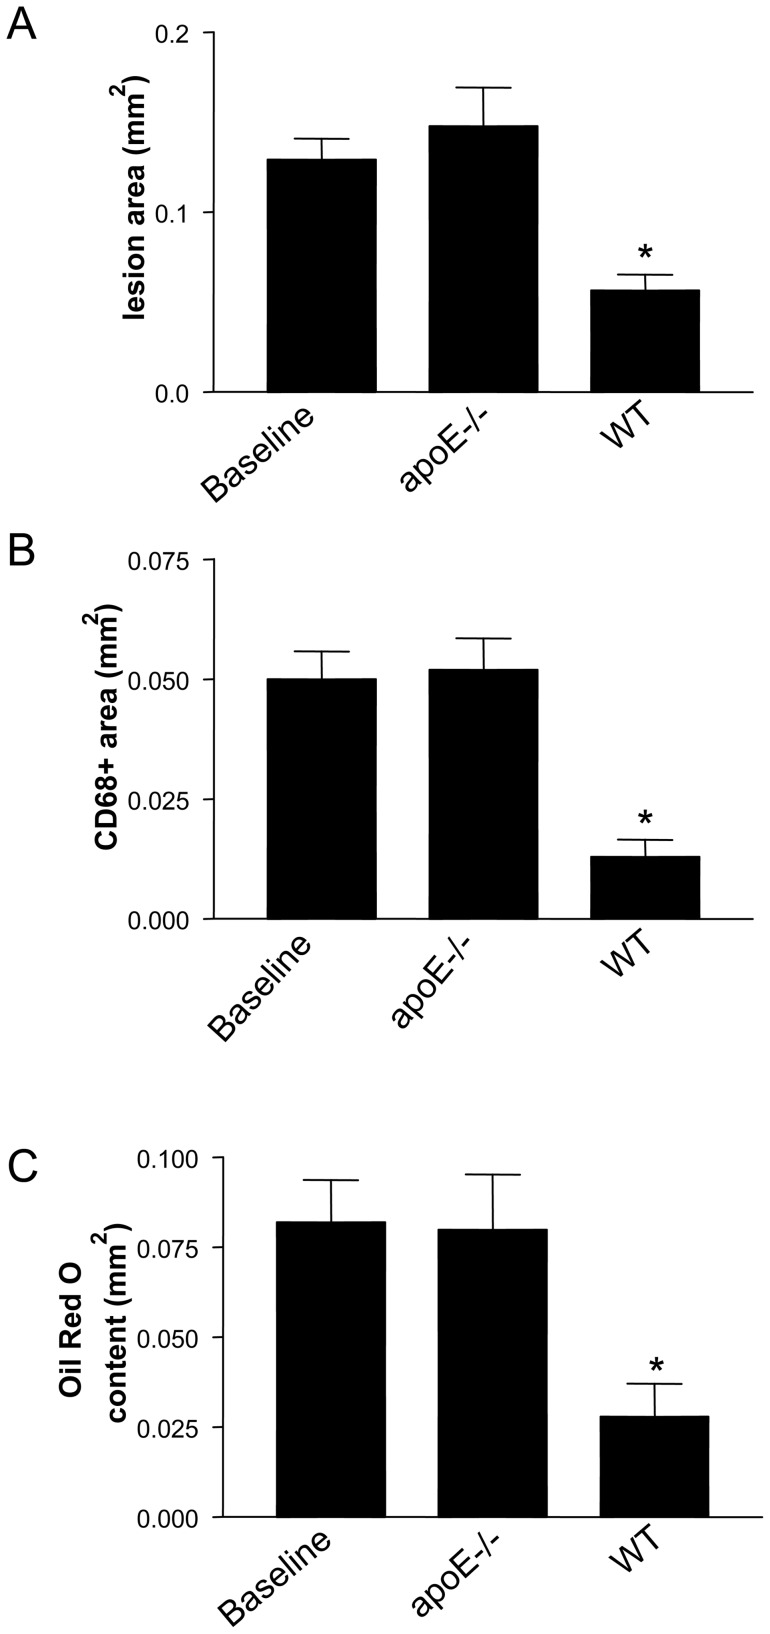
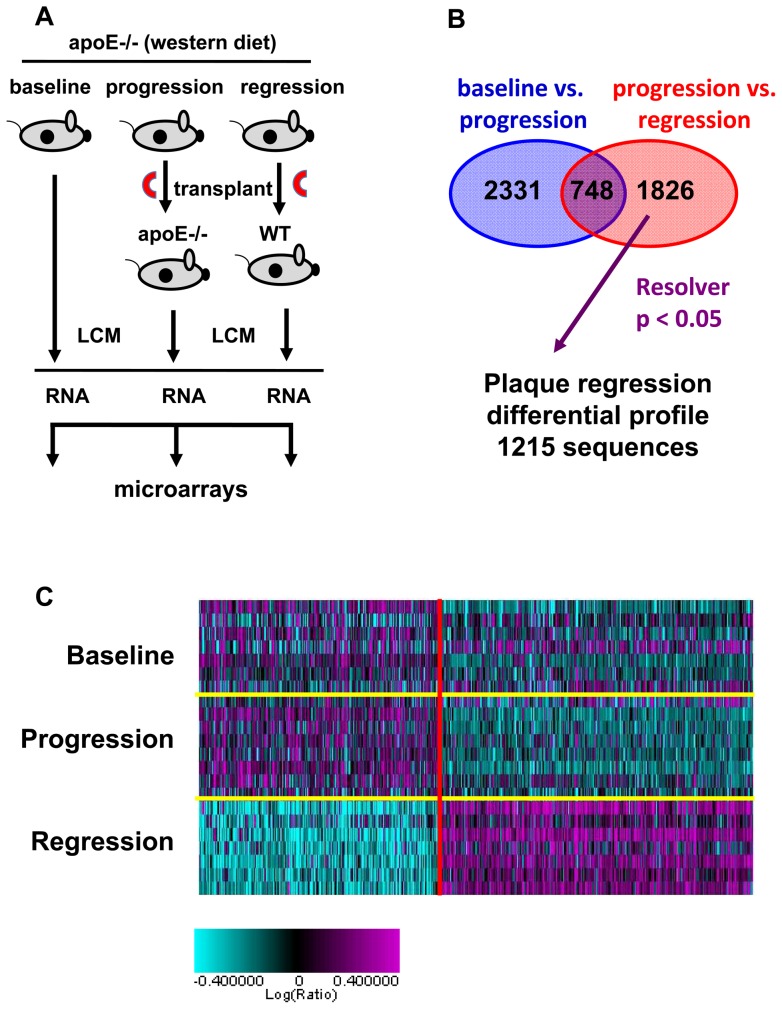
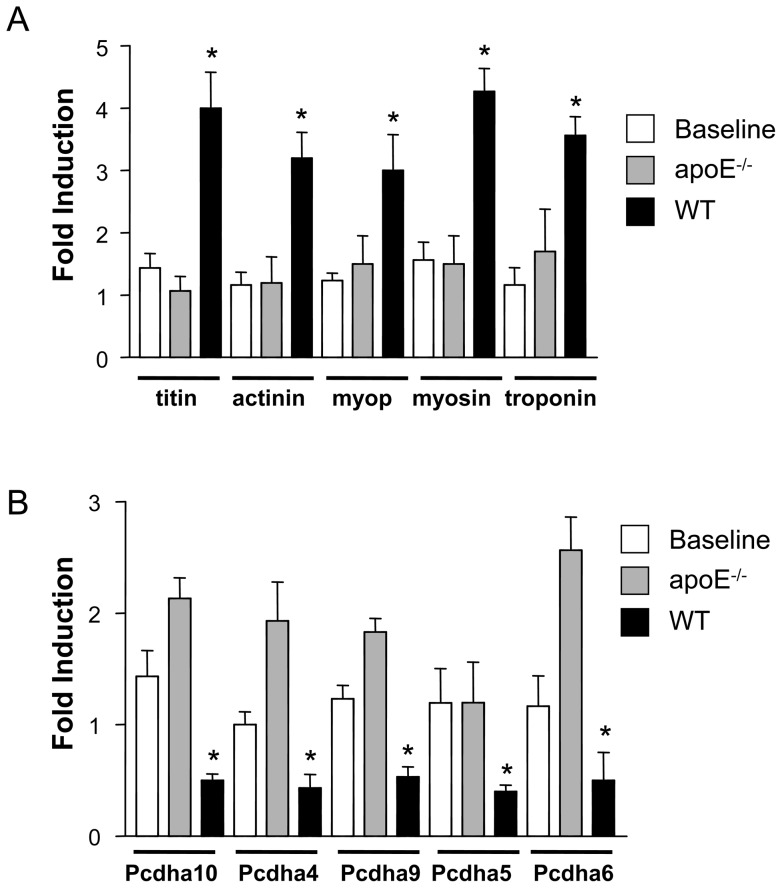
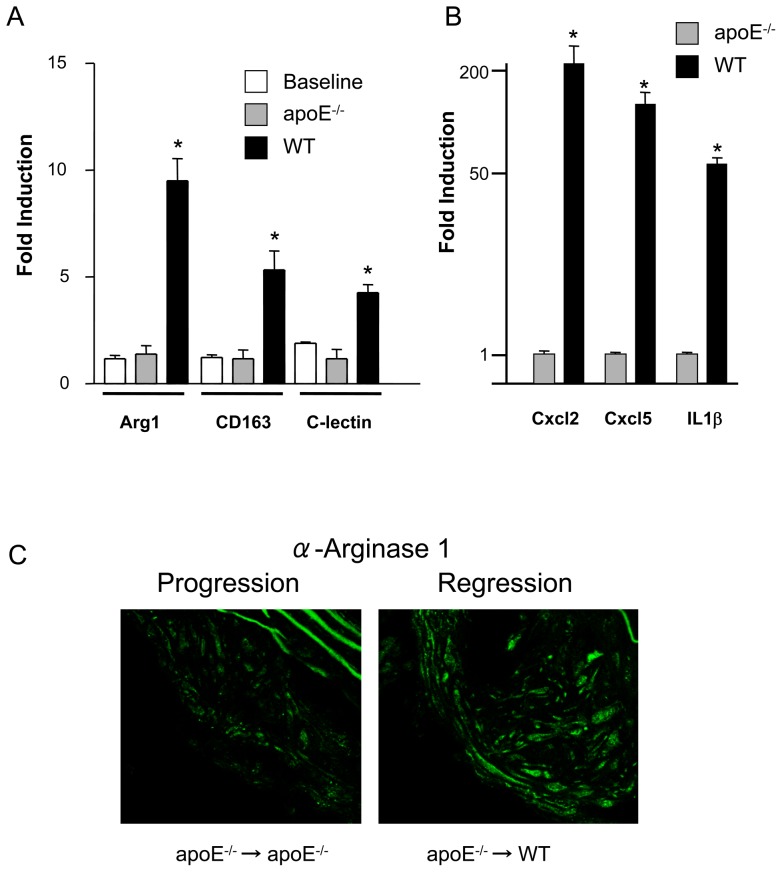
Verification
Claims the paper makes
The claims and statistics of this paper haven’t been checked yet.
Run the check — free, no account needed. It reads the open-access text and checks the sources it cites.
Claims other papers make about this one
Each is checked against this paper’s own text: does it say what the citing paper says it does?
The source backs part of the claim, not all of it — or backs it for a different population, condition or comparison.
In the citing paper
“Indeed, lipid-lowering interventions in atherosclerotic mice seem both to attenuate lipoprotein modification in the arterial wall and to promote a pro-resolving phenotype in lesional macrophages, all of which precede plaque regression209.”
From Inflammation and its resolution in atherosclerosis: mediators and therapeutic opportunities (2019) · cites this paper as [209]
Experimental — accuracy not yet measured
Self-check
Percentages, sums and reported differences re-computed from the paper’s own numbers.
The self-check needs the paper’s full text.
Citations
Cites
Exploring the full spectrum of macrophage activation
Mosser, D. M., & Edwards, J. P. (2008) · Nature Reviews Immunology · doi:10.1038/nri2448 · Cited by 9,144
Grundy, S. M., Cleeman, J. I., Merz, C. N. B., Brewer, H. B., Clark, L. T., Hunninghake, D. B., Pasternak, R. C., Smith, S. C., & Stone, N. J. (2004) · Circulation · doi:10.1161/01.cir.0000133317.49796.0e · Cited by 6,902
Spontaneous Hypercholesterolemia and Arterial Lesions in Mice Lacking Apolipoprotein E
Zhang, S. H., Reddick, R. L., Piedrahita, J. A., & Maeda, N. (1992) · Science · doi:10.1126/science.1411543 · Cited by 2,237
Nathan, C., & Ding, A. (2010) · Cell · doi:10.1016/j.cell.2010.02.029 · Cited by 2,183
ApoE-deficient mice develop lesions of all phases of atherosclerosis throughout the arterial tree.
Nakashima, Y., Plump, A. S., Raines, E. W., Breslow, J. L., & Ross, R. (1994) · Arteriosclerosis and Thrombosis: A Journal of Vascular Biology · doi:10.1161/01.atv.14.1.133 · Cited by 1,693
Grundy, S. M., Cleeman, J. I., Bairey Merz, C. N., Brewer, H. B., Clark, L. T., Hunninghake, D. B., Pasternak, R. C., Smith, S. C., & Stone, N. J. (2004) · Journal of the American College of Cardiology · doi:10.1016/j.jacc.2004.07.001 · Cited by 1,550
Ishibashi, S., Brown, M. S., Goldstein, J. L., Gerard, R. D., Hammer, R. E., & Herz, J. (1993) · Journal of Clinical Investigation · doi:10.1172/jci116663 · Cited by 1,354
Bouhlel, M. A., Derudas, B., Rigamonti, E., Dièvart, R., Brozek, J., Haulon, S., Zawadzki, C., Jude, B., Torpier, G., Marx, N., et al. (2007) · Cell Metabolism · doi:10.1016/j.cmet.2007.06.010 · Cited by 1,325
A specific apoprotein activator for lipoprotein lipase
LaRosa, J. C., Levy, R. I., Herbert, P. N., Lux, S. E., & Fredrickson, D. S. (1970) · Biochemical and Biophysical Research Communications · doi:10.1016/0006-291x(70)90468-7 · Cited by 668
Llodrá, J., Angeli, V., Liu, J. J., Trogan, E., Fisher, E. A. A., & Randolph, G. J. (2004) · Proceedings of the National Academy of Sciences · doi:10.1073/pnas.0403259101 · Cited by 520
Self-citation
Cited by
Sorted by citations
The M1 and M2 paradigm of macrophage activation: Time for reassessment
Martinez, F. O., & Gordon, S. (2014) · F1000Prime Reports · doi:10.12703/p6-13 · Cited by 4,689
Macrophages in atherosclerosis: a dynamic balance
Moore, K. J., Sheedy, F. J., & Fisher, E. A. (2013) · Nature reviews. Immunology · doi:10.1038/nri3520 · Cited by 2,559
Self-citationInflammation and its resolution in atherosclerosis: mediators and therapeutic opportunities
Bäck, M., Yurdagul, A., Tabas, I., Öörni, K., & Kovanen, P. T. (2019) · Nature Reviews Cardiology · doi:10.1038/s41569-019-0169-2 · Cited by 1,341
Macrophage subsets in atherosclerosis
Chinetti, G., Colin, S., & Staels, B. (2014) · Nature Reviews Cardiology · doi:10.1038/nrcardio.2014.173 · Cited by 669
Macrophages in Atherosclerosis Regression
Barrett, T. J. (2019) · Arteriosclerosis Thrombosis and Vascular Biology · doi:10.1161/atvbaha.119.312802 · Cited by 656
Yurdagul, A., Subramanian, M., Wang, X., Crown, S. B., Ilkayeva, O. R., Darville, L., Kolluru, G. K., Rymond, C. C., Gerlach, B. D., Zheng, Z., et al. (2020) · Cell Metabolism · doi:10.1016/j.cmet.2020.01.001 · Cited by 525
Inflammation and its Resolution as Determinants of Acute Coronary Syndromes
Libby, P., Tabas, I. A., Fredman, G., & Fisher, E. A. A. (2014) · Circulation Research · doi:10.1161/circresaha.114.302699 · Cited by 531
Self-citationSmooth muscle cell fate and plasticity in atherosclerosis
Allahverdian, S., Chaâbane, C., Boukais, K., Francis, G. A., & Bochaton‐Piallat, M. (2018) · Cardiovascular Research · doi:10.1093/cvr/cvy022 · Cited by 513
Metabolism of tissue macrophages in homeostasis and pathology
Wculek, S. K., Dunphy, G., Heras-Murillo, I., Mastrangelo, A., & Sancho, D. (2022) · Cellular & Molecular Immunology · doi:10.1038/s41423-021-00791-9 · Cited by 501
Arginase: A Multifaceted Enzyme Important in Health and Disease
Caldwell, R. W., Rodriguez, P. C., Toque, H. A., Narayanan, S. P., & Caldwell, R. B. (2018) · Physiological Reviews · doi:10.1152/physrev.00037.2016 · Cited by 495
Macrophages and lipid metabolism
Remmerie, A., & Scott, C. L. (2018) · Cellular Immunology · doi:10.1016/j.cellimm.2018.01.020 · Cited by 451
Atherosclerotic Plaque Healing
Vergallo, R., & Crea, F. (2020) · New England Journal of Medicine · doi:10.1056/nejmra2000317 · Cited by 392
Macrophages in cardiovascular diseases: molecular mechanisms and therapeutic targets
Chen, R., Zhang, H., Tang, B., Luo, Y., Yang, Y., Zhong, X., Chen, S., Xu, X., Huang, S., & Liu, C. (2024) · Signal Transduction and Targeted Therapy · doi:10.1038/s41392-024-01840-1 · Cited by 418
Vengrenyuk, Y., Nishi, H., Long, X., Ouimet, M., Savji, N., Martinez, F. O., Cassella, C. P., Moore, K. J., Ramsey, S. A., Miano, J. M., et al. (2015) · Arteriosclerosis, Thrombosis, and Vascular Biology · doi:10.1161/atvbaha.114.304029 · Cited by 358
Self-citationEdgar, L., Akbar, N., Braithwaite, A. T., Krausgruber, T., Gallart-Ayala, H., Bailey, J., Corbin, A., Khoyratty, T. E., Chai, J. T., Alkhalil, M., et al. (2021) · Circulation · doi:10.1161/circulationaha.120.046464 · Cited by 352
Rahman, K., Vengrenyuk, Y., Ramsey, S. A., Rotllán, N., Girgis, N. M., Liu, J. J., Gusarova, V., Gromada, J., Weinstock, A., Moore, K. J., et al. (2017) · Journal of Clinical Investigation · doi:10.1172/jci75005 · Cited by 348
Self-citationArginase: an old enzyme with new tricks
Caldwell, R. B., Toque, H. A., Narayanan, S. P., & Caldwell, R. W. (2015) · Trends in Pharmacological Sciences · doi:10.1016/j.tips.2015.03.006 · Cited by 358
Mapping macrophage polarization over the myocardial infarction time continuum
Mouton, A. J., DeLeon‐Pennell, K. Y., Gonzalez, O. J. R., Flynn, E. R., Freeman, T. C., Saucerman, J. J., Garrett, M. R., Ma, Y., Harmancey, R., & Lindsey, M. L. (2018) · Basic Research in Cardiology · doi:10.1007/s00395-018-0686-x · Cited by 317
Lin, J.-D., Nishi, H., Poles, J., Niu, X., McCauley, C., Rahman, K., Brown, E. J., Yeung, S. T., Vozhilla, N., Weinstock, A., et al. (2019) · JCI Insight · doi:10.1172/jci.insight.124574 · Cited by 306
Self-citationCardilo‐Reis, L., Gruber, S., Schreier, S. M., Drechsler, M., Papac‐Milicevic, N., Weber, C., Wagner, O., Stangl, H., Soehnlein, O., & Binder, C. J. (2012) · EMBO Molecular Medicine · doi:10.1002/emmm.201201374 · Cited by 292
Regulatory T Cells License Macrophage Pro-Resolving Functions During Atherosclerosis Regression
Sharma, M., Schlegel, M., Afonso, M. S., Brown, E. J., Rahman, K., Weinstock, A., Sansbury, B. E., Corr, E. M., Solingen, C. V., Koelwyn, G. J., et al. (2020) · Circulation Research · doi:10.1161/circresaha.119.316461 · Cited by 263
Self-citationMonocyte and macrophage immunometabolism in atherosclerosis
Groh, L. A., Keating, S. T., Joosten, L. A. B., Netea, M. G., & Riksen, N. P. (2017) · Seminars in Immunopathology · doi:10.1007/s00281-017-0656-7 · Cited by 258
Atherosclerosis – A matter of unresolved inflammation
Viola, J. R., & Soehnlein, O. (2015) · Seminars in Immunology · doi:10.1016/j.smim.2015.03.013 · Cited by 229
Macrophage Trafficking, Inflammatory Resolution, and Genomics in Atherosclerosis
Moore, K. J., Koplev, S., Fisher, E. A. A., Tabas, I. A., Björkegren, J., Doran, A. C., & Kovacic, J. C. (2018) · Journal of the American College of Cardiology · doi:10.1016/j.jacc.2018.08.2147 · Cited by 229
Self-citationDiversity of macrophage phenotypes and responses in atherosclerosis
Jinnouchi, H., Guo, L., Sakamoto, A., Torii, S., Sato, Y., Cornelissen, A., Kuntz, S. H., Paek, K. H., Fernandez, R., Fuller, D. T., et al. (2019) · Cellular and Molecular Life Sciences · doi:10.1007/s00018-019-03371-3 · Cited by 226
Fukui, S., Iwamoto, N., Takatani, A., Igawa, T., Shimizu, T., Umeda, M., Nishino, A., Horai, Y., Hirai, Y., Koga, T., et al. (2018) · Frontiers in Immunology · doi:10.3389/fimmu.2017.01958 · Cited by 216
Inflammation Resolution: Implications for Atherosclerosis
Doran, A. C. (2022) · Circulation Research · doi:10.1161/circresaha.121.319822 · Cited by 181
Wanschel, A., Seibert, T., Hewing, B., Ramkhelawon, B., Ray, T. D., van Gils, J. V., Rayner, K. J., Feig, J. E., O'Brien, E., Fisher, E., et al. (2013) · Arteriosclerosis, Thrombosis and Vascular Biology · doi:10.1161/atvbaha.112.300941 · Cited by 139
Self-citationMacrophage activation in human diseases
Schultze, J. L., Schmieder, A., & Goerdt, S. (2015) · Seminars in Immunology · doi:10.1016/j.smim.2015.07.003 · Cited by 134
Regulatory T cells in atherosclerosis: critical immune regulatory function and therapeutic potential
Spitz, C., Winkels, H., Bürger, C., Weber, C., Lutgens, E., Hansson, G. K., & Gerdes, N. (2015) · Cellular and Molecular Life Sciences · doi:10.1007/s00018-015-2080-2 · Cited by 134
Edgar, L., Akbar, N., Braithwaite, A. T., Krausgruber, T., Gallart‐Ayala, H., Bailey, J. D., Corbin, A., Khoyratty, T. E., Chai, J. T., Alkhalil, M., et al. (2021) · Informationszentrum Lebenswissenschaften (ZB MED) · doi:10.1161/circulationaha.120.04646 · Cited by 113
Sanson, M., Distel, E., & Fisher, E. A. A. (2013) · PLoS ONE · doi:10.1371/journal.pone.0074676 · Cited by 116
Self-citationArginase: shedding light on the mechanisms and opportunities in cardiovascular diseases
Li, Z., Wang, L., Ren, Y., Huang, Y., Liu, W., Lv, Z., Lü, Q., Yu, Y., & Xiong, Y. (2022) · Cell Death Discovery · doi:10.1038/s41420-022-01200-4 · Cited by 118
Mueller, P. A., Zhu, L., Tavori, H., Huynh, K. T., Giunzioni, I., Stafford, J. M., Linton, M. F., & Fazio, S. (2018) · Circulation · doi:10.1161/circulationaha.117.031702 · Cited by 103
Specialized pro-resolving mediators in cardiovascular diseases
Fredman, G., & Spite, M. R. (2017) · Molecular Aspects of Medicine · doi:10.1016/j.mam.2017.02.003 · Cited by 103
Role of Arginase in Vessel Wall Remodeling
Durante, W. (2013) · Frontiers in Immunology · doi:10.3389/fimmu.2013.00111 · Cited by 94
Zhang, M., He, J., Jiang, C., Zhang, W., Yang, Y., Wang, Z., & Liu, J. (2017) · International Journal of Nanomedicine · doi:10.2147/ijn.s124252 · Cited by 85
Migratory and Dancing Macrophage Subsets in Atherosclerotic Lesions
McArdle, S., Buscher, K., Ghosheh, Y., Pramod, A. B., Miller, J. F., Winkels, H., Wolf, D., & Ley, K. F. (2019) · Circulation Research · doi:10.1161/circresaha.119.315175 · Cited by 78
Immunometabolism orchestrates training of innate immunity in atherosclerosis
van Tuijl, J., Joosten, L. A. B., Netea, M. G., Bekkering, S., & Riksen, N. P. (2019) · Cardiovascular Research · doi:10.1093/cvr/cvz107 · Cited by 77
Miller, A. P., Coronel, J., & Amengual, J. (2020) · Biochimica et Biophysica Acta (BBA) - Molecular and Cell Biology of Lipids · doi:10.1016/j.bbalip.2020.158635 · Cited by 72
Regression of Atherosclerosis: Insights from Animal and Clinical Studies
Feig, J. E. (2014) · Annals of Global Health · doi:10.1016/j.aogh.2013.12.001 · Cited by 71
Self-citationMyeloid cells in atherosclerosis
Koltsova, E. K., Hedrick, C. C., & Ley, K. F. (2013) · Current Opinion in Lipidology · doi:10.1097/mol.0b013e328363d298 · Cited by 69
Senatus, L. M., López‐Díez, R., Egaña-Gorroño, L., Liu, J., Hu, J., Daffu, G. K., Li, Q., Rahman, K., Vengrenyuk, Y., Barrett, T. J., et al. (2020) · JCI Insight · doi:10.1172/jci.insight.137289 · Cited by 70
Self-citationBjörkegren, J., Hägg, S., Talukdar, H. A., Asl, H. F., Jain, R. K., Cedergren, C., Shang, M.-M., Rossignoli, A., TAKOLANDER, R., Melander, O., et al. (2014) · PLoS Genetics · doi:10.1371/journal.pgen.1004201 · Cited by 66
Altered Metabolism of LDL in the Arterial Wall Precedes Atherosclerosis Regression
Bartels, E. D., Christoffersen, C., Lindholm, M., & Nielsen, L. B. (2015) · Circulation Research · doi:10.1161/circresaha.115.307182 · Cited by 66
Macrophage deficiency of Akt2 reduces atherosclerosis in Ldlr null mice
Babaev, V. R., Hebron, K. E., Wiese, C. B., Toth, C. L., Ding, L., Zhang, Y., May, J. M., Fazio, S., Vickers, K. C., & Linton, M. F. (2014) · Journal of Lipid Research · doi:10.1194/jlr.m050633 · Cited by 63
Immunotherapy for stone disease
Dominguez‐Gutierrez, P. R., Kwenda, E. P., Khan, S. R., & Canales, B. K. (2020) · Current Opinion in Urology · doi:10.1097/mou.0000000000000729 · Cited by 60
Wnt signaling enhances macrophage responses to IL-4 and promotes resolution of atherosclerosis
Weinstock, A., Rahman, K., Yaacov, O., Nishi, H., Menon, P., Nikain, C. A., Garabedian, M. L., Pena, S., Akbar, N., Sansbury, B. E., et al. (2021) · eLife · doi:10.7554/elife.67932 · Cited by 57
Self-citationFisher, E. A. A. (2015) · Arteriosclerosis Thrombosis and Vascular Biology · doi:10.1161/atvbaha.115.301926 · Cited by 59
Self-citationmiR-33 Silencing Reprograms the Immune Cell Landscape in Atherosclerotic Plaques
Afonso, M. S., Sharma, M., Schlegel, M., van Solingen, C., Koelwyn, G. J., Shanley, L. C., Beckett, L., Peled, D., Rahman, K., Giannarelli, C., et al. (2021) · Circulation Research · doi:10.1161/circresaha.120.317914 · Cited by 53
Self-citationBruen, R., Curley, S., Kajani, S., Lynch, G. M., O'Reilly, M. E., Dillon, E., Brennan, E. P., Barry, M. C., Sheehan, S. J., McGillicuddy, F. C., et al. (2019) · Journal of Pharmacology and Experimental Therapeutics · doi:10.1124/jpet.119.258343 · Cited by 55
Monocytes and macrophages in atherogenesis
Amengual, J., & Barrett, T. J. (2019) · Current Opinion in Lipidology · doi:10.1097/mol.0000000000000634 · Cited by 53
The Entry and Egress of Monocytes in Atherosclerosis: A Biochemical and Biomechanical Driven Process
Kang, H., Li, X., Xiong, K., Song, Z., Tian, J., Wen, Y., Sun, A., & Deng, X. (2021) · Cardiovascular Therapeutics · doi:10.1155/2021/6642927 · Cited by 57
Kristensen, L. P., Larsen, M. R., Mickley, H., Saaby, L., Diederichsen, A. C. P., Lambrechtsen, J., Rasmussen, L. M., & Overgaard, M. (2013) · Journal of Proteomics · doi:10.1016/j.jprot.2013.12.011 · Cited by 45
Rahman, K., & Fisher, E. A. A. (2018) · Frontiers in Cardiovascular Medicine · doi:10.3389/fcvm.2018.00032 · Cited by 48
Self-citationRole of AGEs in the progression and regression of atherosclerotic plaques
Wang, Z., Jing, L., Yan, J., Sun, Z., Bao, Z., Shao, C., Pang, Q., Geng, Y., Zhang, L., & Li, L. (2018) · Glycoconjugate Journal · doi:10.1007/s10719-018-9831-x · Cited by 43
Ramsey, S. A., Vengrenyuk, Y., Menon, P., Podolsky, I., Feig, J. E., Aderem, A. A., Fisher, E. A. A., & Gold, E. S. (2014) · PLoS Genetics · doi:10.1371/journal.pgen.1004828 · Cited by 40
Self-citationThe phenomenon of atherosclerosis reversal and regression: Lessons from animal models
Chistiakov, D. A., Myasoedova, V. A., Ревин, В. В., Orekhov, A. N., & Bobryshev, Y. V. (2017) · Experimental and Molecular Pathology · doi:10.1016/j.yexmp.2017.01.013 · Cited by 40
Clinical significance of macrophage phenotypes in cardiovascular disease
Medbury, H. J., Williams, H., & Fletcher, J. (2014) · Clinical and Translational Medicine · doi:10.1186/s40169-014-0042-1 · Cited by 39
Use of Mouse Models in Atherosclerosis Research
Getz, G. S., & Reardon, C. A. (2015) · Methods in molecular biology · doi:10.1007/978-1-4939-2929-0_1 · Cited by 38
Swart, M., & Troeberg, L. (2018) · Journal of Histochemistry & Cytochemistry · doi:10.1369/0022155418798770 · Cited by 37
Deletion of Myeloid GSK3α Attenuates Atherosclerosis and Promotes an M2 Macrophage Phenotype
McAlpine, C. S., Huang, A., Emdin, A. L., Banko, N. S., Beriault, D. R., Shi, Y., & Werstuck, G. H. (2015) · Arteriosclerosis Thrombosis and Vascular Biology · doi:10.1161/atvbaha.115.305438 · Cited by 32
Carramolino, L., Albarrán-Juárez, J., Markov, A., Hernández‐SanMiguel, E., Sharysh, D., Cumbicus, V., Morales‐Cano, D., Labrador-Cantarero, V., Møller, P. L., Nogales, P., et al. (2024) · Nature Cardiovascular Research · doi:10.1038/s44161-023-00412-w · Cited by 29
Chai, J. T., Ruparelia, N., Goel, A., Kyriakou, T., Biasiolli, L., Edgar, L., Handa, A. I., Farrall, M., Watkins, H. C., & Choudhury, R. P. (2018) · Arteriosclerosis Thrombosis and Vascular Biology · doi:10.1161/atvbaha.118.311209 · Cited by 31
Deciphering Macrophage Phenotypes upon Lipid Uptake and Atherosclerosis
Lee, J., & Choi, J. (2020) · Immune Network · doi:10.4110/in.2020.20.e22 · Cited by 30
Remote sensing tree classification with a multilayer perceptron
Sumsion, G. R., Bradshaw, M. S., Hill, K., Pinto, L., & Piccolo, S. (2019) · PeerJ · doi:10.7717/peerj.6101 · Cited by 28
Kanter, J. E., Goodspeed, L., Wang, S., Kramer, F., Wietecha, T., Kjerulf, D. G., Subramanian, S., O’Brien, K. D., & den Hartigh, L. J. (2018) · Nutrients · doi:10.3390/nu10101416 · Cited by 27
Modulation of Macrophage Gene Expression via Liver X Receptor α Serine 198 Phosphorylation
Wu, C., Hussein, M. A., Shrestha, E., Leone, S., Aiyegbo, M. S., Lambert, W. M., Pourcet, B., Cardozo, T. J., Gustafson, J.-A., Fisher, E. A. A., et al. (2015) · Molecular and Cellular Biology · doi:10.1128/mcb.00985-14 · Cited by 26
Self-citationKlančič, T., Woodward, L., Hofmann, S. M., & Fisher, E. A. A. (2016) · Molecular Metabolism · doi:10.1016/j.molmet.2016.03.001 · Cited by 29
Self-citationLuo, L., Liang, H., & Liu, L. (2021) · Pharmaceutical Biology · doi:10.1080/13880209.2021.2010775 · Cited by 25
Meerarani, P., Krishnan, P., Purushothaman, K., Baber, U., Tarricone, A. N., Pérez, J. S., Wiley, J. M., Kini, A. S., Sharma, S. K., Fuster, V., et al. (2012) · Arteriosclerosis Thrombosis and Vascular Biology · doi:10.1161/atvbaha.112.252122 · Cited by 23
The role of HDL in plaque stabilization and regression
Feig, J. E., Feig, J. L., & Dangas, G. (2016) · Coronary Artery Disease · doi:10.1097/mca.0000000000000408 · Cited by 25
Self-citationGarshick, M. S., Nikain, C. A., Tawil, M., Pena, S., Barrett, T. J., Wu, B. G., Gao, Z., Blaser, M. J., & Fisher, E. A. A. (2021) · Scientific Reports · doi:10.1038/s41598-021-88479-y · Cited by 22
Self-citationRead, N., & Wilson, H. M. (2024) · International Journal of Molecular Sciences · doi:10.3390/ijms25137207 · Cited by 22
Moving from lipids to leukocytes: inflammation and immune cells in atherosclerosis
Annink, M. E., Kraaijenhof, J. M., Stroes, E. S. G., & Kroon, J. (2024) · Frontiers in Cell and Developmental Biology · doi:10.3389/fcell.2024.1446758 · Cited by 22
The Semaphorin 3E/PlexinD1 Axis Regulates Macrophage Inflammation in Obesity
Schmidt, A. M., & Moore, K. J. (2013) · Cell Metabolism · doi:10.1016/j.cmet.2013.09.011 · Cited by 21
Regression of atherosclerosis: lessons learned from genetically modified mouse models
Burke, A. C., & Huff, M. W. (2018) · Current Opinion in Lipidology · doi:10.1097/mol.0000000000000493 · Cited by 21
Parry, R., Majeed, K., Pixley, F. J., Hillis, G. S., Francis, R. J., & Schultz, C. J. (2022) · European Heart Journal - Cardiovascular Imaging · doi:10.1093/ehjci/jeac167 · Cited by 19
Statins, atherosclerosis regression and HDL: Insights from within the plaque
Feig, J. E., Feig, J. L., & Kini, A. S. (2015) · International Journal of Cardiology · doi:10.1016/j.ijcard.2015.04.036 · Cited by 19
Self-citationCalcification and Inflammation in Atherosclerosis
Nakahara, T., Narula, J., & Strausś, H. W. (2016) · Journal of the American College of Cardiology · doi:10.1016/j.jacc.2015.11.014 · Cited by 19
Vurusaner, B., Thevkar-Nages, P., Kaur, R., Giannarelli, C., Garabedian, M. J., & Fisher, E. A. A. (2022) · Scientific Reports · doi:10.1038/s41598-022-15349-6 · Cited by 18
Self-citationPinos, I., Yu, J., Pilli, N. R., Kane, M. A., & Amengual, J. (2023) · Biochimica et Biophysica Acta (BBA) - Molecular and Cell Biology of Lipids · doi:10.1016/j.bbalip.2023.159291 · Cited by 13
Dissecting the mechanism of carotid atherosclerosis from the perspective of regulation
Lin, M., Zhao, L. B., Zhao, W., & WENG, J. (2014) · International Journal of Molecular Medicine · doi:10.3892/ijmm.2014.1960 · Cited by 14
Mental health progress requires causal diagnostic nosology and scalable causal discovery
Saxe, G., Bickman, L., Ma, S., & Aliferis, C. (2022) · Frontiers in Psychiatry · doi:10.3389/fpsyt.2022.898789 · Cited by 13
Self-citationFrom metabolic to epigenetic: Insight into trained macrophages in atherosclerosis (Review)
Li, T., Feng, W., Yan, W., & Wang, T. (2024) · Molecular Medicine Reports · doi:10.3892/mmr.2024.13269 · Cited by 13
Spite, M. R., & Fredman, G. (2023) · Advances in pharmacology · doi:10.1016/bs.apha.2022.12.005 · Cited by 13
Inflammation reprogramming and immunomodulation: Next-generation treatments for atherosclerosis
Choudhury, R. P., Hargreaves, R., Chai, J., & Fisher, E. A. A. (2025) · Cell Reports Medicine · doi:10.1016/j.xcrm.2025.102288 · Cited by 12
Self-citationThe impact of the PCSK-9/VLDL-Receptor axis on inflammatory cell polarization
Barcena, M. L., Estepa, M., Marx, L., Breiter, A., Haritonow, N., & Stawowy, P. (2022) · Cytokine · doi:10.1016/j.cyto.2022.156077 · Cited by 12
Thota, L. N., Ponnusamy, T., Philip, S., Lu, X., & Mundkur, L. (2017) · Scientific Reports · doi:10.1038/s41598-017-04183-w · Cited by 12
Zhong, Z., Li, B., Li, C. R., Zhang, Q., Liu, Z. D., Zhang, P. F., Gu, X., Luo, H., Li, M., Luo, H. S., et al. (2014) · Brazilian Journal of Medical and Biological Research · doi:10.1590/1414-431x20144195 · Cited by 11
Helk, O., Dekeryte, R., Thompson, D., Kamli-Salino, S., Philip, S., Wilson, H. M., Mody, N., & Delibegović, M. (2023) · Journal of Translational Medicine · doi:10.1186/s12967-023-04598-2 · Cited by 9
Mechanisms and consequences of myeloid adhesome dysfunction in atherogenesis
Zhevlakova, I., Liu, H., Dudiki, T., Gao, D., Yakubenko, V. P., Tkachenko, S., Cherepanova, O. A., Podrez, E. A., & Byzova, T. V. (2024) · Cardiovascular Research · doi:10.1093/cvr/cvae223 · Cited by 7
Borowczyk, C., Laroche‐Traineau, J., Brévier, J., Jacobin‐Valat, M., Marais, S., Gerbaud, É., Clofent‐Sanchez, G., & Ottonès, F. (2020) · Atherosclerosis · doi:10.1016/j.atherosclerosis.2020.07.017 · Cited by 7
Understanding the role of alternative macrophage phenotypes in human atherosclerosis
Kawai, K., Vozenilek, A. E., Kawakami, R., Sato, Y., Ghosh, S., Virmani, R., & Finn, A. V. (2022) · Expert Review of Cardiovascular Therapy · doi:10.1080/14779072.2022.2111301 · Cited by 6
Obesity and atherosclerosis: the exosome link
Reiss, A. B., Glass, D. S., Voloshyna, I., Glass, A. D., Kasselman, L. J., & Leon, J. D. (2020) · Vessel Plus · doi:10.20517/2574-1209.2020.04 · Cited by 7
Potential beneficial effects of ixmyelocel-T in the treatment of atherosclerotic diseases
Ledford, K. J., Murphy, N., Zeigler, F., & Bartel, R. L. (2013) · Stem Cell Research & Therapy · doi:10.1186/scrt346 · Cited by 5
Laskou, M., Delbare, S., Gildea, M., Weinstock, A., Virginio, V. D. M., Forest, M. L., Krautter, F., Donahoe, C., Amadori, L., Eberhardt, N., et al. (2025) · JCI Insight · doi:10.1172/jci.insight.193593 · Cited by 4
Self-citationMilde, R., Pesant, M., Locati, M., & Martínez, F. O. (2014) · Springer eBooks · doi:10.1007/978-1-4939-1311-4_28 · Cited by 2
Role of Autophagy in Atherogenesis
Robinet, P., & Smith, J. D. (2015) · Elsevier eBooks · doi:10.1016/b978-0-12-801033-4.00013-8 · Cited by 2
Connecting Transcriptional and Functional Macrophage Heterogeneity in Atherosclerosis
Schlegel, M., Koelwyn, G. J., & Moore, K. J. (2019) · Circulation Research · doi:10.1161/circresaha.119.316168 · Cited by 2
Metadata
- Authors
- Feig, J. E., Vengrenyuk, Y., Reiser, V., Wu, C., Statnikov, A., Aliferis, C. F., Garabedian, M. J., Fisher, E. A., & Puig, O.
- Affiliations
- New York University (US)
- Corresponding author
- Fisher, Edward A.
- Venue
- PLoS ONE
- Publisher
- Public Library of Science (PLoS)
- Published
- 2012-06-27
- Volume
- 7
- Issue
- 6
- Pages
- e39790
- ISSN
- 1932-6203 (ISSN-L)
- PMC
- PMC3384622
- OpenAlex
- W2167104273
- Cited by
- 118
- References
- 38
- Citations by year
- 2026: 2 · 2025: 3 · 2024: 7 · 2023: 3 · 2022: 7 · 2021: 9 · 2020: 10 · 2019: 13 · 2018: 14 · 2017: 6 · 2016: 4 · 2015: 14 · 2014: 16 · 2013: 8 · 2012: 2
- FWCI
- 5.57
- Type
- journal article
- Language
- en
- Open access
- gold
- doi.org
- Locations
- PLoS ONE (publishedVersion, cc-by)
- Europe PMC (PubMed Central) (publishedVersion, cc-by)
- PubMed Central (publishedVersion, cc-by)
- PubMed (publishedVersion)
- DOAJ (DOAJ: Directory of Open Access Journals) (submittedVersion, cc-by-sa)
- Figshare (submittedVersion, cc-by)
- Funders
- National Institutes of Health
- National Institute on Aging (AG-029748, F30AG029748)
- National Heart, Lung, and Blood Institute (R01HL084312, HL-084312, T32HL098129)
- U.S. National Library of Medicine (R56LM007948)
- National Center for Research Resources (UL1RR029893)
- Topics
- Life Sciences › Immunology and Microbiology › Immunology › Atherosclerosis and Cardiovascular Diseases
- Life Sciences › Biochemistry, Genetics and Molecular Biology › Biochemistry › Cholesterol and Lipid Metabolism
- Health Sciences › Medicine › Cardiology and Cardiovascular Medicine › Cerebrovascular and Carotid Artery Diseases
- Keywords
- atherosclerosis regression, atherosclerotic plaque, macrophages, macrophage transcriptome, CD68+ macrophages, M2 macrophage phenotype, anti-inflammatory macrophages, cell motility, cell adhesion, arginase-1, CD163, hyperlipidemia, plaque regression
- MeSH terms
- CD68 Molecule, Animals, Apolipoproteins E, Macrophages, Mice, Inbred C57BL, Antigens, Differentiation, Myelomonocytic, Antigens, CD, Mice, Knockout, Atherosclerosis, Mice, Transcriptome, Real-Time Polymerase Chain Reaction
About these checks
Registry, retraction, Cites and statistics results are computed, not judged, with one exception: a printed reference that no index lists is read once by a model before it counts as a citation error. Claims are extracted by a model and kept only when their quote appears verbatim in the text; each cited source is then checked, with a model’s help, for whether it says what the claim relies on. Those verdicts can be wrong — read the claim’s quote and the cited source before relying on one.
Statistics and arithmetic are recomputed, not judged.
Confidence bands are shown only for fields calibrated on our annotated test set. None is calibrated yet, so no band is shown.
What counts as a claim ›How we measure confidence ›How we check this ›
Are you an author, or do you see a problem with this page? Request a review
