

The DOI matches its Crossref record; 52 of the 52 references it cites were found in a registry or an index.
Pronounced Effects of Acute Endurance Exercise on Gene Expression in Resting and Exercising Human Skeletal Muscle
Open accessAbstract
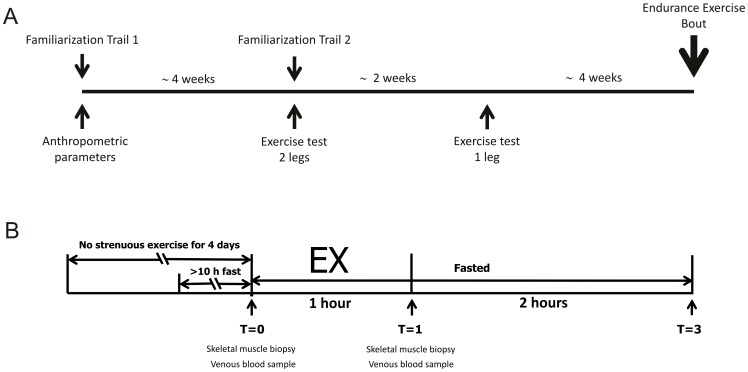
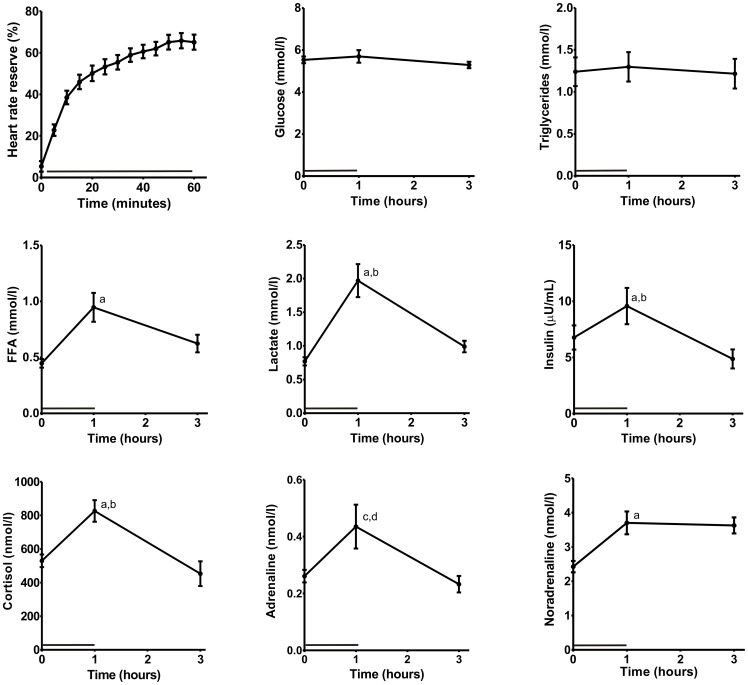
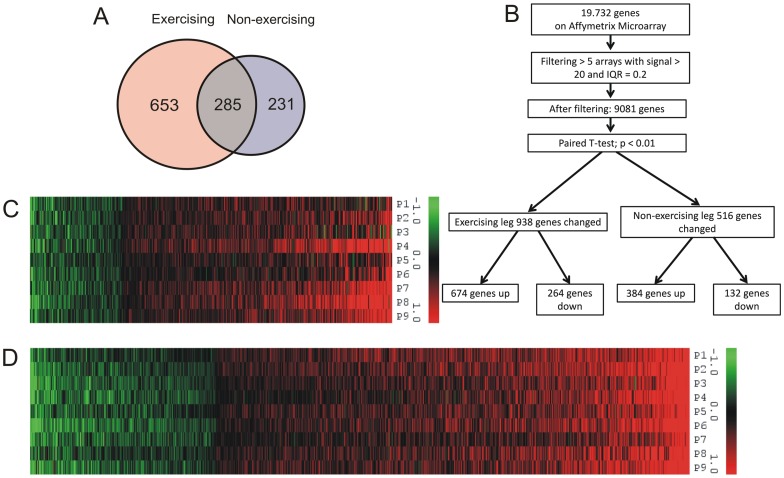
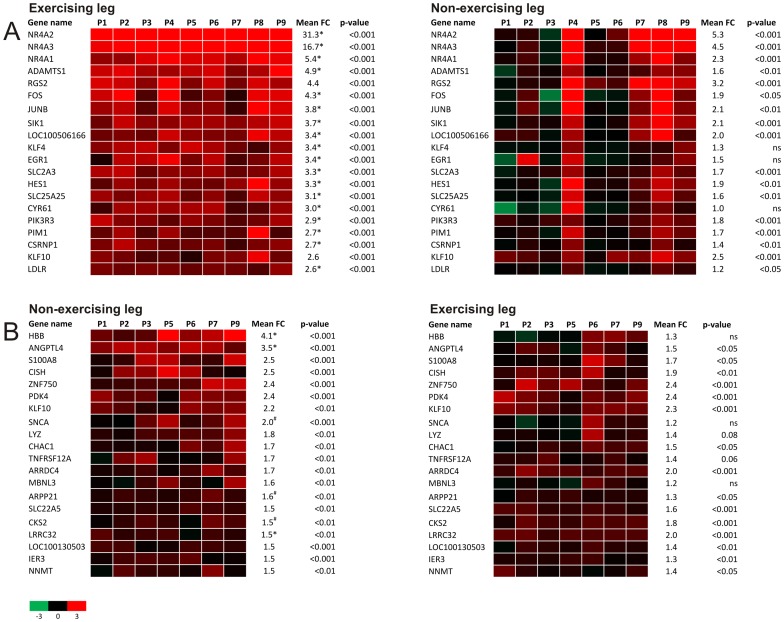
Regular physical activity positively influences whole body energy metabolism and substrate handling in exercising muscle. While it is recognized that the effects of exercise extend beyond exercising muscle, it is unclear to what extent exercise impacts non-exercising muscles. Here we investigated the effects of an acute endurance exercise bouts on gene expression in exercising and non-exercising human muscle. To that end, 12 male subjects aged 44-56 performed one hour of one-legged cycling at 50% W(max). Muscle biopsies were taken from the exercising and non-exercising leg before and immediately after exercise and analyzed by microarray. One-legged cycling raised plasma lactate, free fatty acids, cortisol, noradrenalin, and adrenalin levels. Surprisingly, acute endurance exercise not only caused pronounced gene expression changes in exercising muscle but also in non-exercising muscle. In the exercising leg the three most highly induced genes were all part of the NR4A family. Remarkably, many genes induced in non-exercising muscle were PPAR targets or related to PPAR signalling, including PDK4, ANGPTL4 and SLC22A5. Pathway analysis confirmed this finding. In conclusion, our data indicate that acute endurance exercise elicits pronounced changes in gene expression in non-exercising muscle, which are likely mediated by changes in circulating factors such as free fatty acids. The study points to a major influence of exercise beyond the contracting muscle.
Overview
The claims and statistics of this paper haven’t been checked yet.
Run the check — free, no account needed. It reads the open-access text and checks the sources it cites.
Integrity signals
Registry
Cites
Statistics
Figures
Verification
Claims the paper makes
The claims and statistics of this paper haven’t been checked yet.
Run the check — free, no account needed. It reads the open-access text and checks the sources it cites.
Claims other papers make about this one
Each is checked against this paper’s own text: does it say what the citing paper says it does?
The source backs part of the claim, not all of it — or backs it for a different population, condition or comparison.
In the citing paper
“Although it is upregulated by SkM after aerobic or resistance exercise [171,172,196], surprisingly, an even greater degree of ANGPTL4 mRNA expression was found in the portion of SkM that remained inactive during the bout of exercise compared with the active SkM [172,196], representing a mechanism to redistribute FFA delivery from unexercised to exercised SkM.”
From The Role of Exercise in the Interplay between Myokines, Hepatokines, Osteokines, Adipokines, and Modulation of Inflammation for Energy Substrate Redistribution and Fat Mass Loss: A Review (2020) · cites this paper as [196]
Experimental — accuracy not yet measuredThe cited source says what the claim attributes to it.
In the citing paper
“Although it is upregulated by SkM after aerobic or resistance exercise [171,172,196], surprisingly, an even greater degree of ANGPTL4 mRNA expression was found in the portion of SkM that remained inactive during the bout of exercise compared with the active SkM [172,196], representing a mechanism to redistribute FFA delivery from unexercised to exercised SkM.”
Self-check
Percentages, sums and reported differences re-computed from the paper’s own numbers.
The self-check needs the paper’s full text.
Citations
Cites
Cytoscape: A software Environment for integrated models of biomolecular interaction networks
Shannon, P., Markiel, A., Ozier, O., Baliga, N. S., Wang, J. T., Ramage, D., Amin, N., Schwikowski, B., & Ideker, T. (2003) · Genome Research · doi:10.1101/gr.1239303 · Cited by 51,888
Bolstad, B. M., Irizarry, R. A., Åstrand, M., & Speed, T. P. (2003) · Bioinformatics · doi:10.1093/bioinformatics/19.2.185 · Cited by 8,328
Bindea, G., Mlecnik, B., Hackl, H., Charoentong, P., Tosolini, M., Kirilovsky, A., Fridman, W.-H., Pagès, F., Trajanoski, Z., & Galon, J. (2009) · Bioinformatics · doi:10.1093/bioinformatics/btp101 · Cited by 6,280
Evolving gene/transcript definitions significantly alter the interpretation of GeneChip data
Dai, M. (2005) · Nucleic Acids Research · doi:10.1093/nar/gni179 · Cited by 1,807
Krey, G. D., Braissant, O., L’Horset, F., Kalkhoven, E., Perroud, M., Parker, M. G., & Wahli, W. (1997) · Molecular Endocrinology · doi:10.1210/mend.11.6.0007 · Cited by 1,230
Peroxisome proliferator-activated receptor a target genes
Mandard, S., M�ller, M., & Kersten, S. (2004) · Cellular and Molecular Life Sciences · doi:10.1007/s00018-003-3216-3 · Cited by 1,222
Self-citationPeroxisome Proliferator-Activated Receptor Alpha Target Genes
Rakhshandehroo, M., Knoch, B., Müller, M., & Kersten, S. (2010) · PPAR Research · doi:10.1155/2010/612089 · Cited by 1,020
Self-citationTranscriptional regulation of gene expression in human skeletal muscle during recovery from exercise
Pilegaard, H., Ordway, G. A., Saltin, B., & Neufer, P. D. (2000) · American Journal of Physiology-Endocrinology and Metabolism · doi:10.1152/ajpendo.2000.279.4.e806 · Cited by 563
Contralateral effects of unilateral strength training: evidence and possible mechanisms
Carroll, T. J., Herbert, R., Munn, J., Lee, M., & Gandevia, S. C. (2006) · Journal of Applied Physiology · doi:10.1152/japplphysiol.00531.2006 · Cited by 527
Changes in human muscle protein synthesis after resistance exercise
Chesley, A., MacDougall, J. D., Tarnopolsky, M. A., Atkinson, S. A., & Smith, K. (1992) · Journal of Applied Physiology · doi:10.1152/jappl.1992.73.4.1383 · Cited by 436
Cited by
Sorted by citations
Role of Skeletal Muscle in Insulin Resistance and Glucose Uptake
Merz, K. E., & Thurmond, D. C. (2020) · Comprehensive Physiology · doi:10.1002/cphy.c190029 · Cited by 494
AMPK in skeletal muscle function and metabolism
Kjøbsted, R., Hingst, J. R., Fentz, J., Foretz, M., Sanz, M.-N., Pehmøller, C. K., Shum, M., Marette, A., Mounier, R., Treebak, J. T., et al. (2017) · The FASEB Journal · doi:10.1096/fj.201700442r · Cited by 517
Transcriptomic profiling of skeletal muscle adaptations to exercise and inactivity
Pillon, N. J., Gabriel, B. M., Dollet, L., Smith, J. A. B., Sardón Puig, L., Botella, J., Bishop, D. J., Krook, A., & Zierath, J. R. (2020) · Nature Communications · doi:10.1038/s41467-019-13869-w · Cited by 457
The pivotal role of pyruvate dehydrogenase kinases in metabolic flexibility
Zhang, S., Hulver, M. W., McMillan, R. P., Cline, M. A., & Gilbert, E. R. (2014) · Nutrition & Metabolism · doi:10.1186/1743-7075-11-10 · Cited by 450
Adipo-myokines: two sides of the same coin–mediators of inflammation and mediators of exercise
Raschke, S., & Eckel, J. (2013) · Mediators of Inflammation · doi:10.1155/2013/320724 · Cited by 296
Gonzalez-Gil, A. M., & Elizondo-Montemayor, L. (2020) · Nutrients · doi:10.3390/nu12061899 · Cited by 278
Egan, B., & Sharples, A. P. (2023) · Physiological Reviews · doi:10.1152/physrev.00054.2021 · Cited by 278
Raschke, S., Eckardt, K., Bjørklund Holven, K., Jensen, J., & Eckel, J. (2013) · PLoS ONE · doi:10.1371/journal.pone.0062008 · Cited by 199
Identification of human exercise-induced myokines using secretome analysis
Catoire, M., Mensink, M., Kalkhoven, E., Schrauwen, P., & Kersten, S. (2014) · Physiological Genomics · doi:10.1152/physiolgenomics.00174.2013 · Cited by 179
Klymiuk, N., Blutke, A., Graf, A., Krause, S., Burkhardt, K., Wuensch, A., Krebs, S., Keßler, B., Zakhartchenko, V., Kurome, M., et al. (2013) · Human Molecular Genetics · doi:10.1093/hmg/ddt287 · Cited by 191
Fatty acid-inducible ANGPTL4 governs lipid metabolic response to exercise
Catoire, M., Alex, S., Paraskevopulos, N., Mattijssen, F., Evers-van Gogh, I., Schaart, G., Jeppesen, J., Kneppers, A., Mensink, M., Voshol, P. J., et al. (2014) · Proceedings of the National Academy of Sciences · doi:10.1073/pnas.1400889111 · Cited by 150
Self-citationTranscriptomic analyses reveal rhythmic and CLOCK-driven pathways in human skeletal muscle
Perrin, L., Loizides-Mangold, U., Chanon, S., Gobet, C., Hulo, N., Isenegger, L., Weger, B. D., Migliavacca, E., Charpagne, A., Betts, J. A., et al. (2018) · eLife · doi:10.7554/elife.34114 · Cited by 139
The search for exercise factors in humans
Catoire, M., & Kersten, S. (2015) · The FASEB Journal · doi:10.1096/fj.14-263699 · Cited by 137
Self-citationShafi, O. (2016) · BMC Neurology · doi:10.1186/s12883-016-0765-2 · Cited by 125
Role of exercise in maintaining the integrity of the neuromuscular junction
Nishimune, H., Stanford, J. A., & Mori, Y. (2013) · Muscle and Nerve · doi:10.1002/mus.24095 · Cited by 119
Ni, A., & Ernst, C. (2022) · Frontiers in Cellular Neuroscience · doi:10.3389/fncel.2022.826193 · Cited by 125
Exercise-induced Nrf2-signaling is impaired in aging
Done, A. J., Gage, M. J., Nieto, N. C., & Traustadóttir, T. (2016) · Free Radical Biology and Medicine · doi:10.1016/j.freeradbiomed.2016.04.024 · Cited by 99
Exercise conditioning in old mice improves skeletal muscle regeneration
Joanisse, S., Nederveen, J. P., Baker, J. M., Snijders, T., Iacono, C., & Parise, G. (2016) · The FASEB Journal · doi:10.1096/fj.201600143rr · Cited by 83
Popov, D. V., Makhnovskii, P. A., Shagimardanova, E. I., Gazizova, G. R., Lysenko, E. A., Gusev, O., & Виноградова, О. Л. (2019) · American Journal of Physiology-Endocrinology and Metabolism · doi:10.1152/ajpendo.00449.2018 · Cited by 82
Bouchard‐Mercier, A., Paradis, A.-M., Rudkowska, I., Lemieux, S., Couture, P., & Vohl, M. (2013) · Nutrition Journal · doi:10.1186/1475-2891-12-24 · Cited by 81
Shefer, G., Rauner, G., Stuelsatz, P., Benayahu, D., & Yablonka‐Reuveni, Z. (2013) · The FEBS Journal · doi:10.1111/febs.12228 · Cited by 72
Simplified data access on human skeletal muscle transcriptome responses to differentiated exercise
Vissing, K., & Schjerling, P. (2014) · Scientific Data · doi:10.1038/sdata.2014.41 · Cited by 70
Factors mediating exercise‐induced organ crosstalk
Sabaratnam, R., Wojtaszewski, J. F. P., & Højlund, K. (2022) · Acta Physiologica · doi:10.1111/apha.13766 · Cited by 70
Renzo, L. D., Marsella, L., Carraro, A., Valente, R., Gualtieri, P., Gratteri, S., Tomasi, D., Gaiotti, F., & LORENZO, A. D. (2015) · Mediators of Inflammation · doi:10.1155/2015/317348 · Cited by 66
Pearen, M. A., Goode, J. M., Fitzsimmons, R. L., Eriksson, N. A., Thomas, G. P., Cowin, G., Wang, S.-C., Tuong, Z. K., & Muscat, G. E. O. (2013) · Molecular Endocrinology · doi:10.1210/me.2013-1205 · Cited by 63
Gene and MicroRNA Expression Responses to Exercise; Relationship with Insulin Sensitivity
McLean, C. G., Mielke, C. J., Cordova, J. M., Langlais, P. R., Bowen, B. P., Miranda, D. N., Coletta, D. K., & Mandarino, L. J. (2015) · PLoS ONE · doi:10.1371/journal.pone.0127089 · Cited by 60
Role of exercise-induced hepatokines in metabolic disorders
Ennequin, G., Sirvent, P., & Whitham, M. (2019) · American Journal of Physiology-Endocrinology and Metabolism · doi:10.1152/ajpendo.00433.2018 · Cited by 54
Gogh, I. J. A. E., Alex, S., Stienstra, R., Brenkman, A. B., Kersten, S., & Kalkhoven, E. (2015) · Scientific Reports · doi:10.1038/srep10944 · Cited by 58
Self-citationExercise and the Skeletal Muscle EpigenomePreprint
McGee, S. L., & Walder, K. R. (2017) · Cold Spring Harbor Perspectives in Medicine · doi:10.1101/cshperspect.a029876 · Cited by 56
NR4A orphan nuclear receptors in glucose homeostasis: A minireview
Close, A. F., Rouillard, C., & Buteau, J. (2013) · Diabetes & Metabolism · doi:10.1016/j.diabet.2013.07.005 · Cited by 52
NURR1 activation in skeletal muscle controls systemic energy homeostasis
Amoasii, L., Sanchez‐Ortiz, E., Fujikawa, T., Elmquist, J. K., Bassel‐Duby, R., & Olson, E. N. (2019) · Proceedings of the National Academy of Sciences · doi:10.1073/pnas.1902490116 · Cited by 50
SF-1 expression in the hypothalamus is required for beneficial metabolic effects of exercise
Fujikawa, T., Castorena, C. M., Pearson, M. J., Kusminski, C. M., Ahmed, N. I., Battiprolu, P. K., Kim, K. W., Lee, S., Hill, J. A., Scherer, P. E., et al. (2016) · eLife · doi:10.7554/elife.18206 · Cited by 51
Maasar, M. F., Turner, D. C., Gorski, P. P., Seaborne, R. A. E., Strauss, J. A., Shepherd, S. O., Cocks, M. S., Pillon, N. J., Zierath, J. R., Hulton, A. T., et al. (2021) · Frontiers in Physiology · doi:10.3389/fphys.2021.619447 · Cited by 54
Physical activity and its mechanistic effects on prostate cancer
Wekesa, A., Harrison, M., & Watson, R. W. G. (2015) · Prostate Cancer and Prostatic Diseases · doi:10.1038/pcan.2015.9 · Cited by 47
Intensity-dependent gene expression after aerobic exercise in endurance-trained skeletal muscle
Викторович, П. Д., Makhnovskii, P. A., Kurochkina, N. S., Lysenko, E. A., Vepkhvadze, T. F., & Виноградова, О. Л. (2018) · Biology of Sport · doi:10.5114/biolsport.2018.77828 · Cited by 45
Amoasii, L., Holland, W. L., Sanchez‐Ortiz, E., Baskin, K. K., Pearson, M. J., Burgess, S. C., Nelson, B. R., Bassel‐Duby, R., & Olson, E. N. (2016) · Genes & Development · doi:10.1101/gad.273128.115 · Cited by 49
Muscle Contraction Induces Acute Hydroxymethylation of the Exercise-Responsive Gene Nr4a3
Pattamaprapanont, P., Garde, C., Fabre, O., & Barrès, R. (2016) · Frontiers in Endocrinology · doi:10.3389/fendo.2016.00165 · Cited by 40
Innate immune receptors in skeletal muscle metabolism
Pillon, N. J., & Krook, A. (2017) · Experimental Cell Research · doi:10.1016/j.yexcr.2017.02.035 · Cited by 43
Aoi, W., Hirano, N., Lassiter, D. G., Björnholm, M., Chibalin, A., Sakuma, K., Tanimura, Y., Mizushima, K., Takagi, T., Naito, Y., et al. (2019) · The FASEB Journal · doi:10.1096/fj.201900453r · Cited by 43
Lagerwaard, B., Keijer, J., McCully, K. K., de Boer, V. C. J., & Nieuwenhuizen, A. G. (2019) · European Journal of Applied Physiology · doi:10.1007/s00421-019-04169-8 · Cited by 40
Hart, C. R., Ryan, Z. C., Pfaffenbach, K. T., Dasari, S., Parvizi, M., Lalia, A. Z., & Lanza, I. R. (2019) · Aging · doi:10.18632/aging.102273 · Cited by 42
Exercise-induced mitochondrial dysfunction: a myth or reality?
Ostojić, S. M. (2016) · Clinical Science · doi:10.1042/cs20160200 · Cited by 37
Vendelbo, M. H., Møller, A. B., Treebak, J. T., Gormsen, L. C., Goodyear, L. J., Wojtaszewski, J. F. P., Jørgensen, J. O. L., Møller, N., & Jessen, N. (2014) · Journal of Applied Physiology · doi:10.1152/japplphysiol.00044.2014 · Cited by 34
Little, H. C., Tan, S. Y., Cali, F. M., Rodriguez, S., Lei, X., Wolfe, A., Hug, C., & Wong, G. W. (2018) · Molecular & Cellular Proteomics · doi:10.1074/mcp.ra118.000794 · Cited by 33
Norepinephrine Stimulates Mobilization of Endothelial Progenitor Cells after Limb Ischemia
Jiang, Q., Ding, S., Wu, J., Liu, X., & Wu, Z. (2014) · PLoS ONE · doi:10.1371/journal.pone.0101774 · Cited by 32
The orphan nuclear receptor Nor1/Nr4a3 is a negative regulator of β-cell mass
Close, A.-F., Dadheech, N., Villela, B. S., Rouillard, C., & Buteau, J. (2019) · Journal of Biological Chemistry · doi:10.1074/jbc.ra118.005135 · Cited by 33
Aerobic exercise training partially reverses the impairment of Nrf2 activation in older humans
Ostrom, E. L., & Traustadóttir, T. (2020) · Free Radical Biology and Medicine · doi:10.1016/j.freeradbiomed.2020.08.016 · Cited by 36
Popov, D. V., Lysenko, E. A., Bokov, R. O., Volodina, M. A., Kurochkina, N. S., Makhnovskii, P. A., Vyssokikh, M. Y., & Виноградова, О. Л. (2018) · Physiological Reports · doi:10.14814/phy2.13868 · Cited by 31
Fan, Z., Ardicoglu, R., Batavia, A. A., Rust, R., von Ziegler, L., Waag, R., Zhang, J., Desgeorges, T., Sturman, O., Dang, H., et al. (2023) · Angiogenesis · doi:10.1007/s10456-023-09870-z · Cited by 34
Hargreaves, M. (2015) · Progress in molecular biology and translational science · doi:10.1016/bs.pmbts.2015.07.006 · Cited by 32
Nur77 deletion impairs muscle growth during developmental myogenesis and muscle regeneration in mice
Cortez-Toledo, O., Schnair, C., Sangngern, P., METZGER, D., & Chao, L. C. (2017) · PLoS ONE · doi:10.1371/journal.pone.0171268 · Cited by 34
Macrophages on the run: Exercise balances macrophage polarization for improved health
Voskoboynik, Y., McCulloch, A. D., & Sahoo, D. (2024) · Molecular Metabolism · doi:10.1016/j.molmet.2024.102058 · Cited by 31
Gjyshi, A., Dash, S., Cen, L., Cheng, C., Zhang, C. H., Yoder, S., Teer, J. K., Armaiz-Peña, G. N., & Monteiro, Á. N. A. (2018) · Scientific Reports · doi:10.1038/s41598-018-26670-4 · Cited by 30
Makhnovskii, P. A., Bokov, R. O., Kolpakov, F., & Popov, D. V. (2021) · International Journal of Molecular Sciences · doi:10.3390/ijms22031208 · Cited by 32
Transcriptional memory in skeletal muscle. Don't forget (to) exercise
Beiter, T., Niess, A. M., & Moser, D. (2020) · Journal of Cellular Physiology · doi:10.1002/jcp.29535 · Cited by 30
Pérez‐Schindler, J., & Philp, A. (2015) · Clinical Science · doi:10.1042/cs20150246 · Cited by 28
Role of Angptl4/Fiaf in exercise-induced skeletal muscle AMPK activation
Chang, H., Kwon, O., Shin, M.-S., Kang, G. M., Leem, Y. H., Lee, C. H., Kim, S. J., Roh, E., Kim, H.-K., Youn, B., et al. (2018) · Journal of Applied Physiology · doi:10.1152/japplphysiol.00984.2016 · Cited by 27
Yang, H. J., Xiao, L., & Xu, D. (2020) · Cardiovascular Drugs and Therapy · doi:10.1007/s10557-020-07001-0 · Cited by 26
Stirm, M., Fonteyne, L. M., Shashikadze, B., Stöckl, J. B., Kurome, M., Keßler, B., Zakhartchenko, V., Kemter, E., Blum, H., Arnold, G. J., et al. (2022) · Neuromuscular Disorders · doi:10.1016/j.nmd.2022.04.005 · Cited by 28
Na, C.-S., Yoon, S. Y., Kim, J. B., Na, D. S., Dong, M., Lee, M., & Hong, C. Y. (2013) · The American Journal of Chinese Medicine · doi:10.1142/s0192415x13500638 · Cited by 25
Chen, L., Bai, J., & Li, Y. (2020) · Molecular Medicine Reports · doi:10.3892/mmr.2020.11164 · Cited by 26
Alves, R. D. A. M., Dane, A. D., Harms, A. C., Strassburg, K., Seifar, R. M., Verdijk, L. B., Kersten, S., Berger, R., Hankemeier, T., & Vreeken, R. J. (2014) · Metabolomics · doi:10.1007/s11306-014-0701-7 · Cited by 23
Self-citationGórecka, M., Krzeminski, K., Buraczewska, M., Kozacz, A., Dąbrowski, J., & Ziemba, A. W. (2019) · European Journal of Applied Physiology · doi:10.1007/s00421-019-04256-w · Cited by 21
Exercise-induced gene expression changes in skeletal muscle of old mice
Endo, Y., Zhang, Y., Olumi, S., Karvar, M., Argawal, S., Neppl, R. L., & Sinha, I. (2021) · Genomics · doi:10.1016/j.ygeno.2021.06.035 · Cited by 20
Regulation of PPARGC1A gene expression in trained and untrained human skeletal muscle
Popov, D. V., Lysenko, E. A., Makhnovskii, P. A., Kurochkina, N. S., & Виноградова, О. Л. (2017) · Physiological Reports · doi:10.14814/phy2.13543 · Cited by 20
Akberdin, I. R., Kiselev, I. N., Pintus, S. S., Sharipov, R., Vertyshev, A. Y., Виноградова, О. Л., Popov, D. V., & Kolpakov, F. (2021) · International Journal of Molecular Sciences · doi:10.3390/ijms221910353 · Cited by 19
Diverio, S., Guelfi, G., Barbato, O., Mari, W. D., Egidi, M. G., & Santoro, M. M. (2014) · animal · doi:10.1017/s1751731114002304 · Cited by 16
Preliminary evidence that age and sex affect exercise-induced hTERT expression
Cluckey, T. G., Nieto, N. C., Rodoni, B. M., & Traustadóttir, T. (2017) · Experimental Gerontology · doi:10.1016/j.exger.2017.06.003 · Cited by 16
Transcriptomic Responses of Skeletal Muscle to Acute Exercise in Diabetic Goto-Kakizaki Rats
Fu, S., Meng, Y., Zhang, W., Wang, J., He, Y., Huang, L., Chen, H., Kuang, J., & Du, H. (2019) · Frontiers in Physiology · doi:10.3389/fphys.2019.00872 · Cited by 16
Han, S., Wu, Q., Wang, M., Yang, M., Sun, C., Liang, J., Guo, X., Zhang, Z., Xu, J., Qiu, X., et al. (2023) · Journal of Molecular Cell Biology · doi:10.1093/jmcb/mjad016 · Cited by 14
Effects of extracellular orotic acid on acute contraction-induced adaptation patterns in C2C12 cells
Beiter, T., Hudemann, J., Burgstahler, C., Niess, A. M., & Munz, B. (2018) · Molecular and Cellular Biochemistry · doi:10.1007/s11010-018-3330-z · Cited by 14
Uninterrupted Sedentary Behavior Downregulates BRCA1 Gene Expression
Pettapiece-Phillips, R., Kotlyar, M., Chehade, R., Salmena, L., Narod, S. A., Akbari, M. R., Jurišica, I., & Kotsopoulos, J. (2015) · Cancer Prevention Research · doi:10.1158/1940-6207.capr-15-0291 · Cited by 14
Sabaratnam, R., Pedersen, A. J. T., Eskildsen, T. V., Kristensen, J. M., Wojtaszewski, J. F. P., & Højlund, K. (2019) · The Journal of Clinical Endocrinology & Metabolism · doi:10.1210/jc.2018-02679 · Cited by 15
Beiter, T., Zügel, M., Hudemann, J., Schild, M., Fragasso, A., Burgstahler, C., Krüger, K., Mooren, F. C., Steinacker, J. M., & Niess, A. M. (2024) · International Journal of Molecular Sciences · doi:10.3390/ijms25052881 · Cited by 14
Effects of Training Status and Exercise Mode on Global Gene Expression in Skeletal Muscle
Bizjak, D. A., Zügel, M., Treff, G., Winkert, K., Jerg, A., Hudemann, J., Mooren, F. C., Krüger, K., Niess, A. M., & Steinacker, J. M. (2021) · International Journal of Molecular Sciences · doi:10.3390/ijms222212578 · Cited by 15
Reibe, S., Hjorth, M., Febbraio, M., & Whitham, M. (2018) · Physiological Genomics · doi:10.1152/physiolgenomics.00127.2017 · Cited by 11
Modulation of PGC-1α activity as a treatment for metabolic and muscle-related diseases
Svensson, K., & Handschin, C. (2014) · Drug Discovery Today · doi:10.1016/j.drudis.2014.02.013 · Cited by 13
Nagase, H., Yao, S., & Ikeda, S. (2017) · PLoS ONE · doi:10.1371/journal.pone.0182456 · Cited by 11
Akberdin, I. R., Kiselev, I. N., Pintus, S. S., Sharipov, R. N., Vertyshev, A. Y., Vinogradova, O. L., Popov, D. V., & Kolpakov, F. A. (2021) · bioRxiv (Cold Spring Harbor Laboratory) · doi:10.1101/2021.05.31.446385 · Cited by 9
Plasma from exercised rats administered to sedentary rats induces systemic and tissue inflammation
Γουτιάνος, Γ., Veskoukis, A. S., Tzioura, A., Paschalis, V., Margaritelis, N. V., Δίπλα, Κ., Zafeiridis, A., Vrabas, I. S., Nikolaidis, M. G., & Kyparos, A. (2016) · Physiological Reports · doi:10.14814/phy2.13087 · Cited by 8
Control of Muscle Metabolism by the Mediator ComplexPreprint
Amoasii, L., Olson, E. N., & Bassel‐Duby, R. (2017) · Cold Spring Harbor Perspectives in Medicine · doi:10.1101/cshperspect.a029843 · Cited by 8
Akberdin, I. R., Vertyshev, A. Y., Pintus, S. S., Popov, D. V., & Kolpakov, F. (2020) · Mathematical Biology and Bioinformatics · doi:10.17537/2020.15.20 · Cited by 7
Marston, K. J., de Frutos‐Lucas, J., Porter, T., Milicic, L., Vacher, M. A., Sewell, K. R., Peiffer, J. J., Laws, S. M., & Brown, B. M. (2024) · Journal of science and medicine in sport · doi:10.1016/j.jsams.2024.07.017 · Cited by 6
Gehrmann, T., Beekman, M., Deelen, J., Partridge, L., van de Rest, O., Mei, L., Raz, Y., de Groot, C. P. G. M., van der Breggen, R., Reinders, M. J. T., et al. (2024) · doi:10.59368/agingbio.20240036 · Cited by 5
Katayama, M., Nomura, K., Mudry, J. M., Chibalin, A., Krook, A., & Zierath, J. R. (2024) · Molecular Metabolism · doi:10.1016/j.molmet.2024.102081 · Cited by 5
Paez, H. G., Pitzer, C. R., Ferrandi, P. J., Mohamed, J. S., & Alway, S. E. (2025) · The FASEB Journal · doi:10.1096/fj.202500375r · Cited by 5
Γουτιάνος, Γ., Margaritelis, N. V., Sparopoulou, T., Veskoukis, A. S., Vrabas, I. S., Paschalis, V., Nikolaidis, M. G., & Kyparos, A. (2020) · The Journal of Physiological Sciences · doi:10.1186/s12576-020-00737-2 · Cited by 6
Lee, H., Kim, J., Kim, K. H., Jeong, S., Cho, Y., & Kim, N. (2020) · Genes · doi:10.3390/genes11111359 · Cited by 5
Bizjak, D. A., Nussbaumer, D., Winkert, K., Treff, G., Takabajashi, K., Mentz, L., Schober, F., Buhl, J. L., John, L., Dreyhaupt, J., et al. (2023) · Sports Medicine - Open · doi:10.1186/s40798-023-00630-3 · Cited by 4
Bokov, R. O., & Popov, D. V. (2022) · Human Physiology · doi:10.1134/s0362119722030033 · Cited by 4
Pacak, C. A., Suzuki‐Hatano, S., Khadir, F., Daugherty, A. L., Sriramvenugopal, M., Gosiker, B. J., Kang, P. B., & Cade, W. T. (2023) · Journal of Translational Medicine · doi:10.1186/s12967-023-04626-1 · Cited by 4
Sulforaphane improves exercise-induced NRF2 signaling in older adults: an in vivo-ex vivo approach
Rodriguez, D. J., Ostrom, E. L., Chassman, C., Robertson, J., Pan, V., Buscaglia, R., Eggler, A. L., & Traustadóttir, T. (2025) · GeroScience · doi:10.1007/s11357-025-01939-5 · Cited by 4
Proteomic and transcriptomic response of human skeletal muscle to 12-week resistance training
Lednev, E. M., Vepkhvadze, T. F., Smirnov, I. P., Sultanov, R., Zhelankin, A. V., Kanygina, A. V., Popov, D. V., & Generozov, E. V. (2024) · Genes and Cells · doi:10.17816/gc624325 · Cited by 3
Bakhshi, M., Banaeifar, A., Arshadi, S., & Bazgir, B. (2025) · Archives of Medical Research · doi:10.1016/j.arcmed.2025.103223 · Cited by 3
Bácsi, A., Penyige, A., Becs, G., Benkő, S., Kovács, E. G., Jenei, C., Pócsi, I., Balla, J., Csernoch, L. J., & Balatoni, I. (2022) · Physiological Genomics · doi:10.1152/physiolgenomics.00090.2022 · Cited by 2
Impact of exercise and fasting on mitochondrial regulators in human muscle
Menezes, E. S., Islam, H., Arhen, B. B., Simpson, C. A., McGlory, C., & Gurd, B. J. (2024) · Translational Exercise Biomedicine · doi:10.1515/teb-2024-0014 · Cited by 2
Petrie, M. A., Suneja, M., & Shields, R. K. (2024) · International Journal of Molecular Sciences · doi:10.3390/ijms251810189 · Cited by 2
Maasar, M., Turner, D., Gorski, P., Seaborne, R. A., Strauss, J., Shepherd, S., Cocks, M., Pillon, N. J., Zierath, J., Hulton, A., et al. (2020) · bioRxiv · doi:10.1101/2020.09.11.292805 · Cited by 3
Androulakis, N. E. M., Koundourakis, N. E., Tsiakiris, C., & Notas, G. (2020) · The Journal of Sports Medicine and Physical Fitness · doi:10.23736/s0022-4707.20.11119-8 · Cited by 1
Multitissue responses to exercise: a MoTrPAC feasibility study
Chambers, T. L., Stroh, A. M., Chavez, C., Brandt, A. R., Claiborne, A., Fountain, W. A., Gries, K. J., JONES, A. M., Kuszmaul, D. J., Lee, G. A., et al. (2023) · Journal of Applied Physiology · doi:10.1152/japplphysiol.00210.2023 · Cited by 1
Retracted
Metadata
- Authors
- Catoire, M., Mensink, M., Boekschoten, M. V., Hangelbroek, R., Müller, M., Schrauwen, P., & Kersten, S.
- Affiliations
- Wageningen University & Research (NL)
- Maastricht University Medical Centre (NL)
- Corresponding author
- Kersten, Sander
- ORCID
- Venue
- PLoS ONE
- Publisher
- Public Library of Science (PLoS)
- Published
- 2012-11-30
- Volume
- 7
- Issue
- 11
- Pages
- e51066
- ISSN
- 1932-6203 (ISSN-L)
- PMC
- PMC3511348
- OpenAlex
- W2098809392
- Cited by
- 116
- References
- 51
- Citations by year
- 2026: 1 · 2025: 3 · 2024: 10 · 2023: 6 · 2022: 7 · 2021: 9 · 2020: 14 · 2019: 12 · 2018: 8 · 2017: 10 · 2016: 9 · 2015: 8 · 2014: 9 · 2013: 10
- FWCI
- 9.14
- Type
- journal article
- Language
- en
- Open access
- gold
- doi.org
- Locations
- PLoS ONE (publishedVersion, cc-by)
- PubMed Central (publishedVersion, cc-by)
- PubMed (publishedVersion)
- Research Publications (Maastricht University) (publishedVersion, cc-by)
- Socio-Environmental Systems Modeling (acceptedVersion)
- DOAJ (DOAJ: Directory of Open Access Journals) (submittedVersion, cc-by-sa)
- Figshare (submittedVersion, cc-by)
- UEA Digital Repository (University of East Anglia) (submittedVersion)
- Research Publications (Maastricht University) (submittedVersion, other-oa)
- Data Archiving and Networked Services (DANS) (submittedVersion, other-oa)
- Topics
- Health Sciences › Medicine › Physiology (medical) › Exercise and Physiological Responses
- Health Sciences › Medicine › Physiology (medical) › Cardiovascular and exercise physiology
- Life Sciences › Biochemistry, Genetics and Molecular Biology › Molecular Biology › Peroxisome Proliferator-Activated Receptors
- Keywords
- acute endurance exercise, skeletal muscle gene expression, PPAR signaling, PDK4, ANGPTL4, SLC22A5, free fatty acids, circulating factors, plasma lactate, cortisol, norepinephrine, energy metabolism
- MeSH terms
- Fatty Acids, Nonesterified, Gene Expression Regulation, Heart Rate, Humans, Hydrocortisone, Insulin, Leg, Male, Middle Aged, Norepinephrine, Physical Endurance, Rest, Transcription Factors, Exercise, Up-Regulation, Muscle, Skeletal, Gene Regulatory Networks
About these checks
Registry, retraction, Cites and statistics results are computed, not judged, with one exception: a printed reference that no index lists is read once by a model before it counts as a citation error. Claims are extracted by a model and kept only when their quote appears verbatim in the text; each cited source is then checked, with a model’s help, for whether it says what the claim relies on. Those verdicts can be wrong — read the claim’s quote and the cited source before relying on one.
Statistics and arithmetic are recomputed, not judged.
Confidence bands are shown only for fields calibrated on our annotated test set. None is calibrated yet, so no band is shown.
What counts as a claim ›How we measure confidence ›How we check this ›
Are you an author, or do you see a problem with this page? Request a review
