

The DOI matches its Crossref record; 62 of the 62 references it cites were found in a registry or an index.
Archaea and Fungi of the Human Gut Microbiome: Correlations with Diet and Bacterial Residents
Open accessAbstract
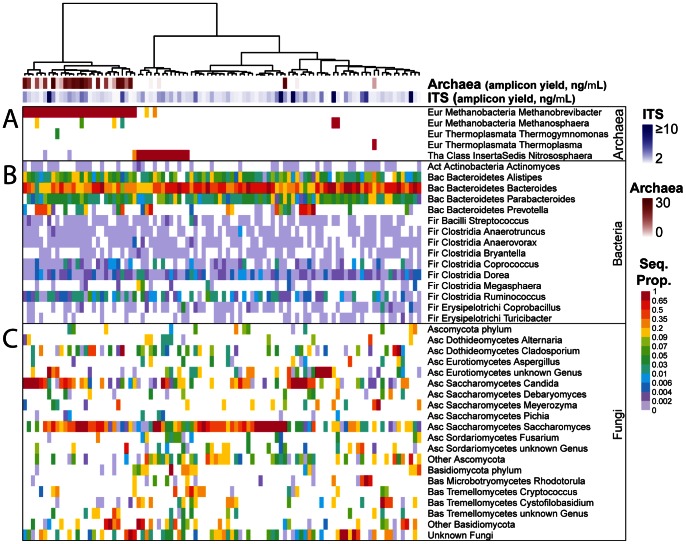
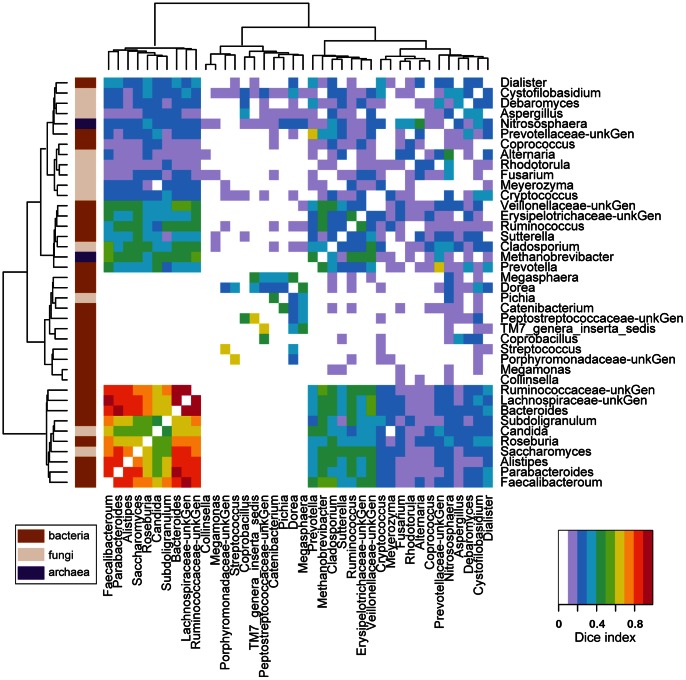
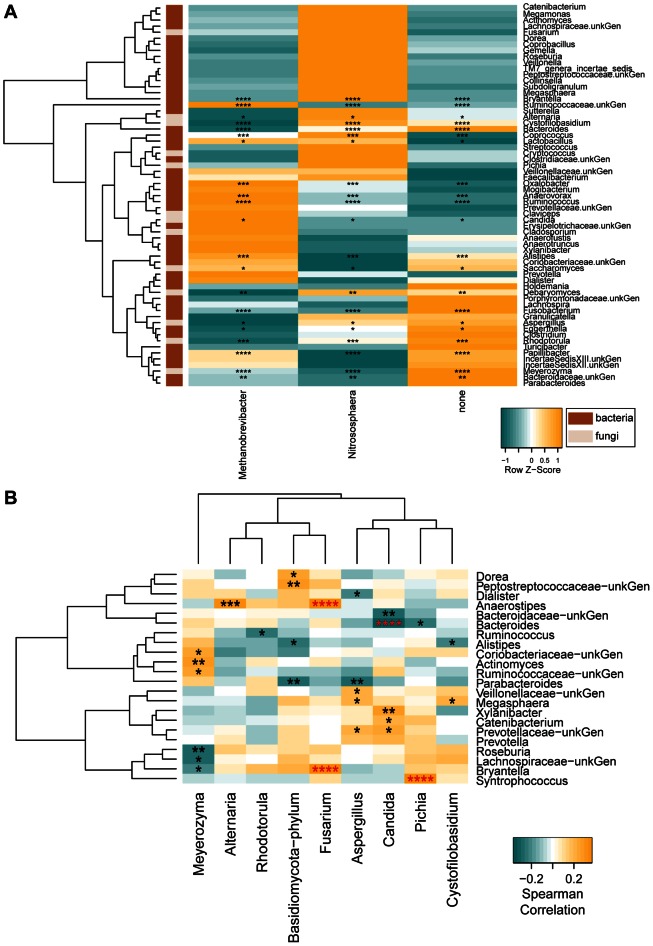
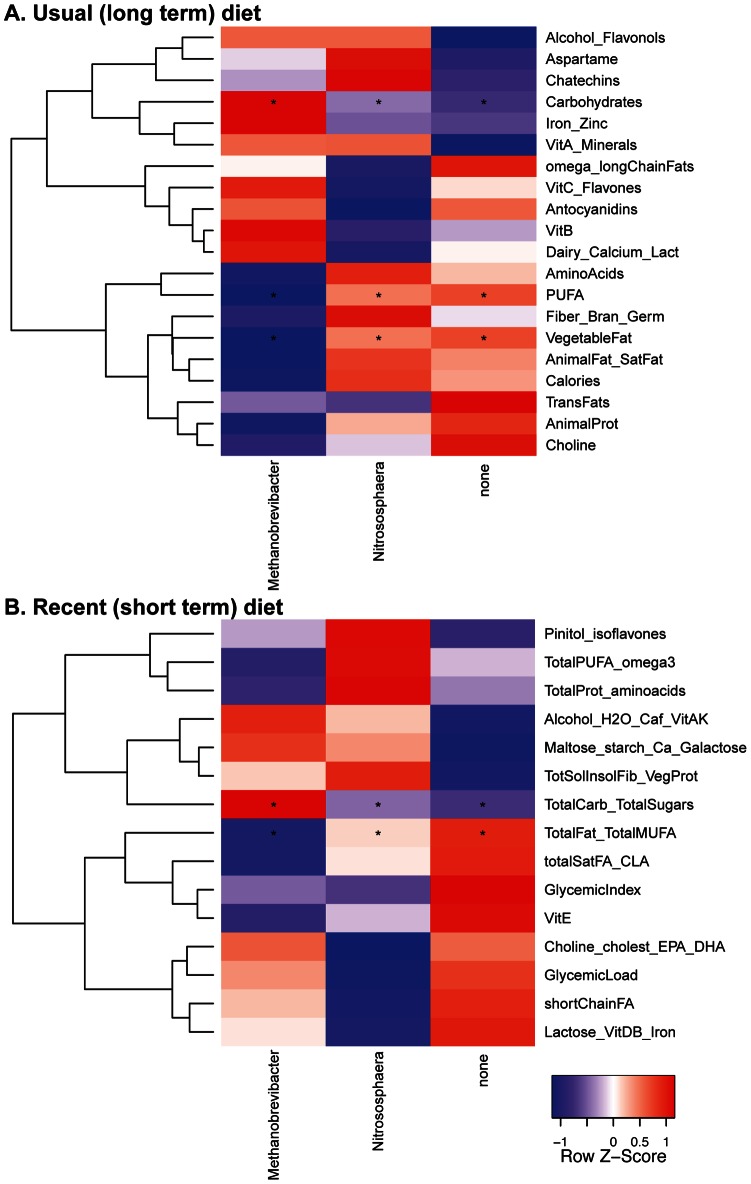
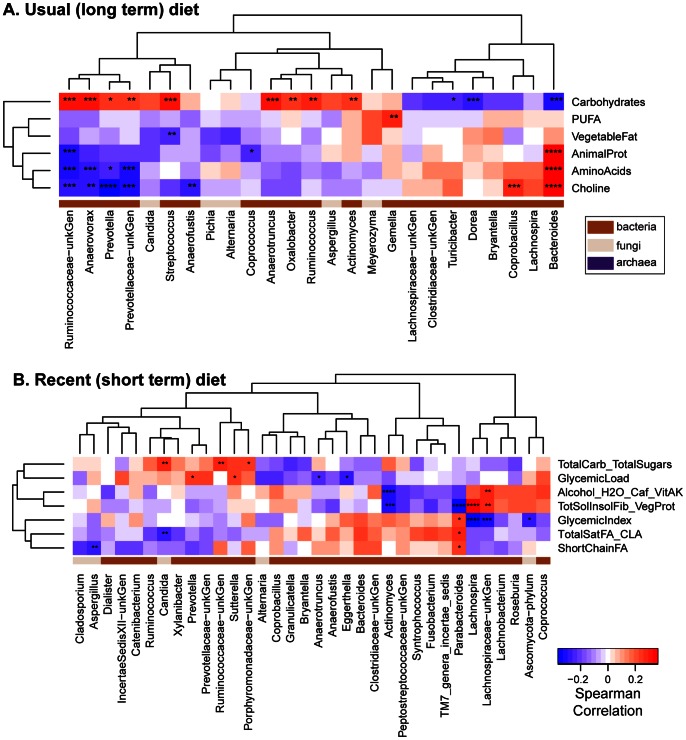
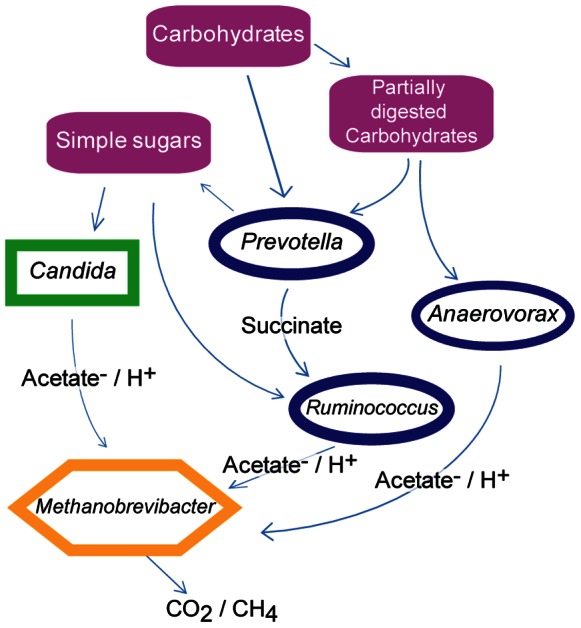
Diet influences health as a source of nutrients and toxins, and by shaping the composition of resident microbial populations. Previous studies have begun to map out associations between diet and the bacteria and viruses of the human gut microbiome. Here we investigate associations of diet with fungal and archaeal populations, taking advantage of samples from 98 well-characterized individuals. Diet was quantified using inventories scoring both long-term and recent diet, and archaea and fungi were characterized by deep sequencing of marker genes in DNA purified from stool. For fungi, we found 66 genera, with generally mutually exclusive presence of either the phyla Ascomycota or Basiodiomycota. For archaea, Methanobrevibacter was the most prevalent genus, present in 30% of samples. Several other archaeal genera were detected in lower abundance and frequency. Myriad associations were detected for fungi and archaea with diet, with each other, and with bacterial lineages. Methanobrevibacter and Candida were positively associated with diets high in carbohydrates, but negatively with diets high in amino acids, protein, and fatty acids. A previous study emphasized that bacterial population structure was associated primarily with long-term diet, but high Candida abundance was most strongly associated with the recent consumption of carbohydrates. Methobrevibacter abundance was associated with both long term and recent consumption of carbohydrates. These results confirm earlier targeted studies and provide a host of new associations to consider in modeling the effects of diet on the gut microbiome and human health.
Overview
The claims and statistics of this paper haven’t been checked yet.
Run the check — free, no account needed. It reads the open-access text and checks the sources it cites.
Integrity signals
Registry
Cites
Statistics
Figures
Verification
Claims the paper makes
The claims and statistics of this paper haven’t been checked yet.
Run the check — free, no account needed. It reads the open-access text and checks the sources it cites.
Claims other papers make about this one
Each is checked against this paper’s own text: does it say what the citing paper says it does?
The cited source says what the claim attributes to it.
In the citing paper
“In addition, members of the microbiome may drastically affect the growth of co-habitants (Hoffmann et al., 2013).”
From Iron at the Centre of Candida albicans Interactions (2018) · cites this paper as Hoffmann et al., 2013
In the citing paper
“carbohydrate consumption is associated with the proportion of the archaeon, Methanobrevibacter,46 in the intestinal microbiota.”
From Diet and the Intestinal Microbiome: Associations, Functions, and Implications for Health and Disease (2014) · cites this paper as [46]
In the citing paper
“Diet has also been associated with other types of microbes in the gut, such as archaea, fungi, and bacteriophage (Figure 2)45-47.”
From Diet and the Intestinal Microbiome: Associations, Functions, and Implications for Health and Disease (2014) · cites this paper as [46]
In the citing paper
“Infections with C. albicans can range from superficial mucosal and dermatological infections to life-threatening infections of the bloodstream and vital organs.”
From Molecular and genetic basis of azole antifungal resistance in the opportunistic pathogenic fungus Candida albicans (2020) · cites this paper as [1]
Self-check
Percentages, sums and reported differences re-computed from the paper’s own numbers.
The self-check needs the paper’s full text.
Citations
Cites
1 retracted
RETRACTED: Molecular Detection of Eukaryotes in a Single Human Stool Sample from Senegal
Hamad, I., Sokhna, C., Raoult, D., & Bittar, F. (2012) · PLoS ONE · doi:10.1371/journal.pone.0040888 · Cited by 99 · cited 1×
“We detected no fewer than 62 fungal genera and 184 species level OTUs, paralleling and extending a study of one subject, which also yielded a high number of fungal lineages [35].”
BackgroundRetractedQIIME allows analysis of high-throughput community sequencing data
Caporaso, J. G., Kuczynski, J., Stombaugh, J., Bittinger, K., Bushman, F. D., Costello, E. K., Fierer, N., Peña, A. G., Goodrich, J. K., Gordon, J. I., et al. (2010) · Nature Methods · doi:10.1038/nmeth.f.303 · Cited by 34,887 · cited 1×
“Sequences obtained were decoded and quality controlled using the QIIME pipeline [54].”
MethodSelf-citationMeasures of the Amount of Ecologic Association Between Species
Dice, L. R. (1945) · Ecology · doi:10.2307/1932409 · Cited by 12,187 · cited 1×
“Co-occurrence The Dice index [58] was used to determine the co-occurrence of genera across the entire dataset.”
MethodGardes, M., & Bruns, T. (1993) · Molecular Ecology · doi:10.1111/j.1365-294x.1993.tb00005.x · Cited by 10,249 · cited 1×
“Archaeal specific 16S rDNA primers and ITS1 fungal primers were adapted from the literature and used to amplify a rDNA 16S fragment; the final PCR cycling conditions were optimized to maximize specificity [51], [52], [38], [40],(Tables S5 and S6).”
MethodDiversity of the Human Intestinal Microbial Flora
Eckburg, P. B., Bik, E. M., Bernstein, C. N., Purdom, E., Dethlefsen, L., Sargent, M., Gill, S. R., Nelson, K. E., & Relman, D. A. (2005) · Science · doi:10.1126/science.1110591 · Cited by 7,913 · cited 1×
“Inspection of published work showed detection of Nitrosophaera in metagenomic sequences from one of two individuals studied by [25], and in both 16S and metagenomic sequences in another cohort [41].”
BackgroundHuman gut microbiome viewed across age and geography
Yatsunenko, T., Rey, F. E., Manary, M. J., Trehan, I., Dominguez-Bello, M. G., Contreras, M., Magris, M., Hidalgo, G., Baldassano, R. N., Anokhin, A. P., et al. (2012) · Nature · doi:10.1038/nature11053 · Cited by 7,815 · cited 4×
“Inspection of published work showed detection of Nitrosophaera in metagenomic sequences from one of two individuals studied by [25], and in both 16S and metagenomic sequences in another cohort [41].”
BackgroundInfluentialEnterotypes of the human gut microbiome
MetaHIT Consortium (additional members), Arumugam, M., Raes, J., Pelletier, E., Le Paslier, D., Yamada, T., Mende, D. R., Fernandes, G. R., Tap, J., Bruls, T., et al. (2011) · Nature · doi:10.1038/nature09944 · Cited by 7,548
The ade4 Package: Implementing the Duality Diagram for Ecologists
Dray, S., & Dufour, A. (2007) · Journal of Statistical Software · doi:10.18637/jss.v022.i04 · Cited by 6,740
Linking long-term dietary patterns with gut microbial enterotypes
Wu, G. D., Chen, J., Hoffmann, C., Bittinger, K., Chen, Y.-Y., Keilbaugh, S. A., Bewtra, M., Knights, D., Walters, W. A., Knight, R., et al. (2011) · Science · doi:10.1126/science.1208344 · Cited by 6,513 · cited 10×
“Bacterial 16S sequences data and diet data from [10] was used here.”
BackgroundMethodInfluentialThe Ribosomal Database Project: improved alignments and new tools for rRNA analysis
Cole, J. R., Wang, Q., Cardenas, E., Fish, J., Chai, B., Farris, R. J., Kulam-Syed-Mohideen, A. S., McGarrell, D. M., Marsh, T. L., Garrity, G. M., et al. (2008) · Nucleic Acids Research · doi:10.1093/nar/gkn879 · Cited by 4,873 · cited 1×
“Taxonomy was assigned to OTU representative sequences using the RDPclassifier [55] for archaeal sequences and BROCC [36] for fungal sequences.”
Method
Cited by
Sorted by citations
Items 801–815 of 815
The prebiotic inulin affects virulence factor expression in Candida albicans
Hickey, E., Pradhan, A., Ma, Q., Leaves, I., Philip-Brookes, A., Duggan, S., Harvey, J. A., Dambuza, I. M., Cherek, P., Yuecel, R., et al. (2026) · mBio · doi:10.1128/mbio.03851-25
“Mounting evidence suggests that fungi occupying intestinal niches respond to the host’s diet (80).”
The role of viruses in human infectious pathology
Dk, L., Akimkin, V. G., Vv, M., Letarov, A. V., & Alkhovsky, S. V. (2026) · Problems of Virology · doi:10.36233/0507-4088-403
Saalfrank, J., Rühlemann, M. C., Rausch, P., Hey, J. C., Rakotoarivelo, R. A., Rasamoelina, T., Rakotozandrindrainy, R., Randriamampionona, N., Schwarz, N. G., Razafindrakoto, R., et al. (2026) · Gut Microbes · doi:10.1080/19490976.2026.2701492
“31 Its elevated prevalence coincides with urban dietary shifts towards simple carbohydrates, 32 potentially facilitating fungal overgrowth, 33 but may also be driven by dietary yeast products present in highly processed foods and cheeses.”
Abady, E. M. A., AbuEl-Enien, H., Saleem, N. U. A., Albarari, S. S. A., Karam, K. N., Samadi, Y., Lohano, G., & Yasin, Z. (2026) · The Egyptian Journal of Internal Medicine · doi:10.1186/s43162-026-00678-z
“Higher HOMA-IR and fasting glucose levels are associated with increased Candida abundance and decreased fungal diversity [6, 7].”
The gut mycobiome and metabolic dysfunction in type 2 diabetes mellitus
Rathod, L., Tiwari, A., & Sarma, D. K. (2026) · Diabetes Research and Clinical Practice · doi:10.1016/j.diabres.2026.113456
From cooperation to collapse: the diet-microbiota-host gene triad in disease and aging
Bhattacharjee, S., & Mukhopadhyay, A. (2026) · Frontiers in Microbiomes · doi:10.3389/frmbi.2026.1872481
“Carbohydrate-rich patterns are associated with an increased relative abundance of Candida albicans , whereas higher protein and fat intake tends to deplete Candida and favor enrichment of Saccharomyces species (Hoffmann et al., 2013).”
Methanogens: vital but threatened members of the human microbiome?
Subrahmanian, A., Patel, A., Veerus, L., Domínguez-Bello, M. G., & Blaser, M. J. (2026) · Trends in Microbiology · doi:10.1016/j.tim.2026.08.008
Microbiome-Based Therapies: Phage Intervention
Hadi, J. L., Thaqi, A., Ammann, J., Mirzaei, M. K., & Deng, L. (2026) · Springer eBooks · doi:10.1007/978-3-032-26410-7_23
Composition and Function of the Human Gut Microbiome
Hitch, T. C. A., & Clavel, T. (2026) · Springer eBooks · doi:10.1007/978-3-032-26410-7_2
Oliveira, J. A. D. V. C., Moreira, M. I. S., Coelho, C. P. E. S., Belmok, A., de Cena, J. A., & Damé‐Teixeira, N. (2026) · Archives of Oral Biology · doi:10.1016/j.archoralbio.2026.106769
Ma, L., Wang, Z., & Mao, J. (2026) · Frontiers in Cellular and Infection Microbiology · doi:10.3389/fcimb.2026.1902754
“…phyla, with Candida and Saccharomyces commonly detected in the gastrointestinal tract and Malassezia , Aspergillus , and Cladosporium reported less consistently (Ghannoum et al., 2010; Hoffmann et al., 2013; Huseyin et al., 2017; Nash et al., 2017; Richard and Sokol, 2019; Zhang et al., 2022).”
InfluentialGut microbial metabolism of amino acids and its impact on enteric infections
Jaswal, K., & Behnsen, J. (2026) · Infection and Immunity · doi:10.1128/iai.00298-26
“In humans, C. albicans abundance is negatively associated with a protein-rich diet (37).”
Dietary exposures, microbial ecology and carcinogenesis: An integrated review
Kang, X., Soh, W. S., & Wong, S. H. (2026) · Best Practice & Research Clinical Gastroenterology · doi:10.1016/j.bpg.2026.102155
Multikingdom gut microbiome and immune aging: A host–microbial signaling perspective
Jiang, B., Liu, T., Duan, W., & Xue, Y. (2026) · Ageing Research Reviews · doi:10.1016/j.arr.2026.103414
Chmiela, M., Jaroniek, P., Manzaneque, J. C. R., Balcerczak, E., Brzeziński, M., Jeleń, A., Mani, S., Wosiak, A., & Gonciarz, W. (2026) · Cancer Metastasis Review · doi:10.1007/s10555-026-10388-1
Metadata
- Authors
- Hoffmann, C., Dollive, S., Grunberg, S., Chen, J., Li, H., Wu, G. D., Lewis, J. D., & Bushman, F. D.
- Affiliations
- Universidade Federal de Goiás (BR)
- University of Pennsylvania (US)
- Harvard University (US)
- Corresponding author
- Wu, Gary D.
- Lewis, James D.
- Bushman, Frederic D.
- Venue
- PLoS ONE
- Publisher
- Public Library of Science (PLoS)
- Published
- 2013-06-17
- Volume
- 8
- Issue
- 6
- Pages
- e66019
- ISSN
- 1932-6203 (ISSN-L)
- PMC
- PMC3684604
- OpenAlex
- W2110345840
- Cited by
- 808
- References
- 62
- Citations by year
- 2026: 38 · 2025: 56 · 2024: 73 · 2023: 59 · 2022: 86 · 2021: 85 · 2020: 87 · 2019: 76 · 2018: 60 · 2017: 62 · 2016: 36 · 2015: 45 · 2014: 40 · 2013: 4
- FWCI
- 18.65
- Type
- journal article
- Language
- en
- Open access
- gold
- doi.org
- Locations
- PLoS ONE (publishedVersion, cc-by)
- Europe PMC (PubMed Central) (publishedVersion, other-oa)
- PubMed Central (publishedVersion, cc-by)
- PubMed (publishedVersion)
- Digital Access to Scholarship at Harvard (DASH) (Harvard University) (submittedVersion, cc-by)
- DOAJ (DOAJ: Directory of Open Access Journals) (submittedVersion, cc-by-sa)
- Figshare (submittedVersion, cc-by)
- Funders
- Pennsylvania Department of Health
- University of Pennsylvania (UL1 RR024134)
- National Institutes of Health (and K24, DK050306)
- National Institute of Diabetes and Digestive and Kidney Diseases (K24DK078228, DK 089472, R01DK089472, UH2/3 DK083981, UH3DK083981, UH2DK083981, P30DK050306)
- National Center for Research Resources (UL1RR024134, S10RR024525)
- Topics
- Life Sciences › Biochemistry, Genetics and Molecular Biology › Molecular Biology › Gut microbiota and health
- Health Sciences › Medicine › Gastroenterology › Gastrointestinal motility and disorders
- Physical Sciences › Environmental Science › Ecology › Microbial Community Ecology and Physiology
- Keywords
- gut microbiota, archaea, fungi, diet, Methanobrevibacter, Candida, Ascomycota, carbohydrate intake, long-term diet, microbial co-occurrence, human health
- MeSH terms
- Archaea, Bacteria, Diet, Fungi, Humans, Intestines, Microbiota
About these checks
Registry, retraction, Cites and statistics results are computed, not judged, with one exception: a printed reference that no index lists is read once by a model before it counts as a citation error. Claims are extracted by a model and kept only when their quote appears verbatim in the text; each cited source is then checked, with a model’s help, for whether it says what the claim relies on. Those verdicts can be wrong — read the claim’s quote and the cited source before relying on one.
Statistics and arithmetic are recomputed, not judged.
Confidence bands are shown only for fields calibrated on our annotated test set. None is calibrated yet, so no band is shown.
What counts as a claim ›How we measure confidence ›How we check this ›
Are you an author, or do you see a problem with this page? Request a review
