

The DOI matches its Crossref record; 30 of the 31 references it cites were found in a registry or an index.
Yeast “Make-Accumulate-Consume” Life Strategy Evolved as a Multi-Step Process That Predates the Whole Genome Duplication
Open accessAbstract
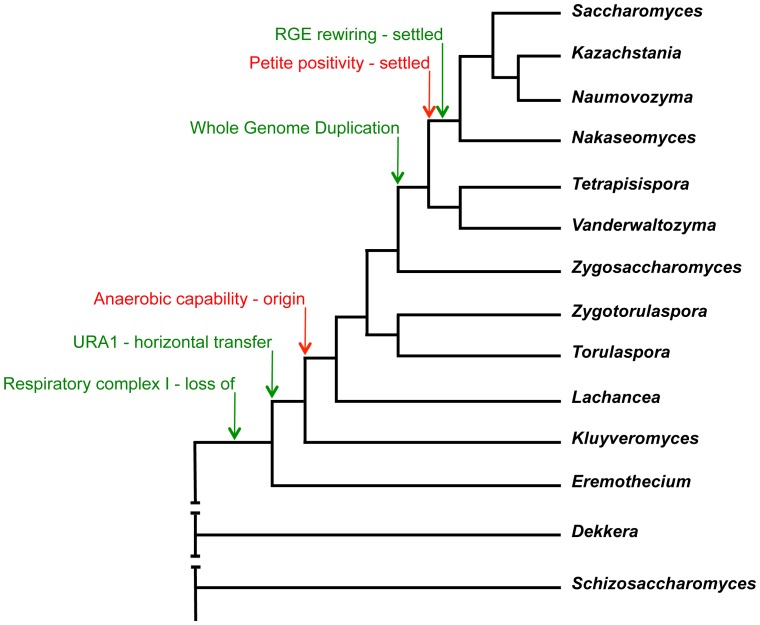
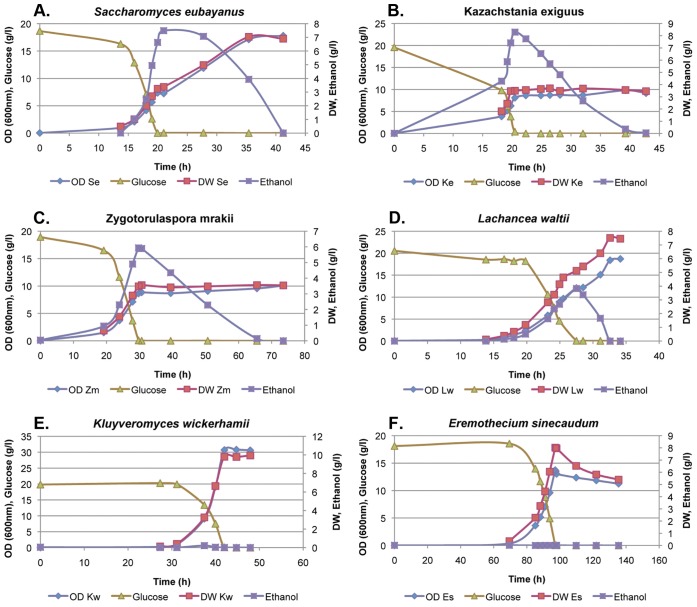
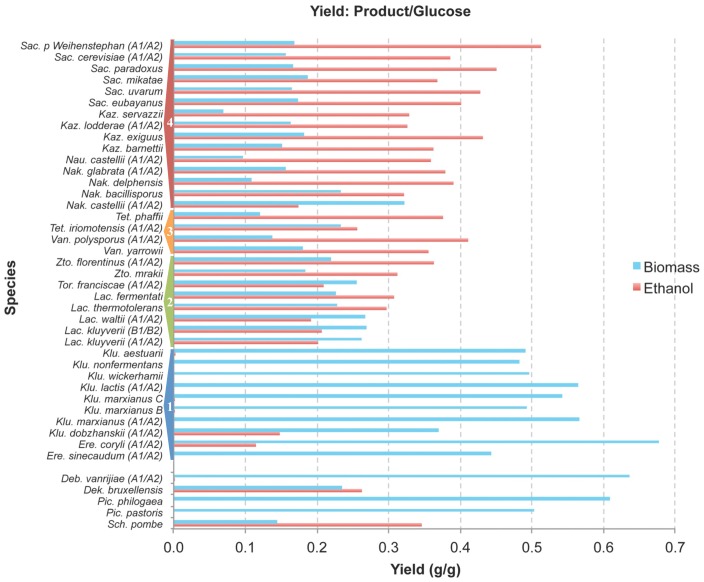
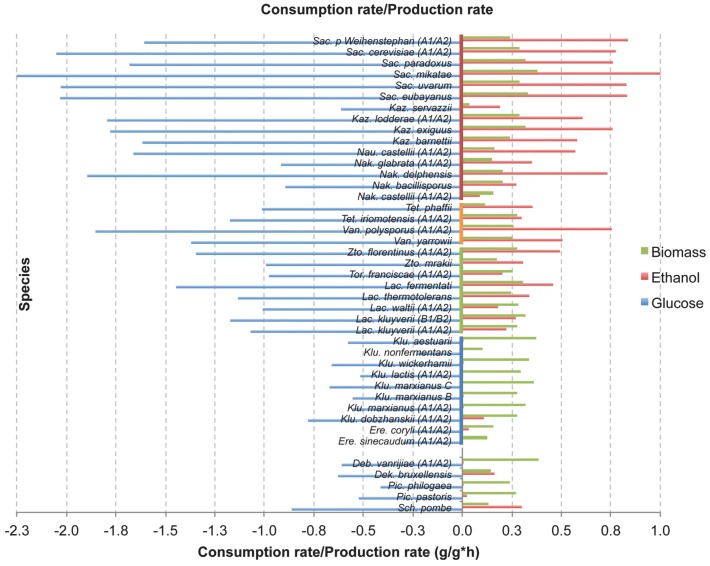
When fruits ripen, microbial communities start a fierce competition for the freely available fruit sugars. Three yeast lineages, including baker's yeast Saccharomyces cerevisiae, have independently developed the metabolic activity to convert simple sugars into ethanol even under fully aerobic conditions. This fermentation capacity, named Crabtree effect, reduces the cell-biomass production but provides in nature a tool to out-compete other microorganisms. Here, we analyzed over forty Saccharomycetaceae yeasts, covering over 200 million years of the evolutionary history, for their carbon metabolism. The experiments were done under strictly controlled and uniform conditions, which has not been done before. We show that the origin of Crabtree effect in Saccharomycetaceae predates the whole genome duplication and became a settled metabolic trait after the split of the S. cerevisiae and Kluyveromyces lineages, and coincided with the origin of modern fruit bearing plants. Our results suggest that ethanol fermentation evolved progressively, involving several successive molecular events that have gradually remodeled the yeast carbon metabolism. While some of the final evolutionary events, like gene duplications of glucose transporters and glycolytic enzymes, have been deduced, the earliest molecular events initiating Crabtree effect are still to be determined.
Overview
The claims and statistics of this paper haven’t been checked yet.
Run the check — free, no account needed. It reads the open-access text and checks the sources it cites.
Integrity signals
Registry
Cites
Statistics
Figures
Verification
Claims the paper makes
The claims and statistics of this paper haven’t been checked yet.
Run the check — free, no account needed. It reads the open-access text and checks the sources it cites.
Claims other papers make about this one
Each is checked against this paper’s own text: does it say what the citing paper says it does?
The cited source says what the claim attributes to it.
In the citing paper
“many aspects of its energy metabolism are relatively recent evolutionary adaptations to the predominantly fermentative lifestyle and are not typical of other yeast lineages”
From Mitochondrial retrograde control of transcription evolves with respiratory stress, metabolic adaptation, and virulence in budding yeasts (2026) · cites this paper as Hagman et al. 2013
The cited source says what the claim attributes to it.
In the citing paper
“S. cerevisiae belongs to yeasts exhibiting the Crabtree effect—preference for fermentative energy production in high glucose concentration even in the presence of oxygen (Hagman et al. 2013; Pfeiffer and Morley 2014; Williams et al. 2015; Nespolo et al. 2020).”
From Mitochondrial retrograde control of transcription evolves with respiratory stress, metabolic adaptation, and virulence in budding yeasts (2026) · cites this paper as Hagman et al. 2013
Self-check
Percentages, sums and reported differences re-computed from the paper’s own numbers.
The self-check needs the paper’s full text.
Citations
Cites
Goffeau, A., Barrell, B. G., Bussey, H., Davis, R. W., Dujon, B., Feldmann, H., Galibert, F., Hoheisel, J. D., Jacq, C., Johnston, M., et al. (1996) · Science · doi:10.1126/science.274.5287.546 · Cited by 4,423
Molecular evidence for an ancient duplication of the entire yeast genome
Wolfe, K. H., & Shields, D. C. (1997) · Nature · doi:10.1038/42711 · Cited by 1,785
Dujon, B., Sherman, D., Fischer, G., Durrens, P., Casaregola, S., Lafontaine, I., de Montigny, J., Marck, C., Neuvéglise, C., Talla, E., et al. (2004) · Nature · doi:10.1038/nature02579 · Cited by 1,623
Verduyn, C., Postma, E., Scheffers, W. A., & van Dijken, J. P. (1992) · Yeast · doi:10.1002/yea.320080703 · Cited by 1,510
Phylogenomics: The beginning of incongruence?
JEFFROY, O., BRINKMANN, H., DELSUC, F., & PHILIPPE, H. (2006) · Trends in Genetics · doi:10.1016/j.tig.2006.02.003 · Cited by 698
Kurtzman, C. P., & Robnett, C. J. (2003) · FEMS Yeast Research · doi:10.1016/s1567-1356(03)00012-6 · Cited by 652
How did Saccharomyces evolve to become a good brewer?
Piškur, J., Rozpędowska, E., Poláková, S., Merico, A., & Compagno, C. (2006) · Trends in Genetics · doi:10.1016/j.tig.2006.02.002 · Cited by 514
Self-citationComparative functional genomics of the fission yeasts
Rhind, N., Chen, Z., Yassour, M., Thompson, D. A., Haas, B. J., Habib, N., Wapinski, I., Roy, S., Lin, M. F., Heiman, D. I., et al. (2011) · Science · doi:10.1126/science.1203357 · Cited by 484
Resurrecting ancestral alcohol dehydrogenases from yeast
Thomson, J. M., Gaucher, E. A., Burgan, M. F., De Kee, D. W., Li, T., Aris, J. P., & Benner, S. A. (2005) · Nature Genetics · doi:10.1038/ng1553 · Cited by 341
Dujon, B. (2010) · Nature Reviews Genetics · doi:10.1038/nrg2811 · Cited by 330
Research works printed but not linked: 1
- Kurtzman CP, Fell JW, Boekhout T (2011) The Yeasts, a Taxanomic Study. London: Elsevier. 2080 p.
Cited by
Sorted by citations
Saccharomyces cerevisiae and its industrial applications
Parapouli, M., 1 Molecular Biology laboratory, D. O. B. A. A. T., Vasileiadi, A., Afendra, A.-S., Hatziloukas, E., 2 Genetics laboratory, D. O. B. A. A. T., & equally, #. T. T. A. C. (2020) · AIMS Microbiology · doi:10.3934/microbiol.2020001 · Cited by 685
An evolutionary perspective on the Crabtree effect
Pfeiffer, T., & Morley, A. (2014) · Frontiers in Molecular Biosciences · doi:10.3389/fmolb.2014.00017 · Cited by 318
Why, when, and how did yeast evolve alcoholic fermentation?
Dashko, S., Zhou, N., Compagno, C., & Piškur, J. (2014) · FEMS Yeast Research · doi:10.1111/1567-1364.12161 · Cited by 335
Self-citationTaming Wild Yeast: Potential of Conventional and Nonconventional Yeasts in Industrial Fermentations
Steensels, J., & Verstrepen, K. J. (2014) · Annual Review of Microbiology · doi:10.1146/annurev-micro-091213-113025 · Cited by 282
Kour, D., Rana, K. L., Yadav, N., Yadav, A. N., Singh, J., Rastegari, A. A., & Saxena, A. K. (2019) · Fungal biology · doi:10.1007/978-3-030-14846-1_1 · Cited by 196
Saccharomyces cerevisiae: a nomadic yeast with no niche?
Goddard, M. R., & Greig, D. (2015) · FEMS Yeast Research · doi:10.1093/femsyr/fov009 · Cited by 173
Sucrose andSaccharomyces cerevisiae: a relationship most sweet
Marques, W. L., Raghavendran, V., Stambuk, B. U., & Gombert, A. K. (2015) · FEMS Yeast Research · doi:10.1093/femsyr/fov107 · Cited by 160
Global rewiring of cellular metabolism renders Saccharomyces cerevisiae Crabtree negative
Dai, Z., Huang, M., Chen, Y., Siewers, V., & Nielsen, J. (2018) · Nature Communications · doi:10.1038/s41467-018-05409-9 · Cited by 139
Primary souring: A novel bacteria-free method for sour beer production
Osburn, K., Amaral, J., Metcalf, S., Nickens, D. G., Rogers, C. M., Sausen, C. W., Caputo, R., Miller, J., Li, H., Tennessen, J. M., et al. (2017) · Food Microbiology · doi:10.1016/j.fm.2017.09.007 · Cited by 133
Morrissey, J. P., Etschmann, M. M. W., Schrader, J., & de Billerbeck, G. M. (2014) · Yeast · doi:10.1002/yea.3054 · Cited by 131
Hagman, A., & Piškur, J. (2015) · PLoS ONE · doi:10.1371/journal.pone.0116942 · Cited by 130
Self-citationGenomics and the making of yeast biodiversity
Hittinger, C. T., Rokas, A., Bai, F., Boekhout, T., Gonçalves, P. M., Jeffries, T. W., Kominek, J., Lachance, M., Libkind, D., Rosa, C. A., et al. (2015) · Current Opinion in Genetics & Development · doi:10.1016/j.gde.2015.10.008 · Cited by 135
Papanikolaou, S., Rontou, M., Belka, A., Athenaki, M., Gardeli, C., Mallouchos, A., Kalantzi, O., Koutinas, A., Kookos, I. K., Zeng, A., et al. (2016) · Engineering in Life Sciences · doi:10.1002/elsc.201500191 · Cited by 123
Interactions between Kazachstania humilis Yeast Species and Lactic Acid Bacteria in Sourdough
Carbonetto, B., Nidelet, T., Guézenec, S., Perez, M., Segond, D., & Sicard, D. (2020) · Microorganisms · doi:10.3390/microorganisms8020240 · Cited by 119
Bioconversion of olive mill wastewater into high-added value products
Dourou, M., Kancelista, A., Juszczyk, P., Sarris, D., Bellou, S., Triantaphyllidou, I., Rywińska, A., Papanikolaou, S., & Aggelis, G. (2016) · Journal of Cleaner Production · doi:10.1016/j.jclepro.2016.08.133 · Cited by 117
Adaptations in metabolism and protein translation give rise to the Crabtree effect in yeast
Malina, C., Yu, R., Björkeroth, J., Kerkhoven, E. J., & Nielsen, J. (2021) · Proceedings of the National Academy of Sciences · doi:10.1073/pnas.2112836118 · Cited by 108
Chemical signaling and insect attraction is a conserved trait in yeasts
Becher, P. G., Hagman, A., Verschut, V., Chakraborty, A., Rozpędowska, E., Lebreton, S., Bengtsson, M., Flick, G., Witzgall, P., & Piškur, J. (2018) · Ecology and Evolution · doi:10.1002/ece3.3905 · Cited by 107
Self-citationGabaldón, T., & Carreté, L. (2016) · FEMS Yeast Research · doi:10.1093/femsyr/fov110 · Cited by 99
Analysis of the yeast short‐term Crabtree effect and its origin
Hagman, A., Säll, T., & Piškur, J. (2014) · FEBS Journal · doi:10.1111/febs.13019 · Cited by 97
Self-citationMitochondria-encoded genes contribute to evolution of heat and cold tolerance in yeast
Li, X., Peris, D., Hittinger, C. T., Sia, E. A., & Fay, J. C. (2019) · Science Advances · doi:10.1126/sciadv.aav1848 · Cited by 92
Bakery yeasts, a new model for studies in ecology and evolution
Carbonetto, B., Ramsayer, J., Nidelet, T., Legrand, J., & Sicard, D. (2018) · Yeast · doi:10.1002/yea.3350 · Cited by 87
Roos, J. D., & Vuyst, L. D. (2018) · Journal of the Science of Food and Agriculture · doi:10.1002/jsfa.9291 · Cited by 96
A polyploid admixed origin of beer yeasts derived from European and Asian wine populations
Fay, J. C., Liu, P., Ong, G. T., Dunham, M. J., Cromie, G. A., Jeffery, E. W., Ludlow, C. L., & Dudley, A. M. (2019) · PLoS Biology · doi:10.1371/journal.pbio.3000147 · Cited by 81
Synthetic biology for microbial production of lipid-based biofuels
d’Espaux, L., Mendez‐Perez, D., Li, R., & Keasling, J. D. (2015) · Current Opinion in Chemical Biology · doi:10.1016/j.cbpa.2015.09.009 · Cited by 81
Aerobic Glycolysis in the Brain: Warburg and Crabtree Contra Pasteur
Barros, L. F., Ruminot, I., Martín, A. S., Lerchundi, R., Fernández‐Moncada, I., & Baeza‐Lehnert, F. (2020) · Neurochemical Research · doi:10.1007/s11064-020-02964-w · Cited by 77
Gayevskiy, V., & Goddard, M. R. (2015) · Environmental Microbiology · doi:10.1111/1462-2920.13107 · Cited by 73
The Role of Fungi in Food Production and Processing
Pouris, J., Kolyva, F., Bratakou, S., Vogiatzi, C. A., Chaniotis, D. I., & Beloukas, A. I. (2024) · Applied Sciences · doi:10.3390/app14125046 · Cited by 77
Gonzalez, R., & Morales, P. (2021) · Microbial Biotechnology · doi:10.1111/1751-7915.13848 · Cited by 71
Rebnegger, C., Vos, T., Graf, A. B., Valli, M., Pronk, J. T., Daran-Lapujade, P. A. S., & Mattanovich, D. (2016) · Applied and Environmental Microbiology · doi:10.1128/aem.00638-16 · Cited by 69
Dupont, J., Dequin, S., Giraud, T., Tacon, F. L., Marsit, S., Ropars, J., Richard, F., & Selosse, M. (2017) · Microbiology Spectrum · doi:10.1128/microbiolspec.funk-0030-2016 · Cited by 67
Adachi, A., Koizumi, M., & Ohsumi, Y. (2017) · Journal of Biological Chemistry · doi:10.1074/jbc.m117.817510 · Cited by 64
Kluyveromyces marxianus as a host for heterologous protein synthesis
Gombert, A. K., Madeira, J. V., Cerdán, M. E., & González-Siso, M.-I. (2016) · Applied Microbiology and Biotechnology · doi:10.1007/s00253-016-7645-y · Cited by 63
The ecology of killer yeasts: Interference competition in natural habitats
Boynton, P. J. (2019) · Yeast · doi:10.1002/yea.3398 · Cited by 58
Madeira, J. V., & Gombert, A. K. (2018) · Biomass and Bioenergy · doi:10.1016/j.biombioe.2018.09.010 · Cited by 61
A single Gal4-like transcription factor activates the Crabtree effect in Komagataella phaffii
Ata, Ö., Rebnegger, C., Tatto, N. E., Valli, M., Mairinger, T., Hann, S., Steiger, M. G., Çalık, P., & Mattanovich, D. (2018) · Nature Communications · doi:10.1038/s41467-018-07430-4 · Cited by 61
Evolution of ecological dominance of yeast species in high-sugar environments
Williams, K. M., Liu, P., & Fay, J. C. (2015) · Evolution · doi:10.1111/evo.12707 · Cited by 59
Yeast Cellular Stress: Impacts on Bioethanol Production
Eardley, J., & Timson, D. J. (2020) · Fermentation · doi:10.3390/fermentation6040109 · Cited by 64
Neuronal control of astrocytic respiration through a variant of the Crabtree effect
Fernández‐Moncada, I., Ruminot, I., Robles-Maldonado, D., Alegría, K., Deitmer, J. W., & Barros, L. F. (2018) · Proceedings of the National Academy of Sciences · doi:10.1073/pnas.1716469115 · Cited by 56
Genome structure and dynamics of the yeast pathogen Candida glabrata
Ahmad, K. M., Kokošar, J., Guo, X., Gu, Z., Ishchuk, O. P., & Piškur, J. (2014) · FEMS Yeast Research · doi:10.1111/1567-1364.12145 · Cited by 57
Cellular Stress Impact on Yeast Activity in Biotechnological Processes—A Short Overview
Poştaru, M., Tucaliuc, A., Caşcaval, D., & Galaction, A. (2023) · Microorganisms · doi:10.3390/microorganisms11102522 · Cited by 61
Saccharomyces cerevisiae metabolism in ecological context
Jouhten, P., Ponomarova, O., Gonzalez, R., & Patil, K. R. (2016) · FEMS Yeast Research · doi:10.1093/femsyr/fow080 · Cited by 61
Phylogenetic Analysis Supports the Aerobic-Capacity Model for the Evolution of Endothermy
Nespolo, R. F., Solano‐Iguaran, J. J., & Bozinovic, F. (2016) · The American Naturalist · doi:10.1086/689598 · Cited by 55
Use of non-conventional yeast improves the wine aroma profile of Ribolla Gialla
Dashko, S., Zhou, N., Tinta, T., Sivilotti, P., Lemut, M. S., Trôst, K., Gamero, A., Boekhout, T., Butinar, L., Vrhovšek, U., et al. (2015) · Journal of Industrial Microbiology & Biotechnology · doi:10.1007/s10295-015-1620-y · Cited by 58
Alonso‐del‐Real, J., Pérez‐Torrado, R., Querol, A., & Barrio, E. (2019) · Environmental Microbiology · doi:10.1111/1462-2920.14536 · Cited by 53
Brion, C., Legrand, S., Peter, J., Caradec, C., Pflieger, D., Hou, J., Friedrich, A., Llorente, B., & Schacherer, J. (2017) · PLoS Genetics · doi:10.1371/journal.pgen.1006917 · Cited by 52
Jood, I., Hoff, J. W., & Setati, M. E. (2017) · World Journal of Microbiology and Biotechnology · doi:10.1007/s11274-017-2299-1 · Cited by 50
Zhou, N., Schifferdecker, A. J., Gamero, A., Compagno, C., Boekhout, T., Piškur, J., & Knecht, W. (2017) · International Journal of Food Microbiology · doi:10.1016/j.ijfoodmicro.2017.03.013 · Cited by 49
Self-citationHow Microbes Adapt to a Diversity of Food Niches
Papadimitriou, K., Pot, B., & Tsakalidou, E. (2015) · Current Opinion in Food Science · doi:10.1016/j.cofs.2015.01.001 · Cited by 47
Algae as a feedstock for bioethanol production: new entrance in biofuel world.
Chaudhary, L. C., Pradhan, P., Soni, N., Singh, P., & Tiwari, A. (2014) · International Journal of ChemTech Research · Cited by 47
Yeast metabolic innovations emerged via expanded metabolic network and gene positive selection
Lu, H., Li, F., Yuan, L., Domenzain, I., Yu, R., Wang, H., Li, G., Chen, Y., Ji, B., Kerkhoven, E. J., et al. (2021) · Molecular Systems Biology · doi:10.15252/msb.202110427 · Cited by 44
Genomics and biochemistry of Saccharomyces cerevisiae wine yeast strains
Eldarov, M. A., Kishkovskaya, S. A., Tanaschuk, T. N., & Mardanov, A. V. (2016) · Biochemistry (Moscow) · doi:10.1134/s0006297916130046 · Cited by 43
Vecchia, A. D., Rigotto, C., Staggemeier, R., Soliman, M. C., de Souza, F. G., Henzel, A., Santos, E. L., do Nascimento, C. A., de Quevedo, D. M., Fleck, J. D., et al. (2015) · Environmental Science and Pollution Research · doi:10.1007/s11356-015-4175-6 · Cited by 43
Convergent Evolution and the Origin of Complex Phenotypes in the Age of Systems Biology
Washburn, J. D., Bird, K. A., Conant, G. C., & Pires, J. C. (2016) · International Journal of Plant Sciences · doi:10.1086/686009 · Cited by 43
Candida glabrata : a deadly companion?
Bolotin‐Fukuhara, M., & Fairhead, C. (2014) · Yeast · doi:10.1002/yea.3019 · Cited by 42
Comparison of the growth of filamentous fungi and yeasts in lignocellulose-derived media
Cavka, A., & ̈nsson, L. J. J. (2014) · Biocatalysis and Agricultural Biotechnology · doi:10.1016/j.bcab.2014.04.003 · Cited by 42
Motlhanka, K., Zhou, N., & Lebani, K. (2018) · Beverages · doi:10.3390/beverages4020036 · Cited by 42
Brion, C., Pflieger, D., Souali‐Crespo, S., Friedrich, A., & Schacherer, J. (2016) · Molecular Biology of the Cell · doi:10.1091/mbc.e15-12-0816 · Cited by 39
Species richness influences wine ecosystem function through a dominant species
Boynton, P. J., & Greig, D. (2016) · Fungal ecology · doi:10.1016/j.funeco.2016.04.008 · Cited by 43
Metabolic flux analysis for metabolome data validation of naturally xylose-fermenting yeasts
Veras, H. C. T., Campos, C. G., do Nascimento, I. F., Abdelnur, P. V., de Almeida, J. R. M., & Parachin, N. S. (2019) · BMC Biotechnology · doi:10.1186/s12896-019-0548-0 · Cited by 41
Koukoumaki, D. I., Papanikolaou, S., Ioannou, Z., Mourtzinos, I., & Sarris, D. (2024) · Foods · doi:10.3390/foods13121892 · Cited by 37
Reverse Evolution of a Classic Gene Network in Yeast Offers a Competitive Advantage
Duan, S., Shi, J., Yin, Q., Zhang, R., Han, P.-J., Wang, Q., & Bai, F. (2019) · Current Biology · doi:10.1016/j.cub.2019.02.038 · Cited by 37
Zhou, N., Semumu, T., & Gamero, A. (2021) · Fermentation · doi:10.3390/fermentation7030102 · Cited by 39
Zhang, Y., Su, M., Wang, Z., Nielsen, J., & Liu, Z. (2022) · Synthetic and Systems Biotechnology · doi:10.1016/j.synbio.2022.06.004 · Cited by 35
Predicting microbial growth dynamics in response to nutrient availability
Nev, O. A., Lindsay, R. J., Jepson, A., Butt, L., Beardmore, R., & Gudelj, I. (2021) · PLoS Computational Biology · doi:10.1371/journal.pcbi.1008817 · Cited by 47
Parallel Concerted Evolution of Ribosomal Protein Genes in Fungi and Its Adaptive Significance
Mullis, A., Lu, Z., Zhan, Y., Wang, T., Rodríguez, J. S., Rajeh, A. A., Chatrath, A., & Lin, Z. (2019) · Molecular Biology and Evolution · doi:10.1093/molbev/msz229 · Cited by 31
Coevolution with bacteria drives the evolution of aerobic fermentation in Lachancea kluyveri
Zhou, N., Swamy, K. B. S., Leu, J., McDonald, M. J., Galafassi, S., Compagno, C., & Piškur, J. (2017) · PLoS ONE · doi:10.1371/journal.pone.0173318 · Cited by 31
Self-citationYeast and fruit fly mutual niche construction and antagonism against mould
Chakraborty, A., Mori, B. A., Rehermann, G., Hernández, A., Lemmen, J., Hagman, A., Khalil, S., Håkansson, S., Witzgall, P., & Becher, P. G. (2022) · Functional Ecology · doi:10.1111/1365-2435.14054 · Cited by 30
Self-citationGenetic Basis of Variation in Heat and Ethanol Tolerance in Saccharomyces cerevisiae
Riles, L., & Fay, J. C. (2018) · G3 Genes Genomes Genetics · doi:10.1534/g3.118.200566 · Cited by 29
Identification of major ADH genes in ethanol metabolism of Pichia pastoris
Karaoğlan, M., Erden‐Karaoğlan, F., Yılmaz, S., & İnan, M. (2019) · Yeast · doi:10.1002/yea.3443 · Cited by 29
Villarreal, P., Quintrel, P. A., Olivares‐Muñoz, S., Ruiz, J. J., Nespolo, R. F., & Cubillos, F. A. (2021) · Yeast · doi:10.1002/yea.3662 · Cited by 29
Dashko, S., Liu, P., Volk, H., Butinar, L., Piškur, J., & Fay, J. C. (2016) · Frontiers in Microbiology · doi:10.3389/fmicb.2016.00215 · Cited by 32
Duncan, J. D., Devillers, H., Camarasa, C., Setati, M. E., & Divol, B. (2024) · Food Microbiology · doi:10.1016/j.fm.2024.104624 · Cited by 28
Moktaduzzaman, M., Galafassi, S., Capusoni, C., Vigentini, I., Ling, Z., Piškur, J., & Compagno, C. (2015) · FEMS Yeast Research · doi:10.1093/femsyr/fou009 · Cited by 31
Self-citationWhole-Genome Duplication and Yeast’s Fruitful Way of Life
Escalera‐Fanjul, X., Quezada, H., Riego‐Ruiz, L. R., & González, A. (2018) · Trends in Genetics · doi:10.1016/j.tig.2018.09.008 · Cited by 28
Introduction to Carbon Metabolism in Yeast
Compagno, C., Dashko, S., & Piškur, J. (2014) · Springer eBooks · doi:10.1007/978-3-642-55013-3_1 · Cited by 26
Self-citationCandida milleri species reveals intraspecific genetic and metabolic polymorphisms
Vigentini, I., Antoniani, D., Roscini, L., Comasio, A., Galafassi, S., Picozzi, C., Corte, L., Compagno, C., Bello, F. D., Cardinali, G., et al. (2014) · Food Microbiology · doi:10.1016/j.fm.2014.02.011 · Cited by 25
Self-citationΤέρπου, Α., Dimopoulou, M., Belka, A., Καλλιθράκα, Σ., Nychas, G. E., & Papanikolaou, S. (2019) · Microorganisms · doi:10.3390/microorganisms7120666 · Cited by 25
Hotter, G., Mastora, C., Jung, M., Brüne, B., Carbonell, T., Josa‐Laorden, C., Pérez‐Calvo, J. I., Cruzado, J. M., Guiteras, R., & Solà, A. (2020) · Scientific Reports · doi:10.1038/s41598-020-72342-7 · Cited by 23
Optimization of energy production and central carbon metabolism in a non-respiring eukaryote
Alam, S., Gu, Y., Reichert, P., Bähler, J., & Oliferenko, S. (2023) · Current Biology · doi:10.1016/j.cub.2023.04.046 · Cited by 24
Ramakrishnan, V., Walker, G. A., Fan, Q., Ogawa, M., Luo, Y., Luong, P., Joseph, C. M. L., & Bisson, L. F. (2016) · Frontiers in Ecology and Evolution · doi:10.3389/fevo.2016.00137 · Cited by 26
Gesquiere, L. R., Ziegler, T. E., Chen, P. A., Epstein, K. A., Alberts, S. C., & Jeanne Altmann, A. (2014) · General and Comparative Endocrinology · doi:10.1016/j.ygcen.2014.04.021 · Cited by 25
Wittwer, A. E., Sicard, D., & Howell, K. S. (2022) · Trends in Microbiology · doi:10.1016/j.tim.2022.05.007 · Cited by 22
Palaiogeorgou, A. M., Papanikolaou, S., de Castro, A. M., Freire, D. M. G., Kookos, I. K., & Koutinas, A. (2018) · FEMS Microbiology Letters · doi:10.1093/femsle/fny280 · Cited by 22
Ma, Y., Peng, S., Mi, L., Li, M., Jiang, Z., & Wang, J. (2023) · Food Research International · doi:10.1016/j.foodres.2023.113638 · Cited by 21
Fermentative Microbes of Khadi, a Traditional Alcoholic Beverage of Botswana
Motlhanka, K., Lebani, K., Boekhout, T., & Zhou, N. (2020) · Fermentation · doi:10.3390/fermentation6020051 · Cited by 22
Genomic Adaptations of Saccharomyces Genus to Wine Niche
García‐Ríos, E., & Guillamón, J. M. (2022) · Microorganisms · doi:10.3390/microorganisms10091811 · Cited by 19
Naumovozyma castellii: an alternative model for budding yeast molecular biology
Andersson, A. K., & Cohn, M. (2016) · Yeast · doi:10.1002/yea.3218 · Cited by 19
Rangel-Porras, R. A., Díaz-Pérez, S. P., Mendoza-Hernández, J. M., Romo-Rodríguez, P., Alejandre‐Castañeda, V., Valle-Maldonado, M. I., Guzmán, J. C. T., Hernández, G. A. G., Campos‐García, J., Arnau, J., et al. (2019) · The Journal of Microbiology · doi:10.1007/s12275-019-8680-z · Cited by 19
Genome dynamics and evolution in yeasts: A long-term yeast-bacteria competition experiment
Zhou, N., Katz, M., Knecht, W., Compagno, C., & Piškur, J. (2018) · PLoS ONE · doi:10.1371/journal.pone.0194911 · Cited by 19
Self-citationMardones, W., Villarroel, C. A., Abarca, V., Urbina, K., Peña, T. A., Molinet, J., Nespolo, R. F., & Cubillos, F. A. (2021) · Microbial Biotechnology · doi:10.1111/1751-7915.13803 · Cited by 17
A phylogenetic analysis of macroevolutionary patterns in fermentative yeasts
Paleo‐López, R., Quintero‐Galvis, J. F., Solano‐Iguaran, J. J., Sánchez-Salazar, Á. M., Gaitán‐Espitía, J. D., & Nespolo, R. F. (2016) · Ecology and Evolution · doi:10.1002/ece3.2097 · Cited by 18
Maślanka, R., & Zadrąg‐Tęcza, R. (2019) · Journal of Cellular Physiology · doi:10.1002/jcp.28386 · Cited by 20
Mitochondrial genome diversity across the subphylum Saccharomycotina
Wolters, J. F., LaBella, A. L., Opulente, D. A., Rokas, A., & Hittinger, C. T. (2023) · Frontiers in Microbiology · doi:10.3389/fmicb.2023.1268944 · Cited by 17
Selection for Cell Yield Does Not Reduce Overflow Metabolism in Escherichia coli
Rabbers, I., Gottstein, W., Feist, A. M., Teusink, B., Bruggeman, F. J., & Bachmann, H. (2021) · Molecular Biology and Evolution · doi:10.1093/molbev/msab345 · Cited by 17
Damiani, C., Pescini, D., Colombo, R., Molinari, S., Alberghina, L., Vanoni, M., & Mauri, G. (2014) · Natural Computing · doi:10.1007/s11047-014-9439-4 · Cited by 15
Winans, M. J. (2022) · Fermentation · doi:10.3390/fermentation8020087 · Cited by 16
Piame, L. T., Kaktcham, P. M., Kouam, E. M. F., Techeu, U. D. F., Ngouénam, R. J., & Ngoufack, F. Z. (2022) · Heliyon · doi:10.1016/j.heliyon.2022.e10850 · Cited by 16
Vicente, J., Friedrich, A., Schacherer, J., Freel, K. C., Marquina, D., & Santos, A. (2025) · Molecular Ecology · doi:10.1111/mec.17667 · Cited by 16
Yeasts in Cacti and Tropical Fruit
Ganter, P. F., Morais, P. B., & Rosa, C. A. (2017) · Springer eBooks · doi:10.1007/978-3-319-62683-3_8 · Cited by 16
Guindal, A. M., Gonzalez, R., Tronchoni, J., Roodink, J. S., & Morales, P. (2023) · Food Microbiology · doi:10.1016/j.fm.2023.104282 · Cited by 15
Metadata
- Authors
- Hagman, A., Säll, T., Compagno, C., & Piskur, J.
- Affiliations
- Lund University (SE)
- University of Milan (IT)
- Corresponding author
- Hagman, Arne
- Säll, Torbjörn
- Compagno, Concetta
- Venue
- PLoS ONE
- Publisher
- Public Library of Science (PLoS)
- Published
- 2013-07-15
- Volume
- 8
- Issue
- 7
- Pages
- e68734
- ISSN
- 1932-6203 (ISSN-L)
- PMC
- PMC3711898
- OpenAlex
- W2158180844
- Cited by
- 219
- References
- 31
- Citations by year
- 2026: 10 · 2025: 15 · 2024: 12 · 2023: 20 · 2022: 17 · 2021: 29 · 2020: 12 · 2019: 21 · 2018: 17 · 2017: 16 · 2016: 17 · 2015: 15 · 2014: 18
- FWCI
- 7.47
- Type
- journal article
- Language
- en
- Open access
- gold
- doi.org
- Locations
- PLoS ONE (publishedVersion, cc-by)
- Europe PMC (PubMed Central) (publishedVersion, cc-by)
- PubMed Central (publishedVersion, cc-by)
- PubMed (publishedVersion)
- Archivio Istituzionale della Ricerca (Universita Degli Studi Di Milano) (submittedVersion, other-oa)
- DOAJ (DOAJ: Directory of Open Access Journals) (submittedVersion, cc-by-sa)
- Figshare (submittedVersion, cc-by)
- Lund University Publications (Lund University) (submittedVersion, other-oa)
- Funders
- Vetenskapsrådet
- Topics
- Life Sciences › Biochemistry, Genetics and Molecular Biology › Molecular Biology › Fungal and yeast genetics research
- Life Sciences › Immunology and Microbiology › Microbiology › Yeasts and Rust Fungi Studies
- Life Sciences › Biochemistry, Genetics and Molecular Biology › Molecular Biology › Microbial Metabolic Engineering and Bioproduction
- Keywords
- Crabtree effect, alcoholic fermentation, Saccharomyces cerevisiae, Saccharomycetaceae, yeast evolution, whole-genome duplication, carbon metabolism, glucose transporters, glycolytic enzymes, gene duplication, fruit ripening, microbial competition, fruit-bearing plants, aerobic fermentation
- MeSH terms
- Carbon, Saccharomycetales, Fermentation, Glucose, Genome, Fungal, Evolution, Molecular
About these checks
Registry, retraction, Cites and statistics results are computed, not judged, with one exception: a printed reference that no index lists is read once by a model before it counts as a citation error. Claims are extracted by a model and kept only when their quote appears verbatim in the text; each cited source is then checked, with a model’s help, for whether it says what the claim relies on. Those verdicts can be wrong — read the claim’s quote and the cited source before relying on one.
Statistics and arithmetic are recomputed, not judged.
Confidence bands are shown only for fields calibrated on our annotated test set. None is calibrated yet, so no band is shown.
What counts as a claim ›How we measure confidence ›How we check this ›
Are you an author, or do you see a problem with this page? Request a review
