

The DOI matches its Crossref record; 61 of the 61 references it cites were found in a registry or an index.
Time Course Analysis Reveals Gene-Specific Transcript and Protein Kinetics of Adaptation to Short-Term Aerobic Exercise Training in Human Skeletal Muscle
Open accessAbstract
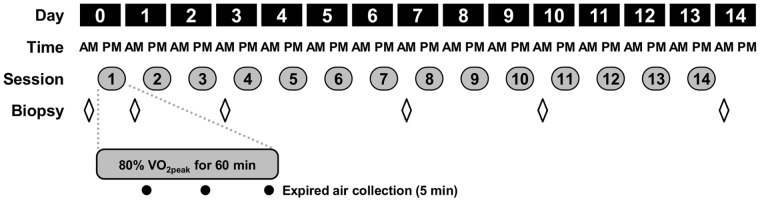
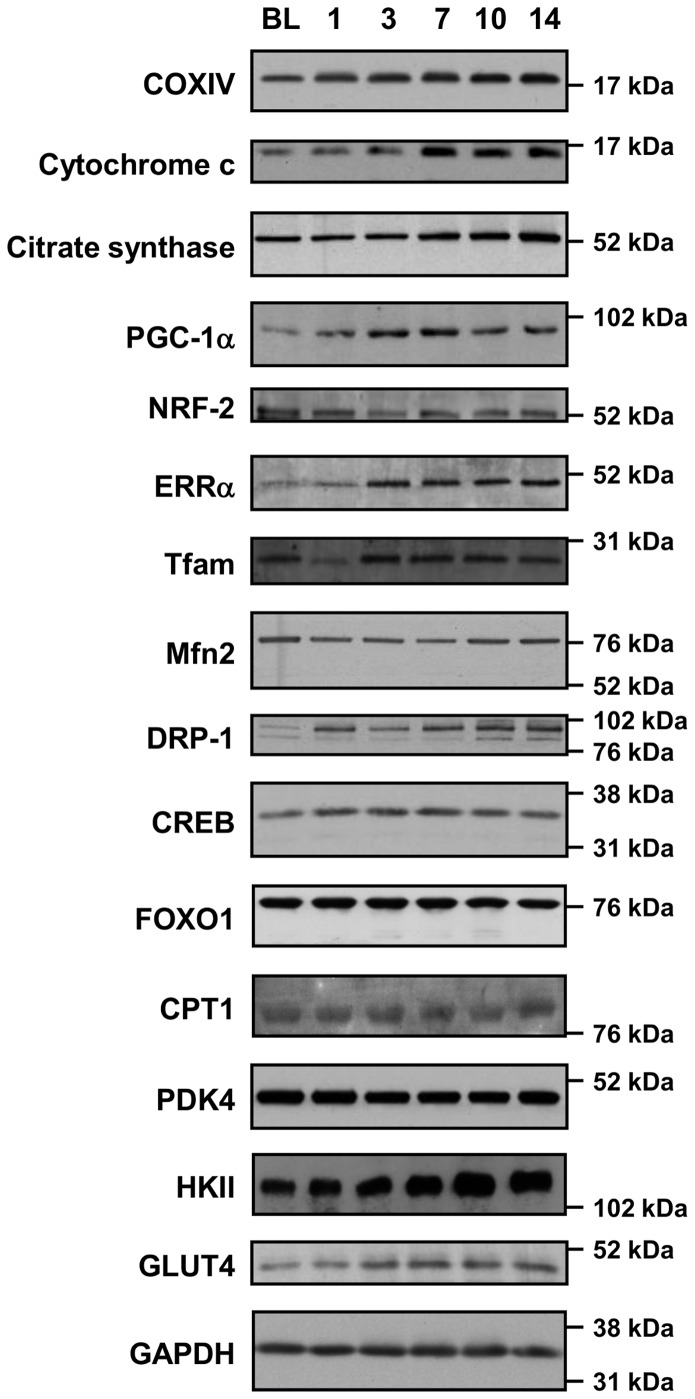
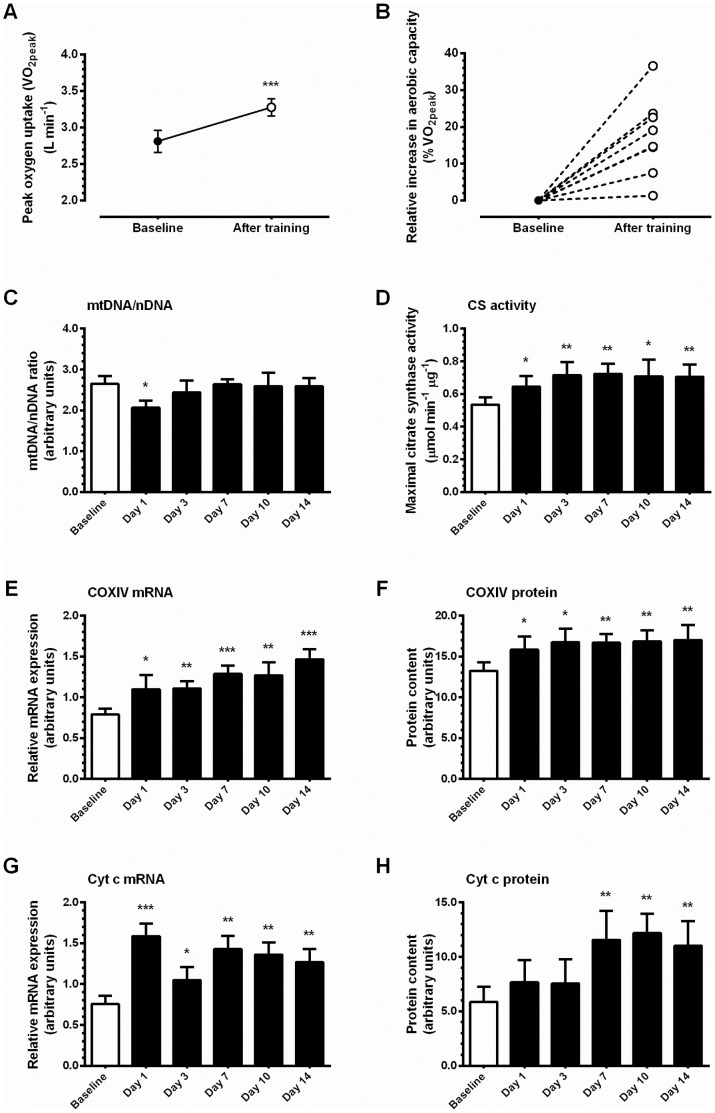
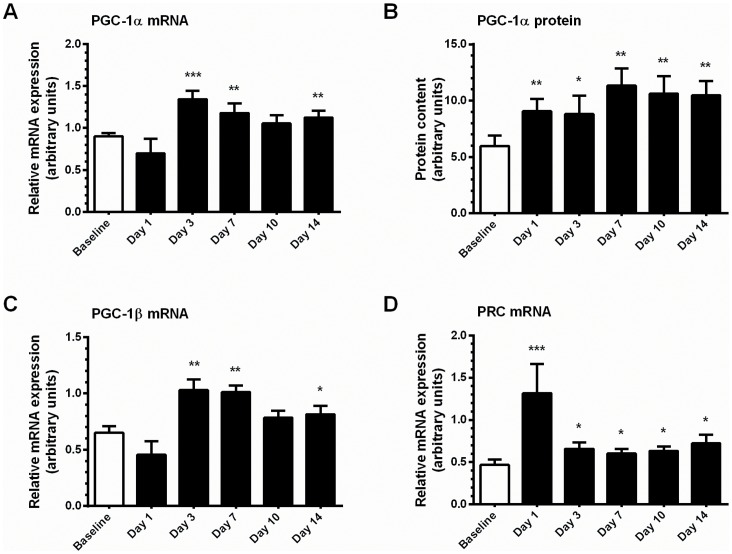
Repeated bouts of episodic myofibrillar contraction associated with exercise training are potent stimuli for physiological adaptation. However, the time course of adaptation and the continuity between alterations in mRNA expression and protein content are not well described in human skeletal muscle. Eight healthy, sedentary males cycled for 60 min at 80% of peak oxygen consumption (VO2peak) each day for fourteen consecutive days, resulting in an increase in VO2peak of 17.5±3.8%. Skeletal muscle biopsies were taken at baseline, and on the morning following (+16 h after exercise) the first, third, seventh, tenth and fourteenth training sessions. Markers of mitochondrial adaptation (Cyt c and COXIV expression, and citrate synthase activity) were increased within the first week of training, but the mtDNA/nDNA ratio was unchanged by two weeks of training. Accumulation of PGC-1α and ERRα protein during training suggests a regulatory role for these factors in adaptations of mitochondrial and metabolic gene expression. A subset of genes were transiently increased after one training session, but returned to baseline levels thereafter, which is supportive of the concept of transcriptional capacity being particularly sensitive to the onset of a new level of contractile activity. Thus, gene-specific temporal patterns of induction of mRNA expression and protein content are described. Our results illustrate the phenomenology of skeletal muscle plasticity and support the notion that transcript level adjustments, coupled to accumulation of encoded protein, underlie the modulation of skeletal muscle metabolism and phenotype by regular exercise.
Overview
The claims and statistics of this paper haven’t been checked yet.
Run the check — free, no account needed. It reads the open-access text and checks the sources it cites.
Integrity signals
Registry
Cites
Statistics
Figures
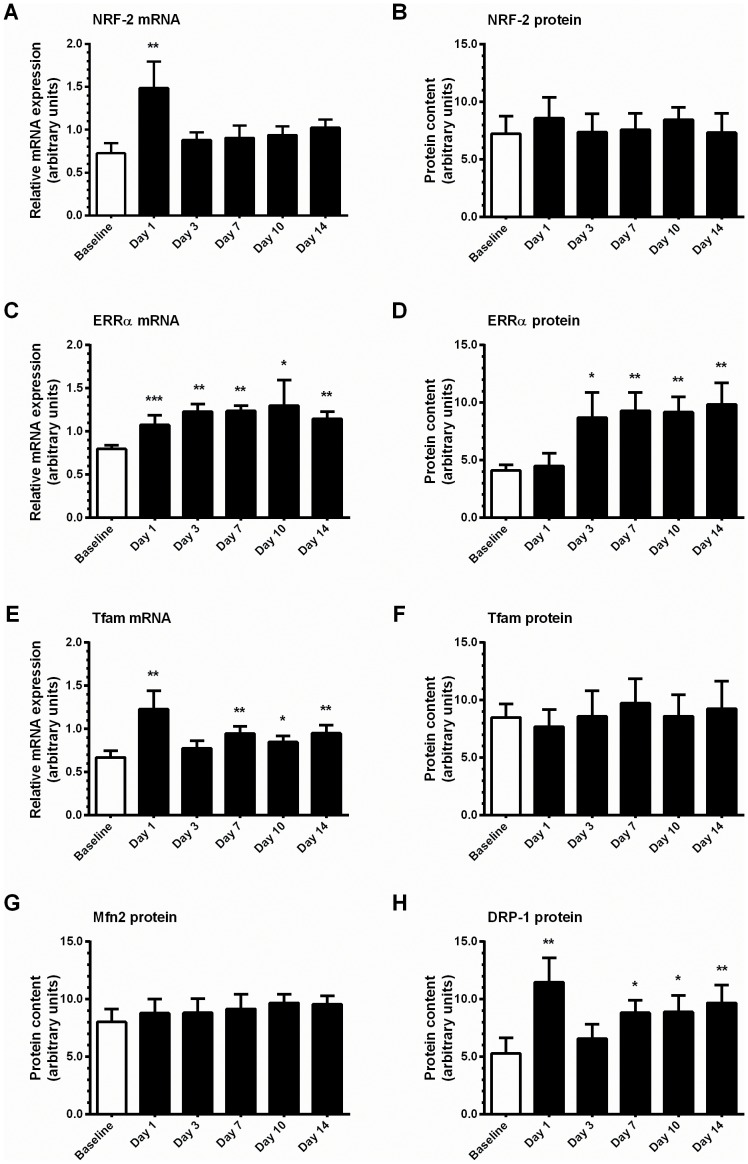
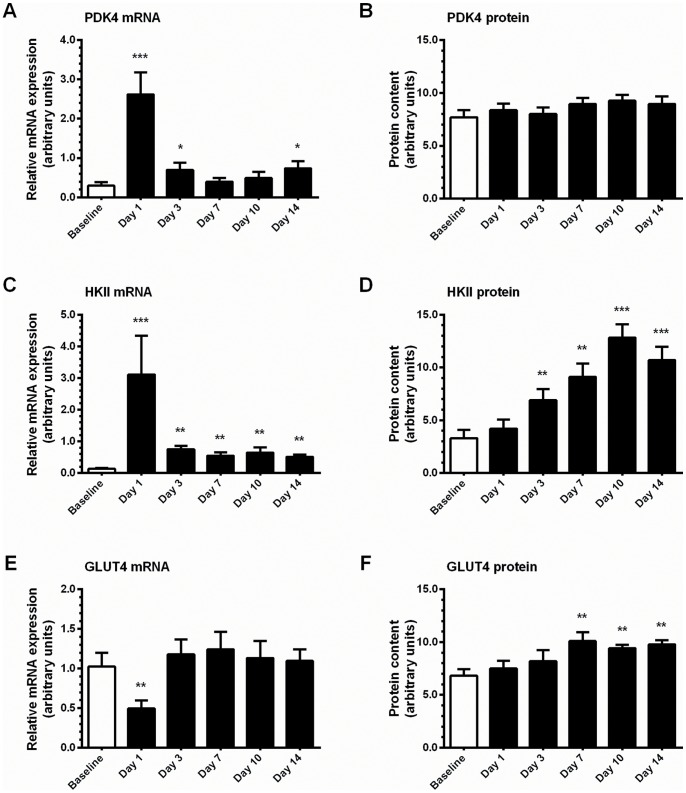
Verification
Claims the paper makes
The claims and statistics of this paper haven’t been checked yet.
Run the check — free, no account needed. It reads the open-access text and checks the sources it cites.
Claims other papers make about this one
Each is checked against this paper’s own text: does it say what the citing paper says it does?
The cited source says what the claim attributes to it.
In the citing paper
“If said exercise stimulus is repeated over time, chronic structural and functional changes occur [2,200].”
From Regulation of Energy Substrate Metabolism in Endurance Exercise (2021) · cites this paper as [200]
Self-check
Percentages, sums and reported differences re-computed from the paper’s own numbers.
The self-check needs the paper’s full text.
Citations
Cites
New methods for calculating metabolic rate with special reference to protein metabolism
Weir, J. B. D. V. (1949) · The Journal of Physiology · doi:10.1113/jphysiol.1949.sp004363 · Cited by 5,688
Wu, Z., Puigserver, P., Andersson, U., Zhang, C., Adelmant, G., Mootha, V., Troy, A., Cinti, S., Lowell, B., Scarpulla, R. C., et al. (1999) · Cell · doi:10.1016/s0092-8674(00)80611-x · Cited by 4,139
Metabolic control through the PGC-1 family of transcription coactivators
Lin, J., Handschin, C., & Spiegelman, B. M. (2005) · Cell Metabolism · doi:10.1016/j.cmet.2005.05.004 · Cited by 2,130 · cited 1×
“Altering the transcriptional activity of PGC-1a affects physiological responses that equip the cell to meet the energy demands of a changing environment, including augmentation of mitochondrial biogenesis, cellular respiration rates and substrate utilization [20].”
BackgroundExercise Metabolism and the Molecular Regulation of Skeletal Muscle Adaptation
Egan, B., & Zierath, J. R. (2013) · Cell Metabolism · doi:10.1016/j.cmet.2012.12.012 · Cited by 2,084
Self-citationAdaptations of skeletal muscle to endurance exercise and their metabolic consequences
Holloszy, J. O., & Coyle, E. F. (1984) · Journal of Applied Physiology · doi:10.1152/jappl.1984.56.4.831 · Cited by 1,985
Biochemical Adaptations in Muscle
Holloszy, J. O. (1967) · Journal of Biological Chemistry · doi:10.1016/s0021-9258(18)96046-1 · Cited by 1,517
Biomarkers of mitochondrial content in skeletal muscle of healthy young human subjects
Larsen, S., Nielsen, J., Hansen, C. N., Nielsen, L. B., Wibrand, F., Stride, N., Schroder, H. D., Boushel, R., Helge, J. W., Dela, F., et al. (2012) · The Journal of Physiology · doi:10.1113/jphysiol.2012.230185 · Cited by 1,180 · cited 2×
“Instead CS activity and markers of OXPHOS activity such as complex V protein content are considered more informative [35].”
BackgroundExercise induces transient transcriptional activation of the PGC‐1α gene in human skeletal muscle
Pilegaard, H., Saltin, B., & Neufer, P. D. (2003) · The Journal of Physiology · doi:10.1113/jphysiol.2002.034850 · Cited by 885
Reversible Ponceau staining as a loading control alternative to actin in Western blots
Romero-Calvo, I., Ocón, B., Martínez-Moya, P., Suárez, M. D., Zarzuelo, A., Martínez-Augustin, O., & de Medina, F. S. (2010) · Analytical Biochemistry · doi:10.1016/j.ab.2010.02.036 · Cited by 771
Molecular and cellular adaptation of muscle in response to exercise: perspectives of various models
Booth, F. W., & Thomason, D. B. (1991) · Physiological Reviews · doi:10.1152/physrev.1991.71.2.541 · Cited by 703
Cited by
Sorted by citations
Physiological adaptations to interval training and the role of exercise intensity
MacInnis, M. J., & Gibala, M. J. (2017) · The Journal of Physiology · doi:10.1113/jp273196 · Cited by 1,124
Gillen, J. B., Martin, B. J., MacInnis, M. J., Skelly, L. E., Tarnopolsky, M. A., & Gibala, M. J. (2016) · PLoS ONE · doi:10.1371/journal.pone.0154075 · Cited by 363
“[49], who examined the time course of increased mitochondrial content in response to 14 sessions of endurance training, these data seem to imply that much of the increase in mitochondrial content occurs relatively early in response to training.”
BackgroundFyfe, J. J., Bishop, D. J., & Stepto, N. K. (2014) · Sports Medicine · doi:10.1007/s40279-014-0162-1 · Cited by 347
Mitochondrial Dysfunction in Heart Failure With Preserved Ejection Fraction
Kumar, A. A., Kelly, D. P., & Chirinos, J. A. (2019) · Circulation · doi:10.1161/circulationaha.118.036259 · Cited by 297
Enhanced Respiratory Chain Supercomplex Formation in Response to Exercise in Human Skeletal Muscle
Greggio, C., Jha, P., Kulkarni, S. S., Lagarrigue, S., Broskey, N. T., Boutant, M., Wang, X., Conde Alonso, S., Ofori, E., Auwerx, J., et al. (2017) · Cell Metabolism · doi:10.1016/j.cmet.2016.11.004 · Cited by 286
Metadata
- Authors
- Egan, B., O’Connor, P. L., Zierath, J. R., & O’Gorman, D. J.
- Affiliations
- University College Dublin (IE)
- Dublin City University (IE)
- Karolinska Institutet (SE)
- Corresponding author
- O’Gorman, Donal J.
- Venue
- PLoS ONE
- Publisher
- Public Library of Science (PLoS)
- Published
- 2013-09-12
- Volume
- 8
- Issue
- 9
- Pages
- e74098
- ISSN
- 1932-6203 (ISSN-L)
- PMC
- PMC3771935
- OpenAlex
- W2020255277
- Cited by
- 120
- References
- 61
- Citations by year
- 2026: 4 · 2025: 3 · 2024: 7 · 2023: 11 · 2022: 10 · 2021: 14 · 2020: 7 · 2019: 12 · 2018: 10 · 2017: 8 · 2016: 20 · 2015: 8 · 2014: 5 · 2013: 1
- FWCI
- 26.79
- Type
- journal article
- Language
- en
- Open access
- gold
- doi.org
- Locations
- PLoS ONE (publishedVersion, cc-by)
- Europe PMC (PubMed Central) (publishedVersion, cc-by)
- PubMed Central (publishedVersion, cc-by)
- PubMed (publishedVersion)
- DOAJ (DOAJ: Directory of Open Access Journals) (submittedVersion, cc-by-sa)
- Funders
- Irish Research Council for Science, Engineering and Technology
- Dublin City University
- European Foundation for the Study of Diabetes
- Irish Research Council
- Karolinska Institutet
- Novo Nordisk
- Vetenskapsrådet
- Topics
- Health Sciences › Medicine › Physiology (medical) › Cardiovascular and exercise physiology
- Life Sciences › Biochemistry, Genetics and Molecular Biology › Molecular Biology › Muscle Physiology and Disorders
- Health Sciences › Medicine › Physiology (medical) › Adipose Tissue and Metabolism
- Keywords
- aerobic exercise training, skeletal muscle adaptation, temporal gene expression, mRNA expression, protein content, mitochondrial biogenesis, PGC-1α, estrogen-related receptor alpha, citrate synthase, cytochrome c, cytochrome c oxidase subunit IV, mtDNA/nDNA ratio, skeletal muscle plasticity, human skeletal muscle
- MeSH terms
- Peroxisome Proliferator-Activated Receptor Gamma Coactivator 1-alpha, Adaptation, Physiological, Adult, Carrier Proteins, Gene Expression Regulation, Humans, Kinetics, Male, Mitochondria, Oxygen Consumption, Time Factors, Transcription Factors, Transcription, Genetic, Biomarkers, Exercise, RNA-Binding Proteins, Muscle, Skeletal, Proteome, Young Adult, Transcriptome
About these checks
Registry, retraction, Cites and statistics results are computed, not judged, with one exception: a printed reference that no index lists is read once by a model before it counts as a citation error. Claims are extracted by a model and kept only when their quote appears verbatim in the text; each cited source is then checked, with a model’s help, for whether it says what the claim relies on. Those verdicts can be wrong — read the claim’s quote and the cited source before relying on one.
Statistics and arithmetic are recomputed, not judged.
Confidence bands are shown only for fields calibrated on our annotated test set. None is calibrated yet, so no band is shown.
What counts as a claim ›How we measure confidence ›How we check this ›
Are you an author, or do you see a problem with this page? Request a review
