

A Method for Selectively Enriching Microbial DNA from Contaminating Vertebrate Host DNA
Open accessThe DOI matches its Crossref record; 48 of the 48 references it cites were found in a registry or an index.
Abstract
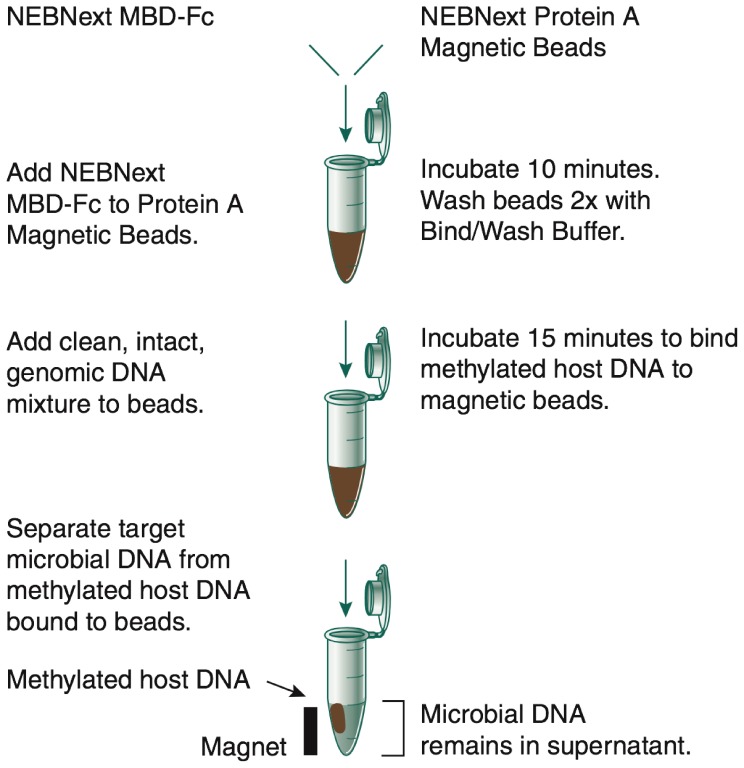
DNA samples derived from vertebrate skin, bodily cavities and body fluids contain both host and microbial DNA; the latter often present as a minor component. Consequently, DNA sequencing of a microbiome sample frequently yields reads originating from the microbe(s) of interest, but with a vast excess of host genome-derived reads. In this study, we used a methyl-CpG binding domain (MBD) to separate methylated host DNA from microbial DNA based on differences in CpG methylation density. MBD fused to the Fc region of a human antibody (MBD-Fc) binds strongly to protein A paramagnetic beads, forming an effective one-step enrichment complex that was used to remove human or fish host DNA from bacterial and protistan DNA for subsequent sequencing and analysis. We report enrichment of DNA samples from human saliva, human blood, a mock malaria-infected blood sample and a black molly fish. When reads were mapped to reference genomes, sequence reads aligning to host genomes decreased 50-fold, while bacterial and Plasmodium DNA sequences reads increased 8-11.5-fold. The Shannon-Wiener diversity index was calculated for 149 bacterial species in saliva before and after enrichment. Unenriched saliva had an index of 4.72, while the enriched sample had an index of 4.80. The similarity of these indices demonstrates that bacterial species diversity and relative phylotype abundance remain conserved in enriched samples. Enrichment using the MBD-Fc method holds promise for targeted microbiome sequence analysis across a broad range of sample types.
Overview
The claims and statistics of this paper haven’t been checked yet.
Free: it reads the open-access text and checks the first 5 claims that cite a source we can check. Create a free account to check every claim.
Integrity signals
Registry
Cites
Statistics
Figures


Verification
Claims the paper makes
The claims and statistics of this paper haven’t been checked yet.
Free: it reads the open-access text and checks the first 5 claims that cite a source we can check. Create a free account to check every claim.
Claims other papers make about this one
Each is checked against this paper’s own text: does it say what the citing paper says it does?
The source backs part of the claim, not all of it — or backs it for a different population, condition or comparison.
In the citing paper
“Limited enrichment in the 3–5 times range can be achieved with the use of antibodies against methylated human host DNA98, which enriches microbial reads owing to the lack of methylated DNA in most pathogen genomes.”
From Clinical metagenomics (2019) · cites this paper as [98]
Experimental — accuracy not yet measured
Self-check
Percentages, sums and reported differences re-computed from the paper’s own numbers.
The self-check needs the paper’s full text.
Citations
Cites
Fast gapped-read alignment with Bowtie 2
Langmead, B., & Salzberg, S. L. (2012) · Nature Methods · doi:10.1038/nmeth.1923 · Cited by 56,400
BLAST+: architecture and applications
Camacho, C., Coulouris, G., Avagyan, V., Ma, N., Papadopoulos, J., Bealer, K., & Madden, T. L. (2009) · BMC Bioinformatics · doi:10.1186/1471-2105-10-421 · Cited by 22,074 · cited 2×
“In a recent report, analysis of the human salivary microbiome using WGS sequencing revealed a large fraction of the BLASTN [36]”
BackgroundInfluentialChanges of Intestinal Functions in Liver Cirrhosis
Fukui, H., & Wiest, R. (2016) · Inflammatory Intestinal Diseases · doi:10.1159/000444436 · Cited by 6,808
Host-Bacterial Mutualism in the Human Intestine
Bäckhed, F., Ley, R. E., Sonnenburg, J. L., Peterson, D. A., & Gordon, J. I. (2005) · Science · doi:10.1126/science.1104816 · Cited by 5,277
Finishing the euchromatic sequence of the human genome
International Human Genome Sequencing Consortium (2004) · Nature · doi:10.1038/nature03001 · Cited by 4,971
Human DNA methylomes at base resolution show widespread epigenomic differences
Lister, R., Pelizzola, M., Dowen, R. H., Hawkins, R. D., Hon, G., Tonti-Filippini, J., Nery, J. R., Lee, L., Ye, Z., Ngo, Q.-M., et al. (2009) · Nature · doi:10.1038/nature08514 · Cited by 4,673
Meyer, F., Paarmann, D., D'Souza, M., Olson, R., Glass, E., Kubal, M., Paczian, T., Rodriguez, A., Stevens, R., Wilke, A., et al. (2008) · BMC Bioinformatics · doi:10.1186/1471-2105-9-386 · Cited by 3,565 · cited 8×
“Performed bioinformatics analyses: BWL GRF VTS. Performed MG-RAST and assembly analysis: VTS. Supervised the project: MAQ TD SP.”
InfluentialA framework for human microbiome research
The Human Microbiome Project Consortium (2012) · Nature · doi:10.1038/nature11209 · Cited by 2,650
The NIH Human Microbiome Project
The NIH HMP Working Group, Peterson, J., Garges, S., Giovanni, M., McInnes, P., Wang, L., Schloss, J. A., Bonazzi, V., McEwen, J. E., Wetterstrand, K. A., et al. (2009) · Genome Research · doi:10.1101/gr.096651.109 · Cited by 2,066
Metagenomic microbial community profiling using unique clade-specific marker genes
Segata, N., Waldron, L., Ballarini, A., Narasimhan, V., Jousson, O., & Huttenhower, C. (2012) · Nature Methods · doi:10.1038/nmeth.2066 · Cited by 1,776 · cited 12×
“(CSV) Table S4 List of bacterial species reported by MG-RAST and MetaPhlAn for black molly experiment.”
BackgroundMethodInfluential
Research works printed but not linked: 1
- Lister R, Pelizzola M, Dowen RH, Hawkins RD, Hon G, et al (2009) NIH Public Access. Nature 462: 315– 322 10.1038/nature08514.Human 19829295 PMC2857523 · doi:10.1038/nature08514.human
Cited by
Chiu, C. Y., & Miller, S. A. (2019) · Nature Reviews Genetics · doi:10.1038/s41576-019-0113-7 · Cited by 1,620
Nanopore metagenomics enables rapid clinical diagnosis of bacterial lower respiratory infection
Charalampous, T., Kay, G. L., Richardson, H., Aydin, A., Baldan, R., Jeanes, C., Rae, D., Grundy, S., Turner, D. J., Wain, J., et al. (2019) · Nature Biotechnology · doi:10.1038/s41587-019-0156-5 · Cited by 681
A new view of the fish gut microbiome: advances from next-generation sequencing
Ghanbari, M., Kneifel, W., & Domig, K. J. (2015) · Aquaculture · doi:10.1016/j.aquaculture.2015.06.033 · Cited by 669
Gut Microbiota, Inflammation, and Colorectal Cancer
Brennan, C. A., & Garrett, W. S. (2016) · Annual Review of Microbiology · doi:10.1146/annurev-micro-102215-095513 · Cited by 578
Insights into the human oral microbiome
Verma, D., Garg, P. K., & Dubey, A. K. (2018) · Archives of Microbiology · doi:10.1007/s00203-018-1505-3 · Cited by 541
“NEBNext® Microbiome DNA Enrichment Kit (New England Biolabs, England) also relies on selective binding of methylated human DNA and leaving bacterial DNA behind in a sample that can be later captured by magnetic beads (Feehery et al. 2013).”
Background
Metadata
- Authors
- Feehery, G. R., Yigit, E., Oyola, S. O., Langhorst, B. W., Schmidt, V. T., Stewart, F. J., Dimalanta, E. T., Amaral-Zettler, L. A., Davis, T., Quail, M. A., & Pradhan, S.
- Affiliations
- New England Biolabs (United States) (US)
- Wellcome Sanger Institute (GB)
- Marine Biological Laboratory (US)
- Corresponding author
- Pradhan, Sriharsa
- ORCID
- Venue
- PLoS ONE
- Publisher
- Public Library of Science (PLoS)
- Published
- 2013-10-28
- Volume
- 8
- Issue
- 10
- Pages
- e76096
- ISSN
- 1932-6203 (ISSN-L)
- PMC
- PMC3810253
- OpenAlex
- W2109424333
- Cited by
- 212
- References
- 48
- Citations by year
- 2026: 9 · 2025: 19 · 2024: 23 · 2023: 8 · 2022: 26 · 2021: 22 · 2020: 24 · 2019: 21 · 2018: 19 · 2017: 13 · 2016: 15 · 2015: 5 · 2014: 7
- FWCI
- 4.03
- Type
- journal article
- Language
- en
- Open access
- gold
- doi.org
- Locations
- PLoS ONE (publishedVersion, cc-by)
- Europe PMC (PubMed Central) (publishedVersion, cc-by)
- PubMed Central (publishedVersion, cc-by)
- PubMed (publishedVersion)
- Open Access Server of the Woods Hole Scientific Community (Woods Hole Scientific Community) (submittedVersion, cc-by)
- DOAJ (DOAJ: Directory of Open Access Journals) (submittedVersion, cc-by-sa)
- Figshare (submittedVersion, cc-by)
- Funders
- Brown University
- Wellcome Trust (079355/Z/06/Z, 098051)
- University of Oxford
- Topics
- Life Sciences › Biochemistry, Genetics and Molecular Biology › Molecular Biology › Genomics and Phylogenetic Studies
- Physical Sciences › Environmental Science › Ecology › Microbial Community Ecology and Physiology
- Life Sciences › Biochemistry, Genetics and Molecular Biology › Molecular Biology › Gut microbiota and health
- Keywords
- host DNA removal, methyl-CpG binding domain, CpG methylation, paramagnetic beads, saliva microbiota, blood microbiome, malaria, Plasmodium, bacterial diversity, microbiome sequencing
- MeSH terms
- Animals, DNA, DNA-Binding Proteins, DNA, Bacterial, Humans, Immunoglobulin Fc Fragments, Protein Binding, Recombinant Fusion Proteins, Saliva, Vertebrates, DNA, Protozoan, CpG Islands, DNA Methylation, DNA Contamination
About these checks
Registry, retraction, Cites and statistics results are computed, not judged, with one exception: a printed reference that no index lists is read once by a model before it counts as a citation error. Claims are extracted by a model and kept only when their quote appears verbatim in the text; each cited source is then checked, with a model’s help, for whether it says what the claim relies on. Those verdicts can be wrong — read the claim’s quote and the cited source before relying on one.
Statistics and arithmetic are recomputed, not judged.
Confidence bands are shown only for fields calibrated on our annotated test set. None is calibrated yet, so no band is shown.
What counts as a claim ›How we measure confidence ›How we check this ›
Are you an author, or do you see a problem with this page? Request a review
Data sources
Bibliographic data: Semantic Scholar, OpenAlex, Crossref.
Contains information from the Semantic Scholar Academic Graph Datasets, made available under the ODC Attribution License (ODC-BY 1.0).
Semantic Scholar’s data is described in: Kinney, R., et al. (2023). The Semantic Scholar Open Data Platform. arXiv:2301.10140.
