Cited by 105Memory and Neural MechanismsNeural dynamics and brain functionNeuroscience and Neuropharmacology Research

The DOI matches its Crossref record; 60 of the 61 references it cites were found in a registry or an index.

Directional Theta Coherence in Prefrontal Cortical to Amygdalo-Hippocampal Pathways Signals Fear Extinction

Open access

Abstract

Theta oscillations are considered crucial mechanisms in neuronal communication across brain areas, required for consolidation and retrieval of fear memories. One form of inhibitory learning allowing adaptive control of fear memory is extinction, a deficit of which leads to maladaptive fear expression potentially leading to anxiety disorders. Behavioral responses after extinction training are thought to reflect a balance of recall from extinction memory and initial fear memory traces. Therefore, we hypothesized that the initial fear memory circuits impact behavioral fear after extinction, and more specifically, that the dynamics of theta synchrony in these pathways signal the individual fear response. Simultaneous multi-channel local field and unit recordings were obtained from the infralimbic prefrontal cortex, the hippocampal CA1 and the lateral amygdala in mice. Data revealed that the pattern of theta coherence and directionality within and across regions correlated with individual behavioral responses. Upon conditioned freezing, units were phase-locked to synchronized theta oscillations in these pathways, characterizing states of fear memory retrieval. When the conditioned stimulus evoked no fear during extinction recall, theta interactions were directional with prefrontal cortical spike firing leading hippocampal and amygdalar theta oscillations. These results indicate that the directional dynamics of theta-entrained activity across these areas guide changes in appraisal of threatening stimuli during fear memory and extinction retrieval. Given that exposure therapy involves procedures and pathways similar to those during extinction of conditioned fear, one therapeutical extension might be useful that imposes artificial theta activity to prefrontal cortical-amygdalo-hippocampal pathways that mimics the directionality signaling successful extinction recall.

Overview

The claims and statistics of this paper haven’t been checked yet.

Run the check — free, no account needed. It reads the open-access text and checks the sources it cites.

A few free checks a day · papers already verified open instantly · results are public

Integrity signals

Registry

Crossref · 10.1371/journal.pone.0077707

Cites

60 of 60 references verified0 citation errors · 0 not checkable

Statistics

Figures

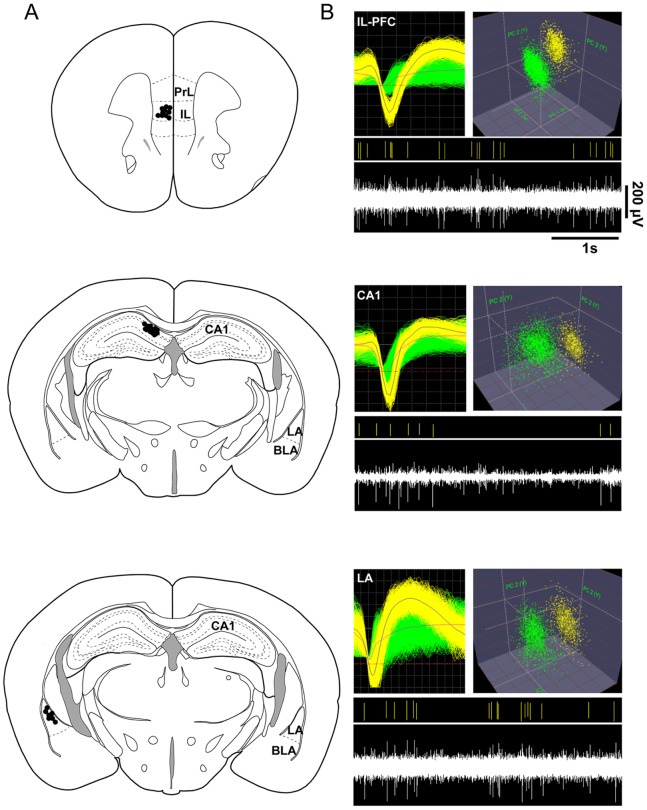
Figure 1 Verification of recording sites and isolation of single units. (A) Schematic representation of electrode locations in the infralimbic prefrontal cortex (IL-PFC), hippocampal CA1, and lateral amygdala (LA). Black dots mark recordings sites. (B) Representative examples of extracellular waveform sorting in IL-PFC, CA1 and LA. The top images show superimposed waveforms of two simultaneously recorded neurons and cluster analysis, formed in three-dimensional space after applying principal component analysis. The bottom images display the sorted unit (yellow) of the continuous signal below. PrL, prelimbic region of mPFC; IL, infralimbic region of mPFC; BLA, basolateral amygdala; LA lateral amygdala.
Figure 1 Verification of recording sites and isolation of single units. (A) Schematic representation of electrode locations in the infralimbic prefrontal cortex (IL-PFC), hippocampal CA1, and lateral amygdala (LA). Black dots mark recordings sites. (B) Representative examples of extracellular waveform sorting in IL-PFC, CA1 and LA. The top images show superimposed waveforms of two simultaneously recorded neurons and cluster analysis, formed in three-dimensional space after applying principal component analysis. The bottom images display the sorted unit (yellow) of the continuous signal below. PrL, prelimbic region of mPFC; IL, infralimbic region of mPFC; BLA, basolateral amygdala; LA lateral amygdala.CC BY · PubMed Central
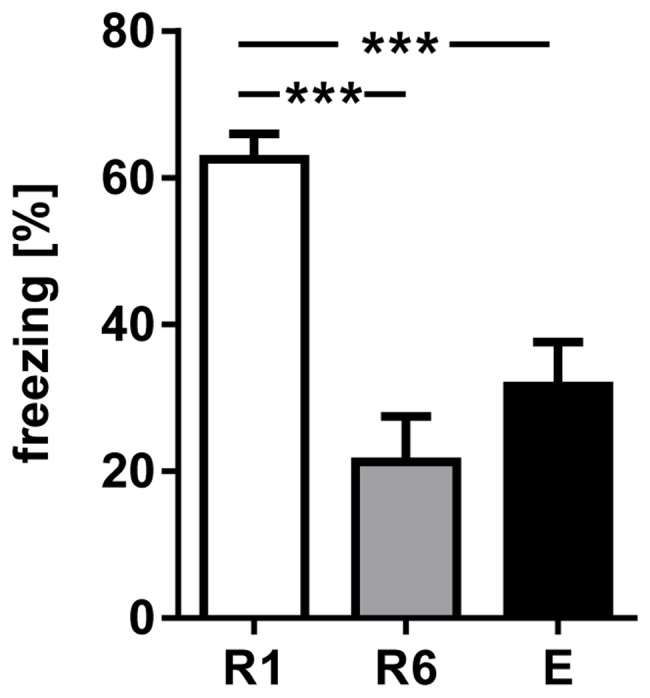
Figure 2 Conditioned freezing in response to presentation of the first CS+ during R1, R6 and E. The fraction of time spent freezing during presentation of the first CS+ significantly declined comparing R1 with R6 and E. Values are mean±SEM; asterisks indicate the significance level: ***,p<0.001 [One-way ANOVA (F2,36 = 16.03, p<0.001), followed by Tukey’s post hoc test for multiple comparison], n = 13.
Figure 2 Conditioned freezing in response to presentation of the first CS+ during R1, R6 and E. The fraction of time spent freezing during presentation of the first CS+ significantly declined comparing R1 with R6 and E. Values are mean±SEM; asterisks indicate the significance level: ***,p<0.001 [One-way ANOVA (F2,36 = 16.03, p<0.001), followed by Tukey’s post hoc test for multiple comparison], n = 13.CC BY · PubMed Central
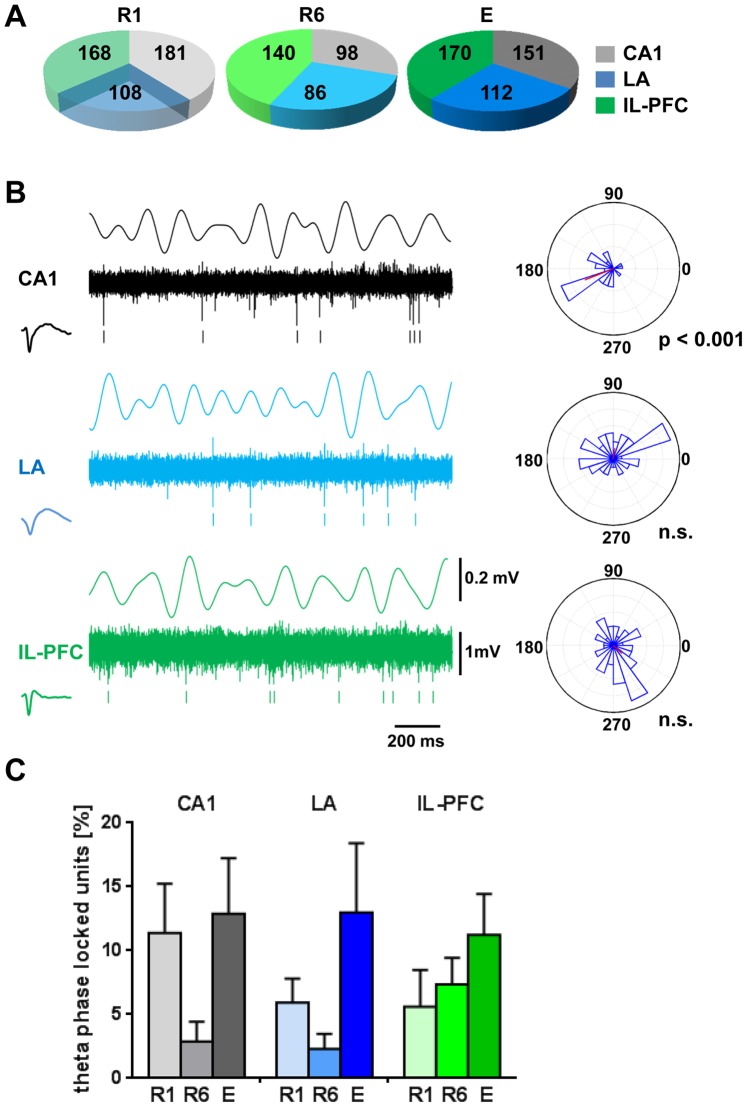
Figure 3 Unit activity in relation to theta LFP during 1CS+ presentation at fear memory retrieval (R1), after extinction training (R6) and at recall of fear extinction (E). Pie chart in (A) summarizes the total number of identified neurons in CA1, LA and IL-PFC. (B) Representative example from one animal during CS+ presentation. The figure shows simultaneously recorded local field potentials (LFP, theta filtered 4–8 Hz), multiple-unit activity (continuous signal), timestamps of identified units in CA1 (black), LA (blue) and IL-PFC (green), and the circular phase distribution of the identified units in relation to the theta filtered LFP (4–8 Hz). Rayleigh’s test for circular uniformity revealed significant phase locking of the CA1 unit to the intrinsic CA1 filtered LFP. (C) Percentage of cells with significant phase-locked unit firing to theta in each structure during R1, R6 and E. One-way ANOVA revealed no significant effect of session (R1, R6 and E) for CA1, LA and IL-PFC phase-locked neurons. n.s., non-significant phase locking (Rayleigh’s test for circular uniformity).
Figure 3 Unit activity in relation to theta LFP during 1CS+ presentation at fear memory retrieval (R1), after extinction training (R6) and at recall of fear extinction (E). Pie chart in (A) summarizes the total number of identified neurons in CA1, LA and IL-PFC. (B) Representative example from one animal during CS+ presentation. The figure shows simultaneously recorded local field potentials (LFP, theta filtered 4–8 Hz), multiple-unit activity (continuous signal), timestamps of identified units in CA1 (black), LA (blue) and IL-PFC (green), and the circular phase distribution of the identified units in relation to the theta filtered LFP (4–8 Hz). Rayleigh’s test for circular uniformity revealed significant phase locking of the CA1 unit to the intrinsic CA1 filtered LFP. (C) Percentage of cells with significant phase-locked unit firing to theta in each structure during R1, R6 and E. One-way ANOVA revealed no significant effect of session (R1, R6 and E) for CA1, LA and IL-PFC phase-locked neurons. n.s., non-significant phase locking (Rayleigh’s test for circular uniformity).CC BY · PubMed Central
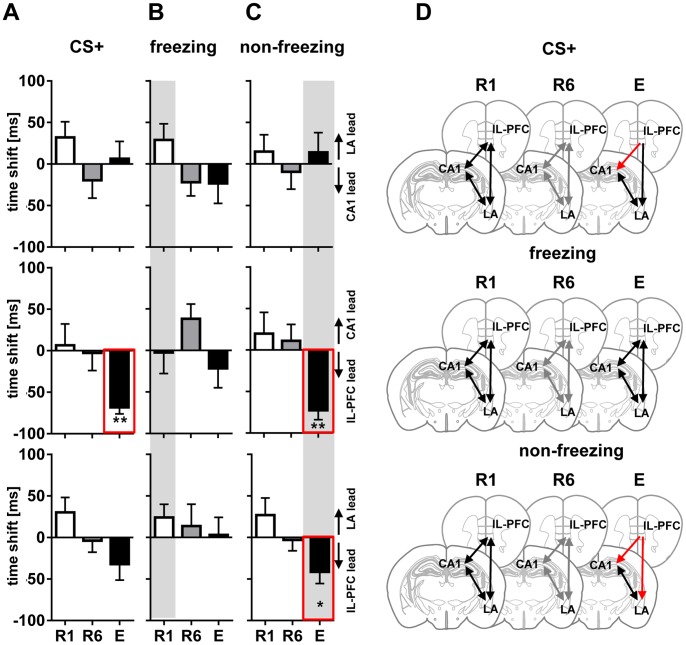
Figure 4 Directional phase locking of LFP theta. Directional phase locking of LFP theta at first CS+ presentation (A), freezing (B) and non-freezing (C) stages during fear memory retrieval (R1; open diagrams), extinction training (R6; grey diagrams), and recall of fear extinction (E; black diagrams). Diagrams indicate time shifts of correlation peaks of LFP theta amplitudes obtained between all possible pairs of recorded regions (CA1/LA, upper row; CA1/IL-PFC, middle; LA/IL-PFC, bottom) as an indicator of the directionality (lagging or leading) between oscillating signals. Positive values indicate that interactions are driven by one region, and negative values indicate that the interaction is driven by the respective other. Note lack of theta directionality during entire CS+ at R1 and R6, and during freezing at R1, R6 and E. Whereas IL-PFC leads to CA1 during CS+ and IL-PFC leads to CA1 and LA during non-freezing at E (highlighted by red lines in A and C). Further single unit phase-locking analyses (see Figure 4 and 5) focused on R1 freezing (B) and non-freezing in E (C) representing the most prominent changes of fear behavior expression as well as LFP based shifts in directionality (grey background). (D) Schematic representation of LFP theta directionality in CA1, LA, and IL-PFC during entire CS+ presentation, freezing and non-freezing at R1, R6 and E. Black and grey lines with two arrowheads indicate high theta synchrony (with no significant time lead or lag), red lines indicate theta directionality. Values are mean±SEM; asterisks indicate the significance level revealed by Wilcoxon Signed Rank test : *,p<0.05; **,p<0.01.
Figure 4 Directional phase locking of LFP theta. Directional phase locking of LFP theta at first CS+ presentation (A), freezing (B) and non-freezing (C) stages during fear memory retrieval (R1; open diagrams), extinction training (R6; grey diagrams), and recall of fear extinction (E; black diagrams). Diagrams indicate time shifts of correlation peaks of LFP theta amplitudes obtained between all possible pairs of recorded regions (CA1/LA, upper row; CA1/IL-PFC, middle; LA/IL-PFC, bottom) as an indicator of the directionality (lagging or leading) between oscillating signals. Positive values indicate that interactions are driven by one region, and negative values indicate that the interaction is driven by the respective other. Note lack of theta directionality during entire CS+ at R1 and R6, and during freezing at R1, R6 and E. Whereas IL-PFC leads to CA1 during CS+ and IL-PFC leads to CA1 and LA during non-freezing at E (highlighted by red lines in A and C). Further single unit phase-locking analyses (see Figure 4 and 5) focused on R1 freezing (B) and non-freezing in E (C) representing the most prominent changes of fear behavior expression as well as LFP based shifts in directionality (grey background). (D) Schematic representation of LFP theta directionality in CA1, LA, and IL-PFC during entire CS+ presentation, freezing and non-freezing at R1, R6 and E. Black and grey lines with two arrowheads indicate high theta synchrony (with no significant time lead or lag), red lines indicate theta directionality. Values are mean±SEM; asterisks indicate the significance level revealed by Wilcoxon Signed Rank test : *,p<0.05; **,p<0.01.CC BY · PubMed Central
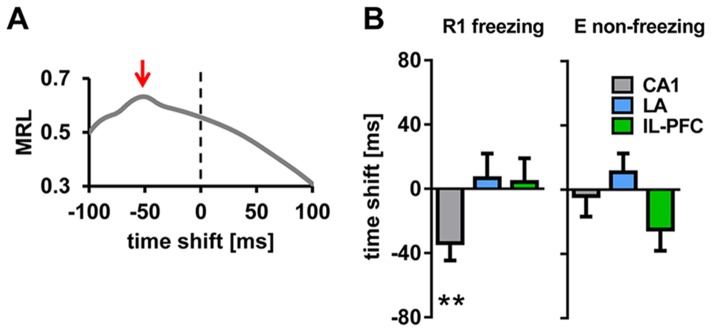
Figure 5 Phase-locking of single unit activity to LFP theta within regions. (A) Representative example of directional unit phase-locking analysis of an identified CA1 unit (same unit as in Figure 3B). Mean resultant length vector (MRL), computed by assigning each spike of the unit to the simultaneously recorded LFP theta phase, calculated for 50 different temporal offsets (4 ms bin, from −100 ms to +100 ms), indicate phase lead of the unit by approximately −50 ms (marked by red arrow). (B) Summary of phase-locking analysis of units and LFP theta in CA1, LA and IL-PFC, during freezing in R1 and non-freezing in E. Plotted are mean time shifts between unit activity and the LFP theta phase calculated from MRLs in each area. Note phase locking of units to LFP theta within each region during both freezing and non-freezing, except for phase lead of CA1 units (−33.9±10.7 ms during R1 freezing). Values are mean±SEM; asterisks indicate the significance level revealed by Wilcoxon Signed Rank test : **,p<0.01.
Figure 5 Phase-locking of single unit activity to LFP theta within regions. (A) Representative example of directional unit phase-locking analysis of an identified CA1 unit (same unit as in Figure 3B). Mean resultant length vector (MRL), computed by assigning each spike of the unit to the simultaneously recorded LFP theta phase, calculated for 50 different temporal offsets (4 ms bin, from −100 ms to +100 ms), indicate phase lead of the unit by approximately −50 ms (marked by red arrow). (B) Summary of phase-locking analysis of units and LFP theta in CA1, LA and IL-PFC, during freezing in R1 and non-freezing in E. Plotted are mean time shifts between unit activity and the LFP theta phase calculated from MRLs in each area. Note phase locking of units to LFP theta within each region during both freezing and non-freezing, except for phase lead of CA1 units (−33.9±10.7 ms during R1 freezing). Values are mean±SEM; asterisks indicate the significance level revealed by Wilcoxon Signed Rank test : **,p<0.01.CC BY · PubMed Central
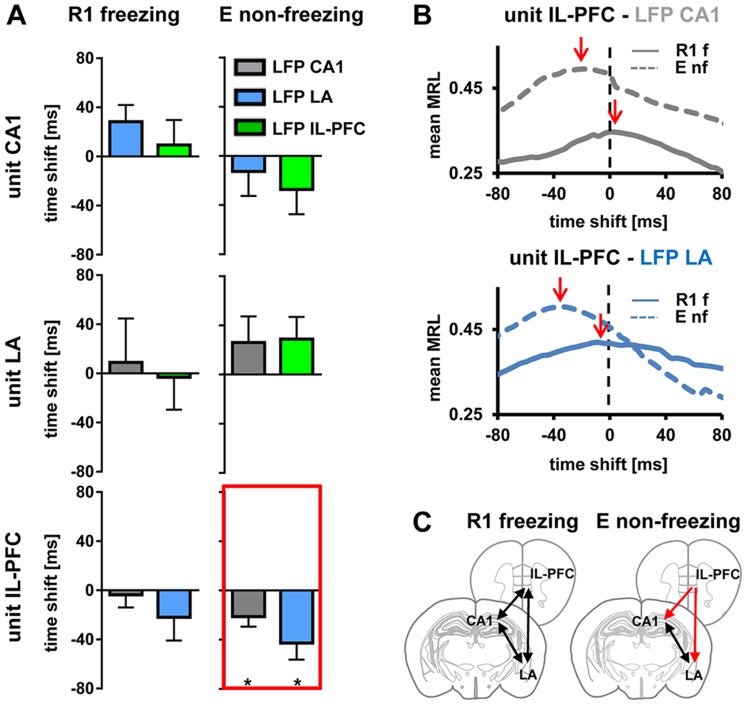
Figure 6 Phase-locking of single unit activity to LFP theta across regions. (A) Summary of phase-locking analysis during freezing states in R1 and non-freezing states in E. Each identified unit in CA1 (upper), LA (middle), and IL-PFC (bottom) was assigned a LFP theta phase recorded simultaneously in the other two brain areas (grey, blue, green diagrams indicating LFP in CA1, LA, IL-PFC, respectively). Plotted are mean time shifts between unit activity and the LFP theta phase calculated from MRLs in each area. Note the significant lead of unit activity in IL-PFC related to the LFP theta in CA1 and LA during non-freezing in E (highlighted by red lines). (B) Mean MRL of all identified theta phase-locked IL-PFC units during freezing in R1 and non-freezing in E related to LFP theta oscillations recorded simultaneously in CA1 (upper diagram) and LA (lower diagram). Note the peak MRL (indicated by red arrows) signaling a lead of unit activity in IL-PFC related to LFP theta in CA1 and LA during non-freezing in E. (C) Schematic representation of phase-locking of single unit activity to LFP theta across regions, during freezing at R1 and non-freezing at E. Black lines with two arrowheads indicate high theta synchrony (with no significant time lead or lag), red lines indicate theta directionality. Values are mean±SEM; asterisks indicate the significance level revealed by Wilcoxon Signed Rank test : *,p<0.05. MRL, mean resultant length vector; f, freezing; nf, non-freezing.
Figure 6 Phase-locking of single unit activity to LFP theta across regions. (A) Summary of phase-locking analysis during freezing states in R1 and non-freezing states in E. Each identified unit in CA1 (upper), LA (middle), and IL-PFC (bottom) was assigned a LFP theta phase recorded simultaneously in the other two brain areas (grey, blue, green diagrams indicating LFP in CA1, LA, IL-PFC, respectively). Plotted are mean time shifts between unit activity and the LFP theta phase calculated from MRLs in each area. Note the significant lead of unit activity in IL-PFC related to the LFP theta in CA1 and LA during non-freezing in E (highlighted by red lines). (B) Mean MRL of all identified theta phase-locked IL-PFC units during freezing in R1 and non-freezing in E related to LFP theta oscillations recorded simultaneously in CA1 (upper diagram) and LA (lower diagram). Note the peak MRL (indicated by red arrows) signaling a lead of unit activity in IL-PFC related to LFP theta in CA1 and LA during non-freezing in E. (C) Schematic representation of phase-locking of single unit activity to LFP theta across regions, during freezing at R1 and non-freezing at E. Black lines with two arrowheads indicate high theta synchrony (with no significant time lead or lag), red lines indicate theta directionality. Values are mean±SEM; asterisks indicate the significance level revealed by Wilcoxon Signed Rank test : *,p<0.05. MRL, mean resultant length vector; f, freezing; nf, non-freezing.CC BY · PubMed Central

Verification

Claims the paper makes

The claims and statistics of this paper haven’t been checked yet.

Run the check — free, no account needed. It reads the open-access text and checks the sources it cites.

A few free checks a day · papers already verified open instantly · results are public

Claims other papers make about this one

Each is checked against this paper’s own text: does it say what the citing paper says it does?

Self-check

Percentages, sums and reported differences re-computed from the paper’s own numbers.

The self-check needs the paper’s full text.

Citations

Cites

Show all 61 references

Research works printed but not linked: 1

  1. P Berens, 2009, CircStat: A MATLAB Toolbox for Circular Statistics, Journal of Statistical Software

Cited by

Sorted by citations

See all 105

Metadata

Authors
Lesting, J., Daldrup, T., Narayanan, V., Himpe, C., Seidenbecher, T., & Pape, H.-C.
Affiliations
University of Münster (DE)
Corresponding author
Pape, Hans-Christian
Venue
PLoS ONE
Published
2013-10-24
Volume
8
Issue
10
Pages
e77707
ISSN
1932-6203 (ISSN-L)
OpenAlex
W1990940223
Cited by
105
References
61
Citations by year
2026: 5 · 2025: 9 · 2024: 6 · 2023: 10 · 2022: 5 · 2021: 11 · 2020: 8 · 2019: 10 · 2018: 8 · 2017: 7 · 2016: 11 · 2015: 12 · 2014: 3
FWCI
4.75
Type
journal article
Language
en
Open access
Locations
  • PLoS ONE (publishedVersion, cc-by)
  • Europe PMC (PubMed Central) (publishedVersion, cc-by)
  • PubMed Central (publishedVersion, cc-by)
  • PubMed (publishedVersion)
  • DOAJ (DOAJ: Directory of Open Access Journals) (submittedVersion)
  • Figshare (submittedVersion, cc-by)
Funders
Deutsche Forschungsgemeinschaft (TP-A02, TRR‐58, SFB TRR 58)
Topics
  • Life Sciences › Neuroscience › Cognitive Neuroscience › Memory and Neural Mechanisms
  • Life Sciences › Neuroscience › Cognitive Neuroscience › Neural dynamics and brain function
  • Life Sciences › Neuroscience › Cellular and Molecular Neuroscience › Neuroscience and Neuropharmacology Research
Keywords
fear extinction, theta oscillations, prefrontal cortex, infralimbic cortex, hippocampal CA1, lateral amygdala, fear memory retrieval, phase locking, conditioned freezing, exposure therapy, anxiety disorders
MeSH terms
Amygdala, Animals, Conditioning, Psychological, Extinction, Psychological, Fear, Hippocampus, Learning, Male, Memory, Mice, Inbred C57BL, Neural Pathways, Mental Recall, Theta Rhythm, Prefrontal Cortex, Mice

About these checks

Registry, retraction, Cites and statistics results are computed, not judged, with one exception: a printed reference that no index lists is read once by a model before it counts as a citation error. Claims are extracted by a model and kept only when their quote appears verbatim in the text; each cited source is then checked, with a model’s help, for whether it says what the claim relies on. Those verdicts can be wrong — read the claim’s quote and the cited source before relying on one.

Statistics and arithmetic are recomputed, not judged.

Confidence bands are shown only for fields calibrated on our annotated test set. None is calibrated yet, so no band is shown.

What counts as a claim ›How we measure confidence ›How we check this ›

Are you an author, or do you see a problem with this page? Request a review