

The DOI matches its Crossref record; 51 of the 53 references it cites were found in a registry or an index.
Digital Photoplethysmography for Assessment of Arterial Stiffness: Repeatability and Comparison with Applanation Tonometry
Open accessAbstract
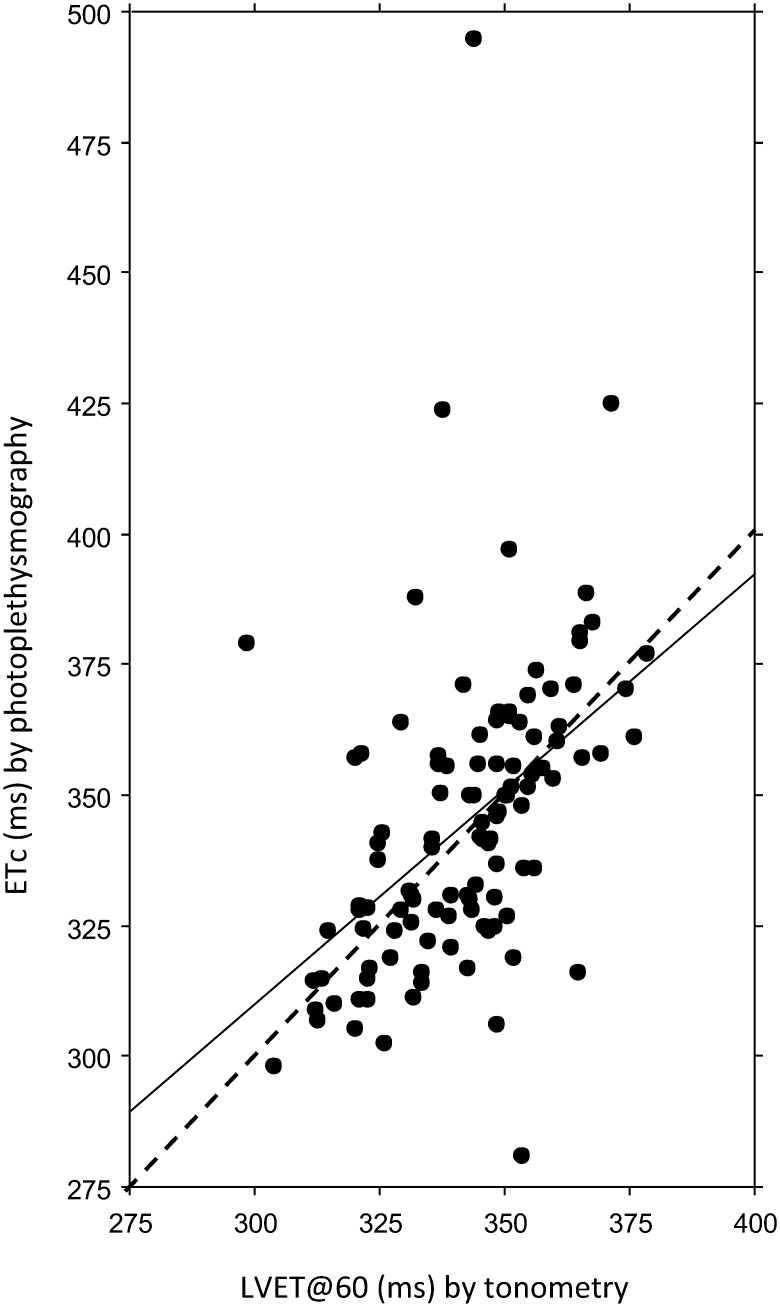
INTRODUCTION: Arterial stiffness is an independent risk factor for cardiovascular morbidity and can be assessed by applanation tonometry by measuring pulse wave velocity (PWV) and augmentation index (AIX) by pressure pulse wave analysis (PWA). As an inexpensive and operator independent alternative, photoelectric plethysmography (PPG) has been introduced with analysis of the digital volume pulse wave (DPA) and its second derivatives of wave reflections. OBJECTIVE: The objective was to investigate the repeatability of arterial stiffness parameters measured by digital pulse wave analysis (DPA) and the associations to applanation tonometry parameters. METHODS AND RESULTS: 112 pregnant and non-pregnant individuals of different ages and genders were examined with SphygmoCor arterial wall tonometry and Meridian DPA finger photoplethysmography. Coefficients of repeatability, Bland-Altman plots, intraclass correlation coefficients and correlations to heart rate (HR) and body height were calculated for DPA variables, and the DPA variables were compared to tonometry variables left ventricular ejection time (LVET), PWV and AIX. No DPA variable showed any systematic measurement error or excellent repeatability, but dicrotic index (DI), dicrotic dilatation index (DDI), cardiac ejection elasticity index (EEI), aging index (AI) and second derivatives of the crude pulse wave curve, b/a and e/a, showed good repeatability. Overall, the correlations to AIX were better than to PWV, with correlations coefficients >0.70 for EEI, AI and b/a. Considering the level of repeatability and the correlations to tonometry, the overall best DPA parameters were EEI, AI and b/a. The two pansystolic time parameters, ejection time compensated (ETc) by DPA and LVET by tonometry, showed a significant but weak correlation. CONCLUSION: For estimation of the LV function, ETc, EEI and b/a are suitable, for large artery stiffness EEI, and for small arteries DI and DDI. The only global parameter, AI, showed a high repeatability and the overall best correlations with AIX and PWV.
Overview
The claims and statistics of this paper haven’t been checked yet.
Run the check — free, no account needed. It reads the open-access text and checks the sources it cites.
Integrity signals
Registry
Cites
Statistics
Figures
Verification
Claims the paper makes
The claims and statistics of this paper haven’t been checked yet.
Run the check — free, no account needed. It reads the open-access text and checks the sources it cites.
Claims other papers make about this one
Each is checked against this paper’s own text: does it say what the citing paper says it does?
In the citing paper
“Over 30 features have been proposed for assessing the stiffness of both the large and small arteries from a single PPG”
From Wearable Photoplethysmography for Cardiovascular Monitoring (2022) · cites this paper as [172]
Self-check
Percentages, sums and reported differences re-computed from the paper’s own numbers.
The self-check needs the paper’s full text.
Citations
Cites
STATISTICAL METHODS FOR ASSESSING AGREEMENT BETWEEN TWO METHODS OF CLINICAL MEASUREMENT
Martin Bland, J., & Altman, D. (1986) · The Lancet · doi:10.1016/s0140-6736(86)90837-8 · Cited by 47,965
Measuring agreement in method comparison studies
Bland, J. M., & Altman, D. G. (1999) · Statistical Methods in Medical Research · doi:10.1177/096228029900800204 · Cited by 9,619 · cited 1×
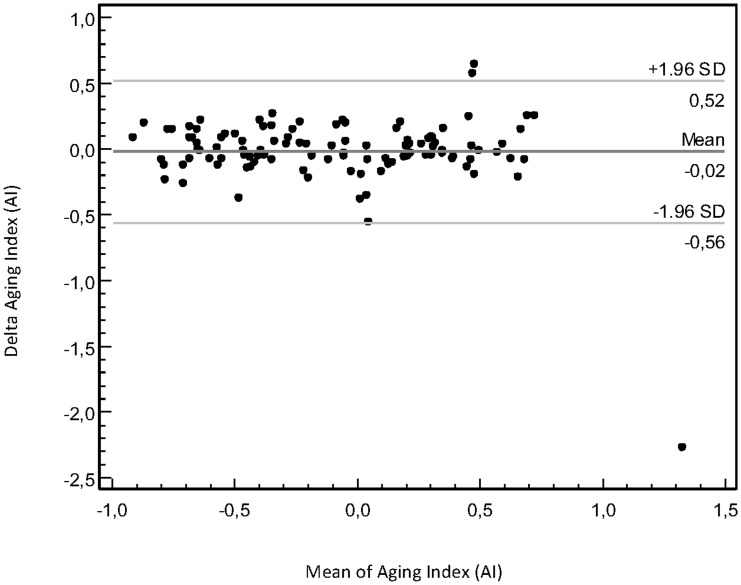
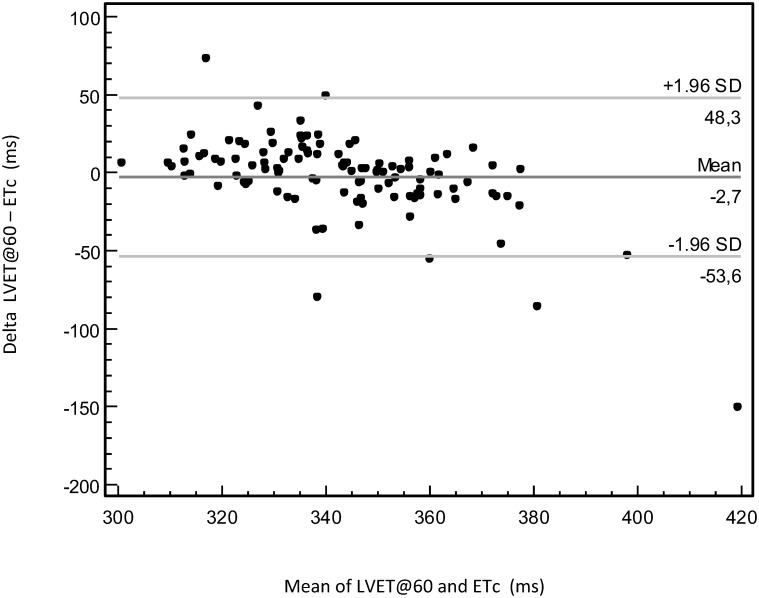
“We described agreement between the two DPA measurements with Bland-Altman plots [36,37].”
Measuring agreement in method comparison studies
Bland, J. M., & Altman, D. G. (1999) · Statistical Methods in Medical Research · doi:10.1191/096228099673819272 · Cited by 9,619
Expert consensus document on arterial stiffness: methodological issues and clinical applications
Laurent, S., Cockcroft, J., Van Bortel, L., Boutouyrie, P., Giannattasio, C., Hayoz, D., Pannier, B., Vlachopoulos, C., Wilkinson, I., Struijker-Boudier, H., et al. (2006) · European Heart Journal · doi:10.1093/eurheartj/ehl254 · Cited by 6,077
McDonald's blood flow in arteries; theoretical, experimental and clinical principles
(1992) · General Pharmacology The Vascular System · doi:10.1016/0306-3623(92)90079-y · Cited by 2,395
Aortic Stiffness Is an Independent Predictor of Primary Coronary Events in Hypertensive Patients
Boutouyrie, P., Tropeano, A., Asmar, R. G., Gautier, I., Bénétos, A., Lacolley, P. J., & Laurent, S. (2002) · Hypertension · doi:10.1161/hy0102.099031 · Cited by 1,745 · cited 2×
“Although pressure PW analysis shows benefits in predicting cardiovascular morbidity [1,10], the impact in clinical practice is small because the tonometry method is cumbersome with a need for highly specialized operators.”
McDonald's Blood Flow in Arteries: Theoretical, Experimental and Clinical Principles
Vlachopoulos, C., O'Rourke, M., & Nichols, W. W. (2011) · doi:10.1201/b13568 · Cited by 1,613
Aortic pulse wave velocity as a marker of cardiovascular risk in hypertensive patients
Blacher, J., Asmar, R., Djane, S., London, G. M., & Safar, M. E. (1999) · Hypertension · doi:10.1161/01.hyp.33.5.1111 · Cited by 1,493 · cited 1×
“The PWV is correlated to age, blood pressure (BP) and arteriosclerosis and has a better predictive value for cardiovascular disease than traditional risk markers [3,4].”
On the Analysis of Fingertip Photoplethysmogram Signals
Elgendi, M. (2012) · Current Cardiology Reviews · doi:10.2174/157340312801215782 · Cited by 1,206 · cited 3×
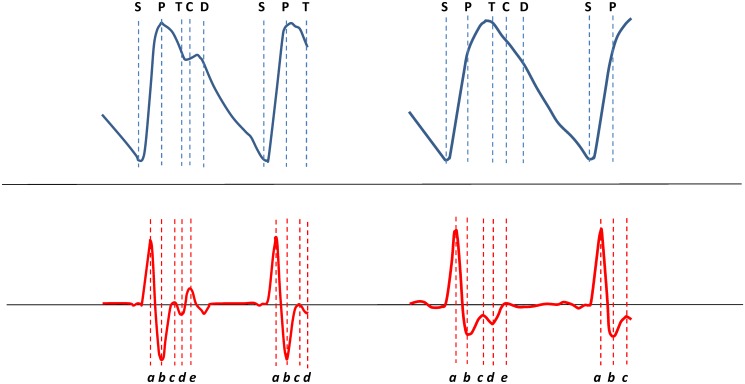
“The e wave represents the dictrotic notch and corresponds to the aortic valve closure [11].”
InfluentialClinical measurement of arterial stiffness obtained from noninvasive pressure waveforms
NICHOLS, W. (2005) · American Journal of Hypertension · doi:10.1016/j.amjhyper.2004.10.009 · Cited by 1,008 · cited 1×
“AIX is influenced by both large artery stiffness and properties in the PW-reflecting peripheral arterial tree [5 – 7] and is associated with cardiovascular risk, although it is less established than the PWV as a risk factor for cardiovascular morbidity [8 – 10].”
Research works printed but not linked: 3
- R Gonzales, 2008, A computer base photoplethysmographic vascular analyser through derivatives, Comp Cardiol, 35, 177
- T Ozawa, 1978, Pattern of second derivative of volume pulse wave, the relation between non-invasive index of ventricular function and peak acceleration and effect of preloading to peak velocity, Myakuha (Pulse Wave), 8, 22
- HC Bazett, 1920, An analysis of the time-relations of electrocardiograms, Heart, 7, 35
Cited by
Sorted by citations
Self‐Powered Pulse Sensor for Antidiastole of Cardiovascular Disease
Ouyang, H., Tian, J., Sun, G., Zou, Y., Liu, Z., Li, H., Zhao, L., Shi, B., Fan, Y., Fan, Y., et al. (2017) · Advanced Materials · doi:10.1002/adma.201703456 · Cited by 470
Photoplethysmogram Analysis and Applications: An Integrative Review
Park, J., Seok, H. S., Kim, S.-S., & Shin, H. (2022) · Frontiers in Physiology · doi:10.3389/fphys.2021.808451 · Cited by 514
Sources of inaccuracy in photoplethysmography for continuous cardiovascular monitoring
Fine, J., Branan, K. L., Rodriguez, A. J., Boonya-ananta, T., Ajmal, Ramella-Roman, J. C., McShane, M. J., & Coté, G. L. (2021) · Biosensors · doi:10.3390/bios11040126 · Cited by 348
Wearable Photoplethysmography for Cardiovascular Monitoring
Charlton, P. H., Kyriacou, P. A., Mant, J., Marozas, V., Chowienczyk, P., & Alastruey, J. (2022) · Proceedings of the IEEE · doi:10.1109/jproc.2022.3149785 · Cited by 250
An optimal filter for short photoplethysmogram signals
Liang, Y., Elgendi, M., Chen, Z., & Ward, R. (2018) · Scientific Data · doi:10.1038/sdata.2018.76 · Cited by 242
Metadata
- Authors
- von Wowern, E., Östling, G., Nilsson, P. M., & Olofsson, P.
- Affiliations
- Lund University (SE)
- Venue
- PLOS ONE
- Publisher
- Public Library of Science (PLoS)
- Published
- 2015-08-20
- Volume
- 10
- Issue
- 8
- Pages
- e0135659
- ISSN
- 1932-6203 (ISSN-L)
- PMC
- PMC4546304
- OpenAlex
- W1784071036
- Cited by
- 134
- References
- 53
- Citations by year
- 2026: 3 · 2025: 8 · 2024: 9 · 2023: 8 · 2022: 39 · 2021: 19 · 2020: 12 · 2019: 7 · 2018: 13 · 2017: 9 · 2016: 7
- FWCI
- 7.03
- Type
- journal article
- Language
- en
- Open access
- gold
- doi.org
- Licence
- Locations
- PLoS ONE (publishedVersion, cc-by)
- Europe PMC (PubMed Central) (publishedVersion, cc-by)
- PubMed Central (publishedVersion, cc-by)
- PubMed (publishedVersion)
- RePEc: Research Papers in Economics (submittedVersion)
- DOAJ (DOAJ: Directory of Open Access Journals) (submittedVersion, cc-by-sa)
- Lund University Publications (Lund University) (submittedVersion, other-oa)
- Funders
- Lunds Universitet
- Region Skåne
- Topics
- Health Sciences › Medicine › Cardiology and Cardiovascular Medicine › Cardiovascular Health and Disease Prevention
- Physical Sciences › Engineering › Biomedical Engineering › Non-Invasive Vital Sign Monitoring
- Health Sciences › Medicine › Cardiology and Cardiovascular Medicine › Heart Rate Variability and Autonomic Control
- Keywords
- arterial stiffness, digital photoplethysmography, applanation tonometry, pulse wave analysis, pulse wave velocity, augmentation index, repeatability, aging index, left ventricular ejection time, pregnancy, cardiovascular risk
- MeSH terms
- Adult, Aged, Aged, 80 and over, Aorta, Arteries, Blood Pressure, Elasticity, Female, Heart Rate, Humans, Male, Manometry, Middle Aged, Pregnancy, Pulse, Risk Factors, Photoplethysmography, Young Adult, Vascular Stiffness, Pulse Wave Analysis
About these checks
Registry, retraction, Cites and statistics results are computed, not judged, with one exception: a printed reference that no index lists is read once by a model before it counts as a citation error. Claims are extracted by a model and kept only when their quote appears verbatim in the text; each cited source is then checked, with a model’s help, for whether it says what the claim relies on. Those verdicts can be wrong — read the claim’s quote and the cited source before relying on one.
Statistics and arithmetic are recomputed, not judged.
Confidence bands are shown only for fields calibrated on our annotated test set. None is calibrated yet, so no band is shown.
What counts as a claim ›How we measure confidence ›How we check this ›
Are you an author, or do you see a problem with this page? Request a review
