

The DOI matches its Crossref record; 9 of the 9 references it cites were found in a registry or an index.
Highly efficient gene inactivation by adenoviral CRISPR/Cas9 in human primary cells
Overview
The claims and statistics of this paper haven’t been checked yet.
Run the check — free, no account needed. It reads the open-access text and checks the sources it cites.
Integrity signals
Registry
Cites
Statistics
Figures
Verification
Claims the paper makes
The claims and statistics of this paper haven’t been checked yet.
Run the check — free, no account needed. It reads the open-access text and checks the sources it cites.
Claims other papers make about this one
Each is checked against this paper’s own text: does it say what the citing paper says it does?
In the citing paper
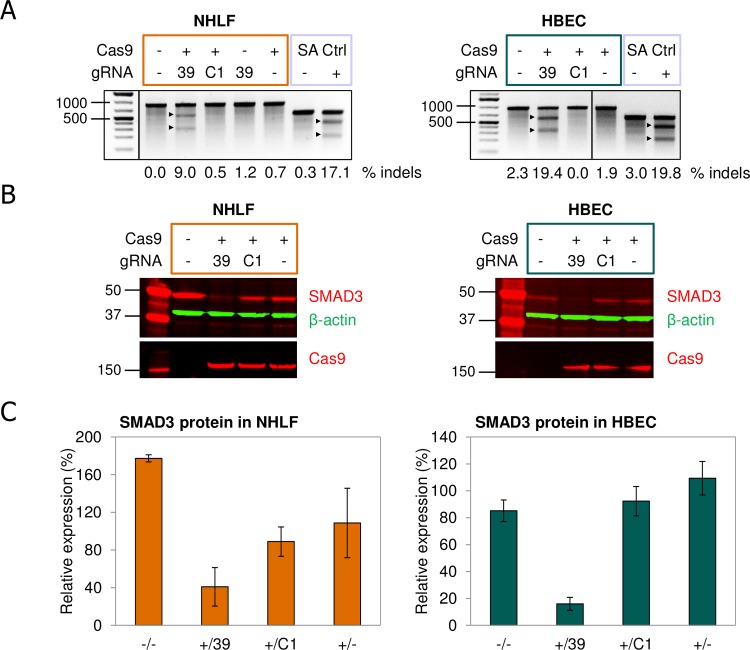
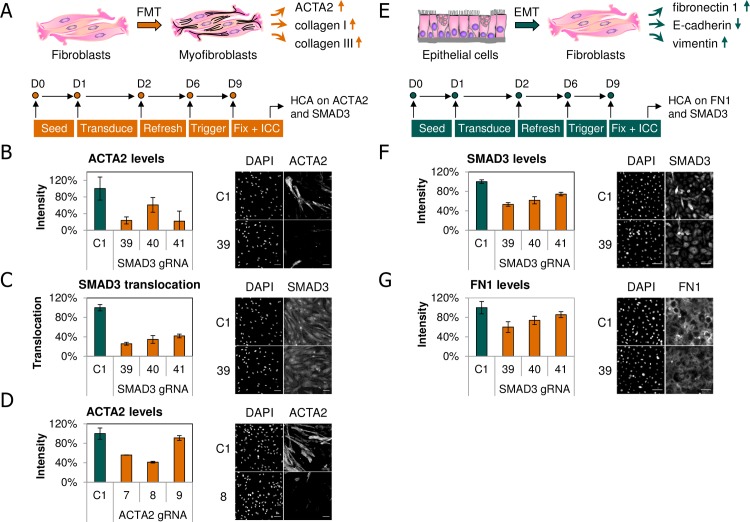
“To demonstrate the potential of CRISPR/Cas9 for drug discovery, Voets et al. used AdV to inactivate the SMAD3 gene in normal human lung fibroblasts and bronchial epithelial cells with multiplicity of infection as low as 20 [37].”
From Viral Delivery Systems for CRISPR (2019) · cites this paper as [37]
Self-check
Percentages, sums and reported differences re-computed from the paper’s own numbers.
The self-check needs the paper’s full text.
Citations
Cites
CRISPR-Cas systems for editing, regulating and targeting genomes
Sander, J. D., & Joung, J. K. (2014) · Nature Biotechnology · doi:10.1038/nbt.2842 · Cited by 3,153
Efficient genome editing in zebrafish using a CRISPR-Cas system
Hwang, W. Y., Fu, Y., Reyon, D., Maeder, M. L., Tsai, S. Q., Sander, J. D., Peterson, R. T., Yeh, J.-R. J., & Joung, J. K. (2013) · Nature Biotechnology · doi:10.1038/nbt.2501 · Cited by 2,937
Expression profiling reveals off-target gene regulation by RNAi
Jackson, A. L., Bartz, S. R., Schelter, J., Kobayashi, S. V., Burchard, J., Mao, M., Li, B., Cavet, G., & Linsley, P. S. (2003) · Nature Biotechnology · doi:10.1038/nbt831 · Cited by 2,370
Mali, P., Aach, J., Stranges, P. B., Esvelt, K. M., Moosburner, M., Kosuri, S., Yang, L., & Church, G. M. (2013) · Nature Biotechnology · doi:10.1038/nbt.2675 · Cited by 1,752
Schwank, G., Koo, B.-K., Sasselli, V., Dekkers, J. F., Heo, I., Demircan, T., Sasaki, N., Boymans, S., Cuppen, E., van der Ent, C. K., et al. (2013) · Cell Stem Cell · doi:10.1016/j.stem.2013.11.002 · Cited by 1,424
Genome-wide binding of the CRISPR endonuclease Cas9 in mammalian cells
Wu, X., Scott, D. A., Kriz, A. J., Chiu, A. C., Hsu, P. D., Dadon, D. B., Cheng, A. W., Trevino, A. E., Konermann, S., Chen, S., et al. (2014) · Nature Biotechnology · doi:10.1038/nbt.2889 · Cited by 944
Heritable genome editing in C. elegans via a CRISPR-Cas9 system
Friedland, A. E., Tzur, Y. B., Esvelt, K. M., Colaiácovo, M. P., Church, G. M., & Calarco, J. A. (2013) · Nature Methods · doi:10.1038/nmeth.2532 · Cited by 899
Veres, A., Gosis, B. S., Ding, Q., Collins, R., Ragavendran, A., Brand, H., Erdin, S., Cowan, C. A., Talkowski, M. E., & Musunuru, K. (2014) · Cell Stem Cell · doi:10.1016/j.stem.2014.04.020 · Cited by 474
Smad3 Mediates Transforming Growth Factor-β–Induced α-Smooth Muscle Actin Expression
Hu, B., Wu, Z., & Phan, S. H. (2003) · American Journal of Respiratory Cell and Molecular Biology · doi:10.1165/rcmb.2003-0063oc · Cited by 325
Research works printed but not linked: 36
- H van Es, 2005, Biology calls the targets: combining RNAi and disease biology, Drug Discov Today, 10, 1385, 10.1016/S1359-6446(05)03590-7 · DOI
- K Berns, 2004, A large-scale RNAi screen in human cells identifies new components of the p53 pathway, Nature, 428, 431, 10.1038/nature02371 · DOI
- K Ohneda, 2014, Transcription factor GATA1 is dispensable for mast cell differentiation in adult mice, Mol Cell Biol, 34, 1812, 10.1128/MCB.01524-13 · DOI
- T Gaj, 2013, ZFN, TALEN, and CRISPR/Cas-based methods for genome engineering, Trends Biotechnol, 31, 397, 10.1016/j.tibtech.2013.04.004 · DOI · Paper page
- R Barrangou, 2007, CRISPR provides acquired resistance against viruses in prokaryotes, Science, 315, 1709, 10.1126/science.1138140 · DOI · Paper page
- M Jinek, 2012, A Programmable Dual-RNA-Guided DNA Endonuclease in Adaptive Bacterial Immunity, Science, 337, 816, 10.1126/science.1225829 · DOI · Paper page
- FJM Mojica, 2009, Short motif sequences determine the targets of the prokaryotic CRISPR defence system, Microbiology, 155, 733, 10.1099/mic.0.023960-0 · DOI · Paper page
- O Shalem, 2014, Genome-scale CRISPR-Cas9 knockout screening in human cells, Science, 343, 84, 10.1126/science.1247005 · DOI · Paper page
- T Wang, 2014, Genetic screens in human cells using the CRISPR-Cas9 system, Science, 343, 80, 10.1126/science.1246981 · DOI · Paper page
- M Holkers, 2014, Adenoviral vector DNA for accurate genome editing with engineered nucleases, Nat Methods
- M Ratz, 2015, CRISPR/Cas9-mediated endogenous protein tagging for RESOLFT super-resolution microscopy of living human cells, Sci Rep, 5, 9592, 10.1038/srep09592 · DOI
- a. M Kabadi, 2014, Multiplex CRISPR/Cas9-based genome engineering from a single lentiviral vector, Nucleic Acids Res, 42, gku749, 10.1093/nar/gku749 · DOI · Paper page
- C Li, 2015, Inhibition of HIV-1 infection of primary CD4+ T cells by gene editing of CCR5 using adenovirus-delivered CRISPR/Cas9, J Gen Virol
- P Abrahimi, 2015, Efficient Gene Disruption in Cultured Primary Human Endothelial Cells by CRISPR/Cas9, Circ Res, 117, 121, 10.1161/CIRCRESAHA.117.306290 · DOI
- M Claussnitzer, 2015, FTO Obesity Variant Circuitry and Adipocyte Browning in Humans, N Engl J Med, 373, 150819140043007, 10.1056/NEJMoa1502214 · DOI · Paper page
- J Bellec, 2015, CFTR Inactivation by Lentiviral Vector-mediated RNA Interference and CRISPR-Cas9 Genome Editing in Human Airway Epithelial Cells, Curr Gene Ther, 15, 447, 10.2174/1566523215666150812115939 · DOI
- S Van Wetering, 2000, Regulation of SLPI and elafin release from bronchial epithelial cells by neutrophil defensins, Am J Physiol Lung Cell Mol Physiol, 278, L51, 10.1152/ajplung.2000.278.1.L51 · DOI
- GJ Arts, 2003, Adenoviral vectors expressing siRNAs for discovery and validation of gene function, Genome Res, 13, 2325, 10.1101/gr.1332603 · DOI
- F Michiels, 2002, Arrayed adenoviral expression libraries for functional screening, Nat Biotechnol, 20, 1154, 10.1038/nbt746 · DOI
- JF Rippmann, 2009, Improved lipid profile through liver-specific knockdown of liver X receptor alpha in KKAy diabetic mice, J Lipid Res, 50, 22, 10.1194/jlr.M700571-JLR200 · DOI
- L Cong, 2013, Multiplex Genome Engineering Using CRISPR / Cas Systems, Science, 819
- P Ten Dijke, 2007, Extracellular control of TGFbeta signalling in vascular development and disease, Nat Rev Mol Cell Biol, 8, 857, 10.1038/nrm2262 · DOI
- MW Popp, 2016, Leveraging rules of nonsense-mediated mRNA decay for genome engineering and personalized medicine, Cell, 1319, 10.1016/j.cell.2016.05.053 · DOI
- A N. Lekkerkerker, 2012, Cellular Players in Lung Fibrosis, Current Pharmaceutical Design, 4093, 10.2174/138161212802430396 · DOI
- K Ghosh a, 2000, Smad-dependent stimulation of type I collagen gene expression in human skin fibroblasts by TGF-beta involves functional cooperation with p300/CBP transcriptional coactivators, Oncogene, 19, 3546, 10.1038/sj.onc.1203693 · DOI
- G Gasiunas, 2012, PNAS Plus: Cas9-crRNA ribonucleoprotein complex mediates specific DNA cleavage for adaptive immunity in bacteria, Proc Natl Acad Sci, 109, E2579, 10.1073/pnas.1208507109 · DOI · Paper page
- SH Sternberg, 2015, Expanding the Biologist’s Toolkit with CRISPR-Cas9, Mol Cell, 58, 568, 10.1016/j.molcel.2015.02.032 · DOI
- AR Bassett, 2013, Highly efficient targeted mutagenesis of Drosophila with the CRISPR/Cas9 system, Cell Rep, 4, 220, 10.1016/j.celrep.2013.06.020 · DOI
- H Wang, 2013, One-step generation of mice carrying mutations in multiple genes by CRISPR/Cas-mediated genome engineering, Cell, 153, 910, 10.1016/j.cell.2013.04.025 · DOI · Paper page
- Y Niu, 2014, Generation of gene-modified cynomolgus monkey via Cas9/RNA-mediated gene targeting in one-cell embryos, Cell, 156, 836, 10.1016/j.cell.2014.01.027 · DOI · Paper page
- W Tan, 2013, Efficient nonmeiotic allele introgression in livestock using custom endonucleases, Proc Natl Acad Sci U S A, 110, 16526, 10.1073/pnas.1310478110 · DOI
- RJ Platt, 2014, CRISPR-Cas9 Knockin Mice for Genome Editing and Cancer Modeling, Cell, 159, 440, 10.1016/j.cell.2014.09.014 · DOI · Paper page
- I Maggio, 2014, Adenoviral vector delivery of RNA-guided CRISPR/Cas9 nuclease complexes induces targeted mutagenesis in a diverse array of human cells, Sci Rep, 4, 5105, 10.1038/srep05105 · DOI
- HW Chu, 2015, CRISPR-Cas9 mediated gene knockout in primary human airway epithelial cells reveals a pro-inflammatory role for MUC18, Gene Ther
- Y Fu, 2013, High-frequency off-target mutagenesis induced by CRISPR-Cas nucleases in human cells, Nat Biotechnol. Nature Publishing Group, 31, 822, 10.1038/nbt.2623 · DOI · Paper page
- C Kuscu, 2014, Genome-wide analysis reveals characteristics of off-target sites bound by the Cas9 endonuclease, Nat Biotechnol, 32, 677, 10.1038/nbt.2916 · DOI · Paper page
Cited by
Sorted by citations
Delivering CRISPR: a review of the challenges and approaches
Lino, C. A., Harper, J. C., Carney, J. P., & Timlin, J. A. (2018) · Drug Delivery · doi:10.1080/10717544.2018.1474964 · Cited by 1,185
Viral Delivery Systems for CRISPR
Xu, C. L., Ruan, M. Z. C., Mahajan, V. B., & Tsang, S. H. (2019) · Viruses · doi:10.3390/v11010028 · Cited by 277
Exosome/Liposome-like Nanoparticles: New Carriers for CRISPR Genome Editing in Plants
Alghuthaymi, M. A., Ahmad, A., Khan, Z., Khan, S. H., Ahmed, F. K., Faiz, S., Nepovimova, E., Kuča, K., & Abd-Elsalam, K. A. (2021) · International Journal of Molecular Sciences · doi:10.3390/ijms22147456 · Cited by 83
Metadata
- Authors
- Voets, O., Tielen, F., Elstak, E., Benschop, J., Grimbergen, M., Stallen, J., Janssen, R., van Marle, A., & Essrich, C.
- ORCID
- Voets, Olaf
- Venue
- PLOS ONE
- Publisher
- Public Library of Science (PLoS)
- Published
- 2017-08-11
- Volume
- 12
- Issue
- 8
- Pages
- e0182974
- ISSN
- 1932-6203
- PMC
- PMC5553774
- Cited by
- 48
- References
- 9
- Language
- en
About these checks
Registry, retraction, Cites and statistics results are computed, not judged, with one exception: a printed reference that no index lists is read once by a model before it counts as a citation error. Claims are extracted by a model and kept only when their quote appears verbatim in the text; each cited source is then checked, with a model’s help, for whether it says what the claim relies on. Those verdicts can be wrong — read the claim’s quote and the cited source before relying on one.
Statistics and arithmetic are recomputed, not judged.
Confidence bands are shown only for fields calibrated on our annotated test set. None is calibrated yet, so no band is shown.
What counts as a claim ›How we measure confidence ›How we check this ›
Are you an author, or do you see a problem with this page? Request a review
