

The DOI matches its Crossref record; 55 of the 59 references it cites were found in a registry or an index; none of the 37 sources its claims cite is checked for support yet.
Ecological and cultural factors underlying the global distribution of prejudice
Open accessAbstract
Prejudiced attitudes and political nationalism vary widely around the world, but there has been little research on what predicts this variation. Here we examine the ecological and cultural factors underlying the worldwide distribution of prejudice. We suggest that cultures grow more prejudiced when they tighten cultural norms in response to destabilizing ecological threats. A set of seven archival analyses, surveys, and experiments (∑N = 3,986,402) find that nations, American states, and pre-industrial societies with tighter cultural norms show the most prejudice based on skin color, religion, nationality, and sexuality, and that tightness predicts why prejudice is often highest in areas of the world with histories of ecological threat. People's support for cultural tightness also mediates the link between perceived ecological threat and intentions to vote for nationalist politicians. Results replicate when controlling for economic development, inequality, conservatism, residential mobility, and shared cultural heritage. These findings offer a cultural evolutionary perspective on prejudice, with implications for immigration, intercultural conflict, and radicalization.
Overview
AI snapshot
Written from the paper’s full text.
TL;DR
Seven archival, survey, and experimental studies (∑N = 3,986,402) find that cultures with tighter norms show more prejudice across nations, US states, and pre-industrial societies, and that ecological threat predicts prejudice through cultural tightness. The authors argue this offers a cultural evolutionary account of prejudice and nationalist political support.
Key findings
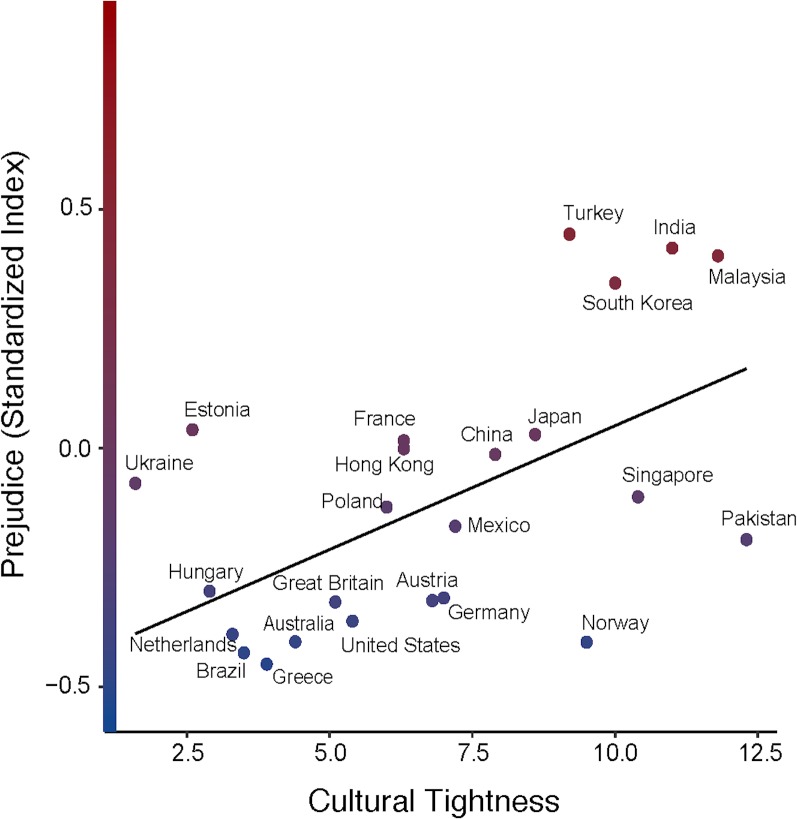
- Across 25 current-day nations, nation-level cultural tightness predicted prejudice, b = .05, SE = .02, t = 3.25, p = .004, R²level 2 = .30, controlling for GDP per capita, GINI, and WVS wave; tightness also predicted each prejudice indicator, including immigrants, OR = 1.18, p < .001, and unmarried cohabitants, OR = 1.38, p < .001.
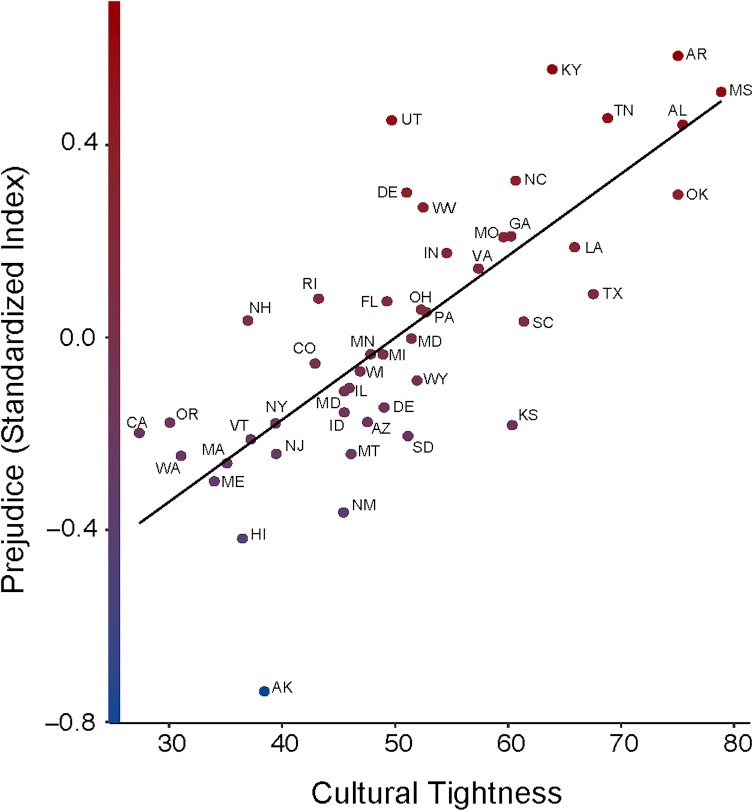
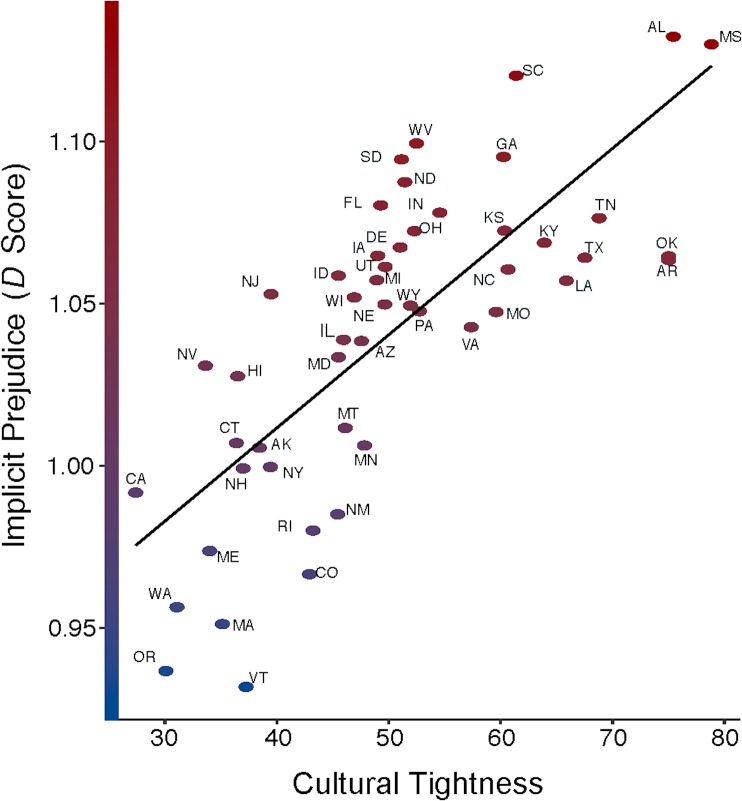
- Across the 50 US states, tightness predicted explicit prejudice, b = .02, SE = .003, t = 7.19, p < .001, R²level 2 = .64, controlling for income, conservatism, and residential mobility; conservatism’s effect was nullified when tightness was included. Tightness also predicted implicit prejudice, b = .002, SE = .001, t = 3.82, p < .001, R² = .11.
- Across 47 pre-industrial societies, tightness predicted prejudice, b = .85, SE = .28, t = 2.98, p = .005, R²level 1 = .09, controlling for shared language family and residential mobility.
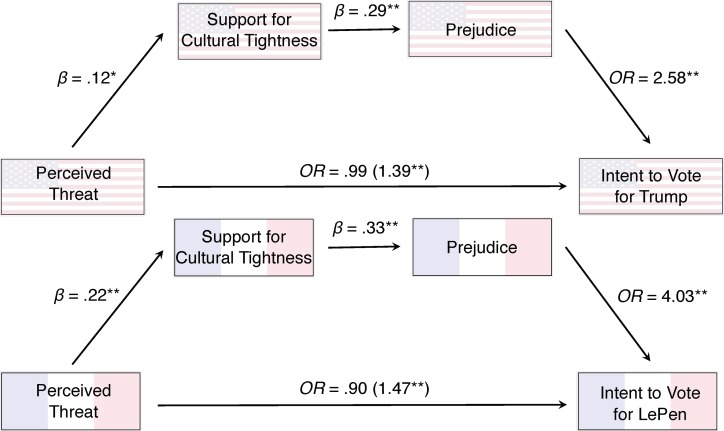
- Threat-to-tightness-to-prejudice mediation replicated across studies; in Study 5, experimentally salient ecological threat increased support for tightness, F(2,1046) = 5.18, p = .006, and support for tightness predicted prejudice, b = .06, SE = .02, t = 2.37, p = .01. In Studies 6–7, threat predicted intention to vote for Donald Trump and Marine Le Pen via tightness and prejudice, with significant serial indirect effects and no significant direct effects.
Methods
- Seven studies combined archival analyses, surveys, and an experiment: Study 1 used 117,157 individuals from 25 countries in the World Values Survey; Study 2 used 11,577 individuals from the 50 US states in the General Social Survey; Study 3 used 3,855,737 US residents from Project Implicit (2002–2016); Study 4 used 47 Standard Cross-Cultural Sample societies; Study 5 was an experiment with 1,049 participants from Singapore, Germany, the USA, and Brazil; Studies 6–7 surveyed 562 Americans during the 2016 primary and 320 French respondents before the 2017 election.
- Measures included prejudice indices (e.g., unwillingness to live near stigmatized groups, opposition to relatives marrying minority groups, implicit association tests, cross-cultural hostility/violence codes, and survey prejudice items), cultural tightness (nation and state scores, ethnographic coding across six domains, and individual support-for-tightness scales), and ecological threat indices (e.g., population density, food deprivation, disease, disaster, conflict, parasite stress, resource scarcity, famine, warfare, and perceived threats).
- Analyses used multilevel models with random intercepts across nations, states, language families, or participants’ states; controls included economic development, inequality, conservatism, residential mobility, and shared cultural heritage; mediation was tested with Monte Carlo simulations, plus ANOVA, regression, and serial mediation path models.
Limitations
- The paper states that its correlational studies do not show that tightness causes prejudice, that tightness is not the only cultural factor linked with prejudice, and that the authors did not see evidence of mutual influence/feedback between tightness and prejudice; they call for longitudinal, time-series, and phylogenetic work.
- Evident from the text: mediation analyses are largely cross-sectional or correlational, and Study 5 notes that measuring a mediator cannot establish a causal relationship on an outcome variable.
- Evident from the text: Study 3 relies on Project Implicit users who freely take implicit association tests, so that sample is not a probability sample; Study 4 uses ethnographic codes assigned by trained research assistants.
Model-written summary. Check it against the paper before relying on it.
Integrity signals
Registry
Cites
Statistics
Figures
Verification
Claims the paper makes
70 Own result · 17 Own method · 16 Not checked yet · 13 Own interpretation · 3 No basis given
A result the paper reports from its own data — it cites no other source for it, so there is none to check. The quote shows it is in the paper.
In the paper
“A set of seven archival analyses, surveys, and experiments (∑N = 3,986,402) find that nations, American states, and pre-industrial societies with tighter cultural norms show the most prejudice based on skin color, religion, nationality, and sexuality”
§ Ecological and cultural factors underlying the global distribution of prejudice > Abstract
plaincorrelationaln = 3,986,402- Asserted: passes — The authors put it forward as true.
- Checkable: passes — It can be checked against evidence.
- Load-bearing: passes — The paper’s conclusions depend on it.
- Based: passes — The paper gives a reason why it holds.
A result the paper reports from its own data — it cites no other source for it, so there is none to check. The quote shows it is in the paper.
In the paper
“People’s support for cultural tightness also mediates the link between perceived ecological threat and intentions to vote for nationalist politicians.”
§ Ecological and cultural factors underlying the global distribution of prejudice > Abstract
plaindirectn = 3,986,402- Asserted: passes — The authors put it forward as true.
- Checkable: passes — It can be checked against evidence.
- Load-bearing: passes — The paper’s conclusions depend on it.
- Based: passes — The paper gives a reason why it holds.
A result the paper reports from its own data — it cites no other source for it, so there is none to check. The quote shows it is in the paper.
In the paper
“and that tightness predicts why prejudice is often highest in areas of the world with histories of ecological threat.”
§ Ecological and cultural factors underlying the global distribution of prejudice > Abstract
plaindirectn = 3,986,402- Asserted: passes — The authors put it forward as true.
- Checkable: passes — It can be checked against evidence.
- Load-bearing: passes — The paper’s conclusions depend on it.
- Based: passes — The paper gives a reason why it holds.
A result the paper reports from its own data — it cites no other source for it, so there is none to check. The quote shows it is in the paper.
In the paper
“In a general linear model, support for cultural tightness did indeed predict higher prejudice, b = .06, SE = .02, t = 2.37, p = .01, R2 = .01.”
§ Ecological and cultural factors underlying the global distribution of prejudice > Study 5: Experimentally evoked support for cultural tightness and prejudice > Results
plaincorrelational- Asserted: passes — The authors put it forward as true.
- Checkable: passes — It can be checked against evidence.
- Load-bearing: passes — The paper’s conclusions depend on it.
- Based: passes — The paper gives a reason why it holds.
- Rests on an assumption: The 10 incomplete statements measure support for cultural tightness.
A result the paper reports from its own data — it cites no other source for it, so there is none to check. The quote shows it is in the paper.
In the paper
“This prediction was supported, b = .85, SE = .28, t = 2.98, p = .005, R2 level 1 = .09.”
§ Ecological and cultural factors underlying the global distribution of prejudice > Study 4: Prejudice across historical societies > Results
plaincorrelational- Asserted: passes — The authors put it forward as true.
- Checkable: passes — It can be checked against evidence.
- Load-bearing: passes — The paper’s conclusions depend on it.
- Based: passes — The paper gives a reason why it holds.
A result the paper reports from its own data — it cites no other source for it, so there is none to check. The quote shows it is in the paper.
In the paper
“Cultural tightness significantly predicted each item in our prejudice scale, positively correlating with prejudice against African Americans, b = .02, SE = .003, t = 7.17, p < .001, R2 level 2 = .63, Asians, b = .01, SE = .003, t = 3.94, p < .001, R2 level 2 = .46, gay people, b = .02, SE = .004, t = 3.26, p = .002, R2 level 2 = .39, Hispanic people, b = .01, SE = .003, t = 4.01, p < .001, R2”
§ Ecological and cultural factors underlying the global distribution of prejudice > Study 2: Explicit prejudice across states in the USA > Results
plaincorrelational- Asserted: passes — The authors put it forward as true.
- Checkable: passes — It can be checked against evidence.
- Load-bearing: passes — The paper’s conclusions depend on it.
- Based: passes — The paper gives a reason why it holds.
A result the paper reports from its own data — it cites no other source for it, so there is none to check. The quote shows it is in the paper.
In the paper
“In support of this prediction, nation-level tightness robustly predicted prejudice across nations, b = .05, SE = .02, t = 3.25, p = .004, R2level 2 = .30 (see Fig 1), even with our control variables.”
§ Ecological and cultural factors underlying the global distribution of prejudice > Study 1: Prejudice in current-day nations > Results
boostedcorrelational- Asserted: passes — The authors put it forward as true.
- Checkable: passes — It can be checked against evidence.
- Load-bearing: passes — The paper’s conclusions depend on it.
- Based: passes — The paper gives a reason why it holds.
A result the paper reports from its own data — it cites no other source for it, so there is none to check. The quote shows it is in the paper.
In the paper
“Ecological threat was associated with both cultural tightness, b = 7.64, SE = 1.45, t = 5.26, p < .001, R2 = .18, and implicit prejudice, b = .02, SE = .007, t = 2.47, p = .02, R2 = .05, but the link between tightness and prejudice remained significant when controlling for threat, b = .002, SE = .001, t = 2.74, p = .009, R2 = .06.”
§ Ecological and cultural factors underlying the global distribution of prejudice > Study 3: Implicit prejudice across American states > Results
plaincorrelational- Asserted: passes — The authors put it forward as true.
- Checkable: passes — It can be checked against evidence.
- Load-bearing: passes — The paper’s conclusions depend on it.
- Based: passes — The paper gives a reason why it holds.
A result the paper reports from its own data — it cites no other source for it, so there is none to check. The quote shows it is in the paper.
In the paper
“Even controlling for shared heritage, tightness was associated with greater prejudice, replicating our pattern of results in current-day groups.”
§ Ecological and cultural factors underlying the global distribution of prejudice > Study 4: Prejudice across historical societies > Results
plaincorrelational- Asserted: passes — The authors put it forward as true.
- Checkable: passes — It can be checked against evidence.
- Load-bearing: passes — The paper’s conclusions depend on it.
- Based: passes — The paper gives a reason why it holds.
A result the paper reports from its own data — it cites no other source for it, so there is none to check. The quote shows it is in the paper.
In the paper
“Preliminary analyses showed that ecological threat directly predicted tightness across nations, b = .25, SE = .08, t = 3.23, p = .004, R2level 2 = .26, but did not directly predict prejudice, b = .008, SE = .009, t = .91, p = .38, R2level 2 = .04.”
§ Ecological and cultural factors underlying the global distribution of prejudice > Study 1: Prejudice in current-day nations > Results
plain- Asserted: passes — The authors put it forward as true.
- Checkable: passes — It can be checked against evidence.
- Load-bearing: passes — The paper’s conclusions depend on it.
- Based: passes — The paper gives a reason why it holds.
- It may state two separate claims as one. 19
- Probably not a substantial claim. 16
A result the paper reports from its own data — it cites no other source for it, so there is none to check. The quote shows it is in the paper.
In the paper
“However, nation-level cultural tightness did predict people’s prejudice, b = .66, SE = .09, t = 7.59, p < .001, R2 = .05, such that people in tighter nations were more prejudiced than people in looser nations.”
§ Ecological and cultural factors underlying the global distribution of prejudice > Study 5: Experimentally evoked support for cultural tightness and prejudice > Results
plaincorrelational- Asserted: passes — The authors put it forward as true.
- Checkable: passes — It can be checked against evidence.
- Load-bearing: passes — The paper’s conclusions depend on it.
- Based: passes — The paper gives a reason why it holds.
It may state two separate claims as one.
- Rests on an assumption: The 10 incomplete statements measure support for cultural tightness.
A result the paper reports from its own data — it cites no other source for it, so there is none to check. The quote shows it is in the paper.
In the paper
“Ecological threat no longer significantly predicted prejudice when tightness was added to the model, indicating full mediation, b = .005, SE = .003, t = 0.15, p = .88, R2level 2 = .03.”
§ Ecological and cultural factors underlying the global distribution of prejudice > Study 2: Explicit prejudice across states in the USA > Results
hedged- Asserted: passes — The authors put it forward as true.
- Checkable: passes — It can be checked against evidence.
- Load-bearing: passes — The paper’s conclusions depend on it.
- Based: passes — The paper gives a reason why it holds.
It may state two separate claims as one.
A result the paper reports from its own data — it cites no other source for it, so there is none to check. The quote shows it is in the paper.
In the paper
“Threat also remained a significant predictor in this model, b = 1.12, SE = .20, t = 5.56, p < .001, R2 level 1 = .35, indicating partial mediation.”
§ Ecological and cultural factors underlying the global distribution of prejudice > Study 4: Prejudice across historical societies > Results
hedgedcorrelational- Asserted: passes — The authors put it forward as true.
- Checkable: passes — It can be checked against evidence.
- Load-bearing: passes — The paper’s conclusions depend on it.
- Based: passes — The paper gives a reason why it holds.
It may state two separate claims as one.
A result the paper reports from its own data — it cites no other source for it, so there is none to check. The quote shows it is in the paper.
In the paper
“A Monte Carlo simulation confirmed significant mediation, and ecological threat did not reach significance in this model, indicating full mediation, CIs [.01,.04], b = .03, SE = .08, t = 0.39, p = .70, R2 < .01.”
§ Ecological and cultural factors underlying the global distribution of prejudice > Study 3: Implicit prejudice across American states > Results
hedged- Asserted: passes — The authors put it forward as true.
- Checkable: passes — It can be checked against evidence.
- Load-bearing: passes — The paper’s conclusions depend on it.
- Based: passes — The paper gives a reason why it holds.
It may state two separate claims as one.
A result the paper reports from its own data — it cites no other source for it, so there is none to check. The quote shows it is in the paper.
In the paper
“in turn predicting prejudiced attitudes and xenophobic political preferences.”
§ Ecological and cultural factors underlying the global distribution of prejudice > Discussion
plaindirect- Asserted: passes — The authors put it forward as true.
- Checkable: passes — It can be checked against evidence.
- Load-bearing: passes — The paper’s conclusions depend on it.
- Based: passes — The paper gives a reason why it holds.
It may state two separate claims as one.
- Rests on an assumption: The 10 incomplete statements measure support for cultural tightness.
A result the paper reports from its own data — it cites no other source for it, so there is none to check. The quote shows it is in the paper.
In the paper
“Both of these path models—displayed in Fig 5—showed significant indirect effects (American 95% CIs [.001, .008]; French 95% CIs [.006, .02]), but no significant direct effects (American 95% CIs [-.05, .04]; French 95% CIs [-.09, .02])”
§ Ecological and cultural factors underlying the global distribution of prejudice > Studies 6–7: Support for tightness, prejudice, and voting intentions > Results
plain- Asserted: passes — The authors put it forward as true.
- Checkable: passes — It can be checked against evidence.
- Load-bearing: passes — The paper’s conclusions depend on it.
- Based: passes — The paper gives a reason why it holds.
It may state two separate claims as one.
- Rests on an assumption: The 10 incomplete statements measure support for cultural tightness.
- Rests on an assumption: The 2016 US and 2017 French election cycles featured candidates who advocated policies restricting minority groups.
- Rests on an assumption: The mediation analyses assume no unmeasured confounding of the mediator-outcome relationship.
- Rests on an assumption: The voting intention measure is a valid indicator of actual voting behavior.
A result the paper reports from its own data — it cites no other source for it, so there is none to check. The quote shows it is in the paper.
In the paper
“While our primary results involved prejudice against people with different social identities, our supplementary materials present further evidence for a relationship between tightness and other forms of prejudice, including a 20-nation field study that documents prejudice against individuals with physical stigmas.”
§ Ecological and cultural factors underlying the global distribution of prejudice > Discussion
plaincorrelational- Asserted: passes — The authors put it forward as true.
- Checkable: passes — It can be checked against evidence.
- Load-bearing: fails — The paper’s conclusions may not depend on it.
- Based: passes — The paper gives a reason why it holds.
Probably not a substantial claim. The paper’s conclusions may not depend on it.
- Rests on an assumption: The 10 incomplete statements measure support for cultural tightness.
The paper states this without a source or data behind it here, so there is nothing to check it against. The quote shows it is in the paper.
In the paper
“Prejudiced attitudes and political nationalism vary widely around the world, but there has been little research on what predicts this variation.”
§ Ecological and cultural factors underlying the global distribution of prejudice > Abstract
plain- Asserted: passes — The authors put it forward as true.
- Checkable: passes — It can be checked against evidence.
- Load-bearing: passes — The paper’s conclusions depend on it.
- Based: passes — The paper gives a reason why it holds.
It may state two separate claims as one.
None of the sources cited for this claim have been checked yet.
In the paper
“Evolutionary game theory models and behavioral data suggest that cultural tightness emerges following threat because it curbs defection and increases coordination [28–29].”
§ Ecological and cultural factors underlying the global distribution of prejudice > Ecological threat, cultural tightness, and variation in prejudice
What the sources say
- Not checked yetcites [28] P Roos, 2015, Societal threat and cultural variation in the strength of social norms: An evolutionary basis, Organizational Behavior and Human Decision Processes source
- Not checked yetcites [29] JR Harrington, 2014, Tightness-looseness across the 50 united states, Proceedings of the National Academy of Sciences source
hedgeddirect- Asserted: passes — The authors put it forward as true.
- Checkable: passes — It can be checked against evidence.
- Load-bearing: passes — The paper’s conclusions depend on it.
- Based: passes — The paper gives a reason why it holds.
It may state two separate claims as one.
The paper states this without a source or data behind it here, so there is nothing to check it against. The quote shows it is in the paper.
In the paper
“Prejudiced attitudes and political nationalism vary widely around the world, but there has been little research on what predicts this variation.”
§ Ecological and cultural factors underlying the global distribution of prejudice > Abstract
plain- Asserted: passes — The authors put it forward as true.
- Checkable: passes — It can be checked against evidence.
- Load-bearing: passes — The paper’s conclusions depend on it.
- Based: passes — The paper gives a reason why it holds.
Probably not a substantial claim.
A conclusion the paper draws from its own results — it cites no other source for it, so there is none to check. The quote shows it is in the paper.
In the paper
“If tightness is linked to prejudice, then threat provides the ecological basis to understand variation in prejudice through its influence on tight norms.”
§ Ecological and cultural factors underlying the global distribution of prejudice > Ecological threat, cultural tightness, and variation in prejudice
plainconditional- Asserted: passes — The authors put it forward as true.
- Checkable: passes — It can be checked against evidence.
- Load-bearing: passes — The paper’s conclusions depend on it.
- Based: passes — The paper gives a reason why it holds.
Probably not a substantial claim.
None of the sources cited for this claim have been checked yet.
In the paper
“TL theory holds that, during times of threat, groups and individuals gravitate towards cultural tightness because tighter norms can better maintain societal order, stability, and coordination [24–26].”
§ Ecological and cultural factors underlying the global distribution of prejudice > Ecological threat, cultural tightness, and variation in prejudice
What the sources say
- Not checked yetcites [24] MJ Gelfand, 2011, & Aycan Z. Differences between tight and loose cultures: A 33-nation study, Science source
- Not checked yetcites [25] MJ Gelfand, 2017, The Strength of Social Norms Across Human Groups, Perspectives on Psychological Science source
- Not checked yetcites [26] MJ Gelfand, 2016, Societal threat as a moderator of cultural group selection, Behavioral and Brain Sciences source
plaindirect- Asserted: passes — The authors put it forward as true.
- Checkable: passes — It can be checked against evidence.
- Load-bearing: passes — The paper’s conclusions depend on it.
- Based: passes — The paper gives a reason why it holds.
Probably not a substantial claim.
None of the sources cited for this claim have been checked yet.
In the paper
“Yet while tightness encourages coordination through increased social regulation, it also decreases openness [24,30].”
§ Ecological and cultural factors underlying the global distribution of prejudice > Ecological threat, cultural tightness, and variation in prejudice
What the sources say
- Not checked yetcites [24] MJ Gelfand, 2011, & Aycan Z. Differences between tight and loose cultures: A 33-nation study, Science source
- Not checked yetcites [30] De S, Nau DS, Gelfand, MJ. Understanding norm change: An evolutionary game-theoretic approach. Proceedings of the 16th Conference on Autonomous Agents and MultiAgent Systems, (International Foundation for Autonomous Agents and Multiagent Systems); 2017. pp. 1433–1441.
plaindirect- Asserted: passes — The authors put it forward as true.
- Checkable: passes — It can be checked against evidence.
- Load-bearing: passes — The paper’s conclusions depend on it.
- Based: passes — The paper gives a reason why it holds.
It may state two separate claims as one.
What the paper did — it cites no source for this, so there is none to check. The quote shows it is in the paper.
In the paper
“Indeed, one of the strengths of our research is that we test our predictions using a combination of correlational and experimental methods for the link between cultural tightness and prejudice in a variety of comparative samples, consistently replicating our results across studies.”
§ Ecological and cultural factors underlying the global distribution of prejudice > Ecological threat, cultural tightness, and variation in prejudice
boostedcorrelational- Asserted: passes — The authors put it forward as true.
- Checkable: passes — It can be checked against evidence.
- Load-bearing: passes — The paper’s conclusions depend on it.
- Based: passes — The paper gives a reason why it holds.
It may state two separate claims as one.
A conclusion the paper draws from its own results — it cites no other source for it, so there is none to check. The quote shows it is in the paper.
In the paper
“We theorize that cultural tightness may also increase prejudice against individuals who are seen as disrupting the social order simply because they practice a minority religion, belong to a minority ethnic group, or have a minority sexual orientation.”
§ Ecological and cultural factors underlying the global distribution of prejudice > Ecological threat, cultural tightness, and variation in prejudice
hedgedconditional- Asserted: passes — The authors put it forward as true.
- Checkable: passes — It can be checked against evidence.
- Load-bearing: passes — The paper’s conclusions depend on it.
- Based: fails — The paper may give no reason why it holds.
Probably not a substantial claim. The paper may give no reason why it holds.
In the paper
“For example, Harrington and Gelfand [29] found that relatively tighter states such as Alabama and Virginia have higher execution rates, less access to alcohol, and more frequent corporal punishment in schools compared to relatively looser states like Nevada or Washington.”
§ Ecological and cultural factors underlying the global distribution of prejudice > Study 2: Explicit prejudice across states in the USA
What the sources say
- Not checked yetcites [29] JR Harrington, 2014, Tightness-looseness across the 50 united states, Proceedings of the National Academy of Sciences source
plaincorrelational- Asserted: passes — The authors put it forward as true.
- Checkable: passes — It can be checked against evidence.
- Load-bearing: passes — The paper’s conclusions depend on it.
- Based: passes — The paper gives a reason why it holds.
It may state two separate claims as one.
What the paper did — it cites no source for this, so there is none to check. The quote shows it is in the paper.
In the paper
“We also controlled for an estimate Gross Domestic Product per Capita at purchasing power parity (GDPPP), inequality (GINI), and WVS wave in order to model the effects of economic development, social inequality, and time.”
§ Ecological and cultural factors underlying the global distribution of prejudice > Study 1: Prejudice in current-day nations
plainn = 117,157- Asserted: passes — The authors put it forward as true.
- Checkable: passes — It can be checked against evidence.
- Load-bearing: passes — The paper’s conclusions depend on it.
- Based: passes — The paper gives a reason why it holds.
Probably not a substantial claim.
What the paper did — it cites no source for this, so there is none to check. The quote shows it is in the paper.
In the paper
“In total, 11,577 individuals from the 50 federal states had data on prejudice.”
§ Ecological and cultural factors underlying the global distribution of prejudice > Study 2: Explicit prejudice across states in the USA
plainn = 11,577- Asserted: passes — The authors put it forward as true.
- Checkable: passes — It can be checked against evidence.
- Load-bearing: fails — The paper’s conclusions may not depend on it.
- Based: passes — The paper gives a reason why it holds.
Probably not a substantial claim. The paper’s conclusions may not depend on it.
What the paper did — it cites no source for this, so there is none to check. The quote shows it is in the paper.
In the paper
“Codes across each of these domains converged towards a 1-factor solution and showed high reliability (Cronbach’s α = .87), and thus we averaged them into a single index representing the overall cultural tightness in each society.”
§ Ecological and cultural factors underlying the global distribution of prejudice > Study 4: Prejudice across historical societies
plain- Asserted: passes — The authors put it forward as true.
- Checkable: passes — It can be checked against evidence.
- Load-bearing: passes — The paper’s conclusions depend on it.
- Based: passes — The paper gives a reason why it holds.
It may state two separate claims as one.
What the paper did — it cites no source for this, so there is none to check. The quote shows it is in the paper.
In the paper
“Analyses controlled for income and political conservatism using the same measures as in Study 2.”
§ Ecological and cultural factors underlying the global distribution of prejudice > Study 3: Implicit prejudice across American states
plain- Asserted: passes — The authors put it forward as true.
- Checkable: passes — It can be checked against evidence.
- Load-bearing: fails — The paper’s conclusions may not depend on it.
- Based: passes — The paper gives a reason why it holds.
Probably not a substantial claim. The paper’s conclusions may not depend on it.
A conclusion the paper draws from its own results — it cites no other source for it, so there is none to check. The quote shows it is in the paper.
In the paper
“which suggests that priming threat alone was not enough to increase prejudice; rather, priming threat needed to accompany an increase in support for cultural tightness in order to increase prejudice.”
§ Ecological and cultural factors underlying the global distribution of prejudice > Study 5: Experimentally evoked support for cultural tightness and prejudice > Results
hedgeddirect- Asserted: passes — The authors put it forward as true.
- Checkable: passes — It can be checked against evidence.
- Load-bearing: passes — The paper’s conclusions depend on it.
- Based: passes — The paper gives a reason why it holds.
It may state two separate claims as one.
- Rests on an assumption: The 10 incomplete statements measure support for cultural tightness.
- Rests on an assumption: The mediation analyses assume no unmeasured confounding of the mediator-outcome relationship.
What the paper did — it cites no source for this, so there is none to check. The quote shows it is in the paper.
In the paper
“As in Studies 2–3, Study 4 also controlled for residential mobility.”
§ Ecological and cultural factors underlying the global distribution of prejudice > Study 4: Prejudice across historical societies
plain- Asserted: passes — The authors put it forward as true.
- Checkable: passes — It can be checked against evidence.
- Load-bearing: fails — The paper’s conclusions may not depend on it.
- Based: passes — The paper gives a reason why it holds.
Probably not a substantial claim. The paper’s conclusions may not depend on it.
The paper states this without a source or data behind it here, so there is nothing to check it against. The quote shows it is in the paper.
In the paper
“We note that support for cultural tightness is not the same as living in a tight society.”
§ Ecological and cultural factors underlying the global distribution of prejudice > Study 5: Experimentally evoked support for cultural tightness and prejudice
plain- Asserted: passes — The authors put it forward as true.
- Checkable: passes — It can be checked against evidence.
- Load-bearing: passes — The paper’s conclusions depend on it.
- Based: passes — The paper gives a reason why it holds.
Probably not a substantial claim.
What the paper did — it cites no source for this, so there is none to check. The quote shows it is in the paper.
In the paper
“We sampled 47 societies from the Standard Cross-Cultural Sample, which was built to be as geographically diverse as possible in order to minimize the probability of cross-cultural correlations being due to shared cultural ancestry or intercultural borrowing.”
§ Ecological and cultural factors underlying the global distribution of prejudice > Study 4: Prejudice across historical societies
plaindirect- Asserted: passes — The authors put it forward as true.
- Checkable: passes — It can be checked against evidence.
- Load-bearing: passes — The paper’s conclusions depend on it.
- Based: passes — The paper gives a reason why it holds.
Probably not a substantial claim.
A conclusion the paper draws from its own results — it cites no other source for it, so there is none to check. The quote shows it is in the paper.
In the paper
“However, since tightness is a group-level metric, support for cultural tightness provides an approximation that we predict should be associated at the individual level with many correlates of cultural tightness at the group level.”
§ Ecological and cultural factors underlying the global distribution of prejudice > Study 5: Experimentally evoked support for cultural tightness and prejudice
hedgedcorrelational- Asserted: passes — The authors put it forward as true.
- Checkable: passes — It can be checked against evidence.
- Load-bearing: passes — The paper’s conclusions depend on it.
- Based: fails — The paper may give no reason why it holds.
Probably not a substantial claim. The paper may give no reason why it holds. It may state two separate claims as one.
A conclusion the paper draws from its own results — it cites no other source for it, so there is none to check. The quote shows it is in the paper.
In the paper
“This trend has potentially resulted in support for programs such as Brexit in England, a border wall in the United States, and far-right nationalist parties in Austria, Hungary, and Poland, among other European nations.”
§ Ecological and cultural factors underlying the global distribution of prejudice > Discussion
hedgedconditional- Asserted: passes — The authors put it forward as true.
- Checkable: passes — It can be checked against evidence.
- Load-bearing: fails — The paper’s conclusions may not depend on it.
- Based: fails — The paper may give no reason why it holds.
Probably not a substantial claim. The paper’s conclusions may not depend on it. The paper may give no reason why it holds. It may state two separate claims as one.
- Rests on an assumption: The 2016 US and 2017 French election cycles featured candidates who advocated policies restricting minority groups.
None of the sources cited for this claim have been checked yet.
In the paper
“Factors such as religion, inequality, and resource scarcity may predict prejudice and discrimination across cultures [23,62–64].”
§ Ecological and cultural factors underlying the global distribution of prejudice > Discussion
What the sources say
- Not checked yetcites [23] TR Cohen, 2006, Group morality and intergroup relations: Cross-cultural and experimental evidence, Personality and Social Psychology Bulletin source
- Not checked yetcites [62] J Watts, 2016, Ritual human sacrifice promoted and sustained the evolution of stratified societies, Nature source
- Not checked yetcites [63] RA McNamara, 2016, Supernatural punishment, in-group biases, and material insecurity: experiments and ethnography from Yasawa, Fiji, Religion, Brain & Behavior source
- Not checked yetcites [64] P Burns, 2000, Economic insecurity, prejudicial stereotypes, and public opinion on immigration policy, Political Science Quarterly source
hedgedconditional- Asserted: passes — The authors put it forward as true.
- Checkable: passes — It can be checked against evidence.
- Load-bearing: fails — The paper’s conclusions may not depend on it.
- Based: passes — The paper gives a reason why it holds.
Probably not a substantial claim. The paper’s conclusions may not depend on it.
In the paper
“Politics play an important role in cultural change, and many historical cases of intergroup hostility have been rooted in prejudiced political leaders and governments [61].”
§ Ecological and cultural factors underlying the global distribution of prejudice > Studies 6–7: Support for tightness, prejudice, and voting intentions
What the sources say
- Not checked yetcites [61] BZ Tamanaha, 2004 source
plaindirect- Asserted: passes — The authors put it forward as true.
- Checkable: passes — It can be checked against evidence.
- Load-bearing: passes — The paper’s conclusions depend on it.
- Based: passes — The paper gives a reason why it holds.
It may state two separate claims as one.
A conclusion the paper draws from its own results — it cites no other source for it, so there is none to check. The quote shows it is in the paper.
In the paper
“These findings show that voters who believed their country was under threat were more likely to vote for Donald Trump and Marine LePen, and their preferences could be fully explained by their support for cultural tightness and prejudice.”
§ Ecological and cultural factors underlying the global distribution of prejudice > Studies 6–7: Support for tightness, prejudice, and voting intentions > Results
boosteddirect- Asserted: passes — The authors put it forward as true.
- Checkable: passes — It can be checked against evidence.
- Load-bearing: passes — The paper’s conclusions depend on it.
- Based: passes — The paper gives a reason why it holds.
It may state two separate claims as one.
- Rests on an assumption: The 10 incomplete statements measure support for cultural tightness.
- Rests on an assumption: The 2016 US and 2017 French election cycles featured candidates who advocated policies restricting minority groups.
- Rests on an assumption: The mediation analyses assume no unmeasured confounding of the mediator-outcome relationship.
- Rests on an assumption: The voting intention measure is a valid indicator of actual voting behavior.
A conclusion the paper draws from its own results — it cites no other source for it, so there is none to check. The quote shows it is in the paper.
In the paper
“Our studies show that these events are neither isolated nor random, but instantiations of a broader principle that echoes across human history: Perceptions of ecological threat tighten societies, which in turn is linked to order and social coordination, but also to hostility and intolerance.”
§ Ecological and cultural factors underlying the global distribution of prejudice > Discussion
boosteddirect- Asserted: passes — The authors put it forward as true.
- Checkable: passes — It can be checked against evidence.
- Load-bearing: passes — The paper’s conclusions depend on it.
- Based: passes — The paper gives a reason why it holds.
It may state two separate claims as one.
- Rests on an assumption: The 10 incomplete statements measure support for cultural tightness.
- Rests on an assumption: The 2016 US and 2017 French election cycles featured candidates who advocated policies restricting minority groups.
A conclusion the paper draws from its own results — it cites no other source for it, so there is none to check. The quote shows it is in the paper.
In the paper
“More generally, our findings speak to a recent rise in policies and governments with agendas that are hostile to ethnic minorities and immigrants.”
§ Ecological and cultural factors underlying the global distribution of prejudice > Discussion
plaincorrelational- Asserted: passes — The authors put it forward as true.
- Checkable: passes — It can be checked against evidence.
- Load-bearing: fails — The paper’s conclusions may not depend on it.
- Based: passes — The paper gives a reason why it holds.
Probably not a substantial claim. The paper’s conclusions may not depend on it.
- Rests on an assumption: The 10 incomplete statements measure support for cultural tightness.
What the paper did — it cites no source for this, so there is none to check. The quote shows it is in the paper.
In the paper
“Study 6 also controlled for participants’ prior political orientation using a 1 (“Democrat”) to 5 (“Republican”) scale.”
§ Ecological and cultural factors underlying the global distribution of prejudice > Studies 6–7: Support for tightness, prejudice, and voting intentions
plain- Asserted: passes — The authors put it forward as true.
- Checkable: passes — It can be checked against evidence.
- Load-bearing: fails — The paper’s conclusions may not depend on it.
- Based: passes — The paper gives a reason why it holds.
Probably not a substantial claim. The paper’s conclusions may not depend on it.
In the paper
“Although in many cases explicit and implicit bias against minorities are decreasing [67], there is nevertheless a trend toward nationalist governments and policies in recent years.”
§ Ecological and cultural factors underlying the global distribution of prejudice > Discussion
What the sources say
- Not checked yetcites [67] TE Charlesworth, 2019, Patterns of implicit and explicit attitudes: I. Long-term change and stability from 2007 to 2016, Psychological science source
plain- Asserted: passes — The authors put it forward as true.
- Checkable: passes — It can be checked against evidence.
- Load-bearing: unclear — It is unclear whether the paper’s conclusions depend on it.
- Based: passes — The paper gives a reason why it holds.
It may state two separate claims as one.
The paper relies on this without support.
The 10 incomplete statements measure support for cultural tightness.
“All participants were then prompted to endorse an ending to 10 incomplete statements concerning their support for cultural tightness.”
The paper relies on this without support.
The 2016 US and 2017 French election cycles featured candidates who advocated policies restricting minority groups.
“We chose these election cycles because they featured candidates who advocated policies that put restrictions on minority groups.”
The paper relies on this without support.
The mediation analyses assume no unmeasured confounding of the mediator-outcome relationship.
“As predicted, support for cultural tightness mediated the association between perceived threat and prejudice amongst Americans, 95% CIs [.02, .08], and French participants, 95% CIs [.12, .42].”
The paper relies on this without support.
The voting intention measure is a valid indicator of actual voting behavior.
“asked participants who they planned to vote for in the upcoming election.”
Statistics recomputed
Every reported test result, recomputed from its test statistic and degrees of freedom. A result shows as not adding up only once an independent check has confirmed it.
- Consistentz = 2.92reported p = .004 · recomputed p = .004
“z = 2.92, p = .004”
- Consistentz = 3.81reported p < .001 · recomputed p < .001
“z = 3.81, p < .001”
- Consistentz = 2.01reported p = .04 · recomputed p = .044
“z = 2.01, p = .04”
- Consistentz = 2.14reported p = .03 · recomputed p = .032
“z = 2.14, p = .03”
- Consistentz = 4.17reported p < .001 · recomputed p < .001
“z = 4.17, p < .001”
- Consistentz = 6.17reported p < .001 · recomputed p < .001
“z = 6.17, p < .001”
- ConsistentF(2, 1046) = 5.18reported p = .006 · recomputed p = .006
“F(2,1046) = 5.18, p = .006”
- Consistentz = 2.68reported p = .007 · recomputed p = .007
“Z = 2.68, p = .007”
- Consistentz = 4.83reported p < .001 · recomputed p < .001
“Z = 4.83, p < .001”
- Consistentz = 6.57reported p < .001 · recomputed p < .001
“Z = 6.57, p < .001”
- Consistentz = 2.37reported p = .02 · recomputed p = .018
“Z = 2.37, p = .02”
- Consistentz = 5.95reported p < .001 · recomputed p < .001
“Z = 5.95, p < .001”
- Consistentz = 6.96reported p < .001 · recomputed p < .001
“Z = 6.96, p < .001”
Self-check
Percentages, sums and reported differences re-computed from the paper’s own numbers.
Each contradiction between two passages listed here was confirmed by an independent check.
Rated minor: it would not touch a result — a value no result rests on, a p-value that stays on the same side of the significance level, or a conflict that is clerical, resolved elsewhere in the paper, or outside its own findings.
In the paper
§ Ecological and cultural factors underlying the global distribution of prejudice > Study 1: Prejudice in current-day nations > Results
“Prejudice is operationalized through the refusal to live next to individuals from seven commonly stigmatized groups.”
§ Ecological and cultural factors underlying the global distribution of prejudice > Study 1: Prejudice in current-day nations
“We operationalized prejudice through six questions that asked whether or not participants would be willing to live near (a) people from a different race, (b) people from a different religion, (c) immigrants, (d) people who spoke a different language, (e) people of a different sexual orientation, and (f) unmarried cohabitants.”
Rated minor: it would not touch a result — a value no result rests on, a p-value that stays on the same side of the significance level, or a conflict that is clerical, resolved elsewhere in the paper, or outside its own findings.
In the paper
“French, b = .40, SE = .09, t = 4.04, p < .001”
§ Ecological and cultural factors underlying the global distribution of prejudice > Studies 6–7: Support for tightness, prejudice, and voting intentions > Results
Reported 4.04 · recomputed 4.444444
Rated minor: it would not touch a result — a value no result rests on, a p-value that stays on the same side of the significance level, or a conflict that is clerical, resolved elsewhere in the paper, or outside its own findings.
In the paper
“b = .005, SE = .003, t = 0.15, p = .88”
§ Ecological and cultural factors underlying the global distribution of prejudice > Study 2: Explicit prejudice across states in the USA > Results
Reported 0.15 · recomputed 1.666667
Rated minor: it would not touch a result — a value no result rests on, a p-value that stays on the same side of the significance level, or a conflict that is clerical, resolved elsewhere in the paper, or outside its own findings.
In the paper
“gay people, b = .02, SE = .004, t = 3.26, p = .002”
§ Ecological and cultural factors underlying the global distribution of prejudice > Study 2: Explicit prejudice across states in the USA > Results
Reported 3.26 · recomputed 5
Citations
Cites
Stigma: Notes on the Management of Spoiled Identity
(1969) · Postgraduate Medical Journal · doi:10.1136/pgmj.45.527.642 · Cited by 14,255
The weirdest people in the world?
Henrich, J., Heine, S. J., & Norenzayan, A. (2010) · Behavioral and Brain Sciences · doi:10.1017/s0140525x0999152x · Cited by 12,641
Beyond Baron and Kenny: Statistical Mediation Analysis in the New Millennium
Hayes, A. F. (2009) · Communication Monographs · doi:10.1080/03637750903310360 · Cited by 9,757
WEIRD languages have misled us, too
Majid, A., & Levinson, S. C. (2010) · Behavioral and Brain Sciences · doi:10.1017/s0140525x1000018x · Cited by 4,177
Differences Between Tight and Loose Cultures: A 33-Nation Study
Gelfand, M. J., Raver, J. L., Nishii, L., Leslie, L. M., Lun, J., Lim, B. C., Duan, L., Almaliach, A., Ang, S., Arnadottir, J., et al. (2011) · Science · doi:10.1126/science.1197754 · Cited by 3,252
Self-citationFear and loathing across party lines: New evidence on group polarization
Iyengar, S., & Westwood, S. J. (2015) · American Journal of Political Science · doi:10.1111/ajps.12152 · Cited by 2,452
Advantages of Monte Carlo confidence intervals for indirect effects
Preacher, K. J., & Selig, J. P. (2012) · Communication Methods and Measures · doi:10.1080/19312458.2012.679848 · Cited by 1,908
Modern racism, ambivalence, and the Modern Racism Scale.
McConahay, J. B. (1986) · Cited by 1,687
Prejudice, Discrimination and Racism
Beer, W. R., Dovidio, J. F., & Gaertner, S. L. (1988) · Contemporary Sociology A Journal of Reviews · doi:10.2307/2069383 · Cited by 1,491
Atlas of World Population History
J.-N., B., McEvedy, C. P., & Jones, R. (1978) · Population · doi:10.2307/1531978 · Cited by 972
Research works printed but not linked: 9
- A. Tartar, 2017, How the Populist Right is Redrawing the Map of Europe, Bloomberg
- JF Dovidio, 1986, Academic Press
- L Greenfeld, 2012, Nationalism. The Wiley‐Blackwell Encyclopedia of Globalization
- RA LeVine, 1972, Ethnocentrism: theories of conflict, ethnic attitudes, and group behavior
- J Califa Antonio, 1989, Declaring English the Official Language: Prejudice Spoken Here, Harv. CR-CLL Rev, 24, 293
- P Turchin, 2015, Ultrasociety: How 10,000 years of war made humans the greatest cooperators on earth
- M Gelfand, 2017, The Cultural Fault Line That Is Reshaping Global Politics, Scientific American
- CR Ember, 2009, Cross-Cultural Research Methods Rowman Altamira, Lanham, MD
- H Lang, 1998, CONAN: An electronic code-text data-base for cross-cultural studies., World Cultures, 9, 13
Cited by
Sorted by citations
Using social and behavioural science to support COVID-19 pandemic response
Bavel, J. J. V., Baicker, K., Boggio, P. S., Capraro, V., Cichocka, A., Cikara, M., Crockett, M. J., Crum, A. J., Douglas, K. M., Druckman, J. N., et al. (2020) · Nature Human Behaviour · doi:10.1038/s41562-020-0884-z · Cited by 4,964
Self-citationRETRACTED: Global impacts of pre- and post-COVID-19 pandemic: Focus on socio-economic consequences
Mishra, N. T. P., Das, S. S., Yadav, S., Khan, W., Afzal, M. F., AlArifi, A. S., Kenawy, E.-R., Ansari, M. T., Hasnain, M. S., & Nayak, A. K. (2020) · Sensors International · doi:10.1016/j.sintl.2020.100042 · Cited by 191
RetractedPatterns of Implicit and Explicit Stereotypes III: Long-Term Change in Gender Stereotypes
Charlesworth, T. E. S., & Banaji, M. R. (2021) · Social Psychological and Personality Science · doi:10.1177/1948550620988425 · Cited by 185
The loosening of American culture over 200 years is associated with a creativity–order trade-off
Jackson, J. C., Gelfand, M. J., De, S., & Fox, A. M. (2019) · Nature Human Behaviour · doi:10.1038/s41562-018-0516-z · Cited by 133
Self-citationA global analysis of cultural tightness in non-industrial societies
Jackson, J. C., Gelfand, M. J., & Ember, C. R. (2020) · Proceedings of the Royal Society B Biological Sciences · doi:10.1098/rspb.2020.1036 · Cited by 117
Self-citationTempleton, A., Tekin, S., Hoerst, C., Vestergren, S., Davidson, L., Ballentyne, S., Madsen, H., & Choudhury, S. (2020) · British Journal of Social Psychology · doi:10.1111/bjso.12400 · Cited by 104
The pandemic exposes human nature: 10 evolutionary insights
Seitz, B. M., Aktipis, A., Buss, D. M., Alcock, J., Bloom, P. A., Gelfand, M. J., Harris, S., Lieberman, D., Natterson-Horowitz, B., Pinker, S. A., et al. (2020) · Proceedings of the National Academy of Sciences · doi:10.1073/pnas.2009787117 · Cited by 101
Self-citationOnderdijk, K. E., Swarbrick, D., Kerrebroeck, B. V., Mantei, M., Vuoskoski, J. K., Maes, P., & Leman, M. (2021) · Frontiers in Psychology · doi:10.3389/fpsyg.2021.647929 · Cited by 132
Corona Concerts: The Effect of Virtual Concert Characteristics on Social Connection and Kama Muta
Swarbrick, D., Seibt, B., Grinspun, N., & Vuoskoski, J. K. (2021) · Frontiers in Psychology · doi:10.3389/fpsyg.2021.648448 · Cited by 97
The cultural evolutionary trade-off of ritualistic synchrony
Gelfand, M. J., Caluori, N., Jackson, J. C., & Taylor, M. K. (2020) · Philosophical Transactions of the Royal Society B Biological Sciences · doi:10.1098/rstb.2019.0432 · Cited by 91
Self-citationConflict Changes How People View God
Caluori, N., Jackson, J. C., Gray, K. J., & Gelfand, M. J. (2020) · Psychological Science · doi:10.1177/0956797619895286 · Cited by 86
Self-citationUsing Social and Behavioural Science to Support COVID-19 Pandemic ResponsePreprint
Bavel, J. J. V., D, K. B. A., Boggio, P. S., Capraro, V., Cichocka, A. K., Cikara, M., Crockett, M. J., Crum, A. J., Douglas, K. M., Druckman, J. N., et al. (2022) · SSRN Electronic Journal · doi:10.2139/ssrn.4178356 · Cited by 89
Self-citationPersuading republicans and democrats to comply with mask wearing: An intervention tournament
Gelfand, M. J., Ren, L., Stamkou, E., Pieper, D. J., Denison, E., Fernandez, J., Choi, V. K., Chatman, J. A., Jackson, J. C., & Dimant, E. (2022) · Journal of Experimental Social Psychology · doi:10.1016/j.jesp.2022.104299 · Cited by 74
Self-citationKim, S. Y., Cheon, J. E., Gillespie‐Lynch, K., & Kim, Y.-H. (2021) · Autism · doi:10.1177/13623613211029520 · Cited by 67
Manufacturing of bacteriophages for therapeutic applications
João, J., Lampreia, J., Prazeres, D. M. F., & Azevedo, A. M. (2021) · Biotechnology Advances · doi:10.1016/j.biotechadv.2021.107758 · Cited by 63
Morbid Polarization: Exposure to COVID‐19 and Partisan Disagreement about Pandemic Response
Rodriguez, C. G., Gadarian, S. K., Goodman, S. W., & Pepinsky, T. B. (2022) · Political Psychology · doi:10.1111/pops.12810 · Cited by 62
Worldwide divergence of values
Jackson, J. C., & Medvedev, D. (2024) · Nature Communications · doi:10.1038/s41467-024-46581-5 · Cited by 75
Self-citationCultural Evolutionary Mismatches in Response to Collective Threat
Gelfand, M. J. (2021) · Current Directions in Psychological Science · doi:10.1177/09637214211025032 · Cited by 55
Self-citationRoberts, K. J. S., Smith, C. J., Cluver, L. D., Toska, E., & Sherr, L. (2021) · AIDS and Behavior · doi:10.1007/s10461-020-03138-z · Cited by 50
Charlesworth, T. E. S., Navon, M., Rabinovich, Y., Lofaro, N., & Kurdi, B. (2022) · Behavior Research Methods · doi:10.3758/s13428-022-01851-2 · Cited by 46
Recognizing the Impact of COVID-19 on the Poor Alters Attitudes Towards Poverty and Inequality
Wiwad, D., Mercier, B., Piff, P. K., Shariff, A., & Aknin, L. B. (2020) · Journal of Experimental Social Psychology · doi:10.1016/j.jesp.2020.104083 · Cited by 59
Kim, S. Y., & Gillespie‐Lynch, K. (2022) · Journal of Autism and Developmental Disorders · doi:10.1007/s10803-022-05739-0 · Cited by 48
Pasquini, L., Napolitano, A., Lucignani, M., Tagliente, E., Dellepiane, F., Rossi‐Espagnet, M. C., Ritrovato, M., Vidiri, A., Villani, V., Ranazzi, G., et al. (2021) · Frontiers in Oncology · doi:10.3389/fonc.2021.601425 · Cited by 37
Kim, S. Y., Song, D., Bottema‐Beutel, K., Gillespie‐Lynch, K., & Cage, E. (2022) · Autism Research · doi:10.1002/aur.2867 · Cited by 41
Mula, S., Santo, D. D., Resta, E., Bakhtiari, F., Baldner, C., Molinario, E., Pierro, A., Gelfand, M. J., Denison, E., Agostini, M., et al. (2021) · Current Research in Ecological and Social Psychology · doi:10.1016/j.cresp.2021.100028 · Cited by 31
Self-citationThreatened humanity in a tight world: Cultural tightness results in self-objectification
Wang, X., Chen, H., Shi, J., & Chen, Z. (2022) · Group Processes & Intergroup Relations · doi:10.1177/13684302221097842 · Cited by 31
Quraish Shihab and Buya Hamka: The Concept of Multicultural Education from a Qur'anic Perspective
Putri, L. R., Vera, A., & Visconte, A. (2023) · International Journal of Educational Narratives · doi:10.55849/ijen.v1i1.236 · Cited by 28
How much cultural variation around the globe is explained by ecology?
Wormley, A. S., Kwon, J. Y., Barlev, M., & Varnum, M. E. W. (2023) · Proceedings of the Royal Society B Biological Sciences · doi:10.1098/rspb.2023.0485 · Cited by 30
Changes in social norms during the early stages of the COVID-19 pandemic across 43 countries
Andrighetto, G., Székely, Á., Guido, A., Gelfand, M. J., Abernathy, J., Arıkan, G., Aycan, Z., Bankar, S., Barrera, D., Basnight-Brown, D. M., et al. (2024) · Nature Communications · doi:10.1038/s41467-024-44999-5 · Cited by 25
Self-citationSperotto, F., Giaretta, I., Mondardini, M. C., Pece, F., Daverio, M., & Amigoni, A. (2021) · The Journal of Pediatric Pharmacology and Therapeutics · doi:10.5863/1551-6776-26.1.73 · Cited by 23
Stigma and fear during COVID-19: essentializing religion in an Indian context
Biswas, D., Chatterjee, S., & Sultana, P. (2021) · Humanities and Social Sciences Communications · doi:10.1057/s41599-021-00808-8 · Cited by 23
Malik, P., Kumar, J., Singh, S., Sharma, S., Meher, P. K., Sharma, M. K., Roy, J. K., Sharma, P. K., Balyan, H. S., Gupta, P. K., et al. (2021) · Molecular Breeding · doi:10.1007/s11032-021-01240-1 · Cited by 22
Review of in vitro mechanical testing for intervertebral disc injectable biomaterials
Dixon, A. R., Warren, J. P., Culbert, M. P., Mengoni, M., & Wilcox, R. K. (2021) · Journal of the mechanical behavior of biomedical materials/Journal of mechanical behavior of biomedical materials · doi:10.1016/j.jmbbm.2021.104703 · Cited by 21
Nettle, D., & Saxe, R. R. (2021) · Collabra Psychology · doi:10.1525/collabra.28105 · Cited by 20
Albarello, F., Mula, S., Contu, F., Baldner, C., Kruglanski, A. W., & Pierro, A. (2023) · International Journal of Intercultural Relations · doi:10.1016/j.ijintrel.2023.101755 · Cited by 19
Negative social tipping dynamics resulting from and reinforcing Earth system destabilization
Spaiser, V., Juhola, S. K., Constantino, S. M., Guo, W., Watson, T., Sillmann, J., Craparo, A., Basel, A. M., Bruun, J. T., Krishnamurthy, P. K., et al. (2024) · Earth System Dynamics · doi:10.5194/esd-15-1179-2024 · Cited by 28
van de Ven, V. G., Lee, C., Lifanov, J., Kochs, S., Jansma, H., & Weerd, P. D. (2020) · Hippocampus · doi:10.1002/hipo.23205 · Cited by 20
How much cultural variation around the globe is explained by ecology?Preprint
Wormley, A. S., Kwon, J. Y., Barlev, M., & Varnum, M. E. W. (2022) · PsyArXiv (OSF Preprints) · doi:10.31234/osf.io/84xjg · Cited by 19
Kwon, J. Y., Wormley, A. S., & Varnum, M. E. W. (2021) · Biological Psychology · doi:10.1016/j.biopsycho.2021.108087 · Cited by 23
Gilliam, A. N., Schwartz, D. B., Godoy, R., Boduroğlu, A., & Gutchess, A. H. (2022) · Journal of Cross-Cultural Psychology · doi:10.1177/00220221221077710 · Cited by 18
Threat, Tightness, and the Evolutionary Appeal of Populist Leaders
Gelfand, M. J., & Lorente, R. (2021) · Routledge eBooks · doi:10.4324/9781003057680-18 · Cited by 18
Self-citationWenger, M. R., & Lantz, B. (2021) · Victims & Offenders · doi:10.1080/15564886.2021.1974136 · Cited by 17
Mula, S., Santo, D. D., Gelfand, M. J., Cabras, C., & Pierro, A. (2021) · Frontiers in Psychology · doi:10.3389/fpsyg.2021.713952 · Cited by 17
Self-citationBonacolta, A. M., Connelly, M. T., Rosales, S., del Campo, J., & Traylor‐Knowles, N. (2021) · FEMS Microbiology Letters · doi:10.1093/femsle/fnab002 · Cited by 15
Pasquini, L., Napoli, A. D., Napolitano, A., Lucignani, M., Dellepiane, F., Vidiri, A., Villani, V., Romano, A., & Bozzao, A. (2021) · Journal of Neuroimaging · doi:10.1111/jon.12903 · Cited by 16
Grigoryev, D. (2022) · Cross-Cultural Research · doi:10.1177/10693971221080618 · Cited by 12
Freeing the brake: Proliferation needs primary cilium to disassemble
Halder, P., Khatun, S., & Majumder, S. (2020) · Journal of Biosciences · doi:10.1007/s12038-020-00090-x · Cited by 14
Baldner, C., Santo, D. D., Viola, M., & Pierro, A. (2022) · International Journal of Environmental Research and Public Health · doi:10.3390/ijerph19042364 · Cited by 15
Measuring Racial Discrimination Remotely: A Contemporary Review of Unobtrusive Measures
Kellar, S. J., & Hall, E. V. (2022) · Perspectives on Psychological Science · doi:10.1177/17456916211045691 · Cited by 14
The Moral Foundations of Desired Cultural Tightness
Santo, D. D., Gelfand, M. J., Baldner, C., & Pierro, A. (2022) · Frontiers in Psychology · doi:10.3389/fpsyg.2022.739579 · Cited by 14
Self-citationContu, F., Ellenberg, M. D., Kruglanski, A. W., Pantaleo, G., & Pierro, A. (2023) · Current Psychology · doi:10.1007/s12144-023-05260-2 · Cited by 14
Vargas, J. A. H., Barbosa, P. X. R., Valbuena‐Garcia, A. M., Acuña-Merchán, L. A., González-Diaz, J. A., & Lopes, G. D. L., Jr. (2021) · JCO Global Oncology · doi:10.1200/go.21.00155 · Cited by 15
Four Decades of Challenges by Culture to Mainstream Psychology: Finding Ways Forward
Smith, P. B., & Bond, M. H. (2022) · Journal of Cross-Cultural Psychology · doi:10.1177/00220221221084041 · Cited by 20
Mobile Internet and the Rise of Communitarian PoliticsPreprint
Manacorda, M., Tabellini, G., & Tesei, A. (2023) · SSRN Electronic Journal · doi:10.2139/ssrn.4411693 · Cited by 14
Lopez, H. N., Devos, T., & Somo, A. (2021) · Current Research in Ecological and Social Psychology · doi:10.1016/j.cresp.2021.100033 · Cited by 13
The effects of COVID-19 on perceived intergroup competition and negative intergroup outcomes
Gordils, J., Elliot, A. J., Toprakkiran, S., & Jamieson, J. P. (2021) · The Journal of Social Psychology · doi:10.1080/00224545.2021.1918617 · Cited by 14
Albarello, F., Contu, F., Baldner, C., Vecchione, M., Ellenberg, M. D., Kruglanski, A. W., & Pierro, A. (2023) · International Journal of Intercultural Relations · doi:10.1016/j.ijintrel.2023.101885 · Cited by 14
Cultural Beliefs About Manhood Predict Anti-LGBTQ+ Attitudes and Policies
Vandello, J. A., Upton, R. A., Wilkerson, M., Kubicki, R., & Kosakowska‐Berezecka, N. (2023) · Sex Roles · doi:10.1007/s11199-023-01365-x · Cited by 12
Anijs, T., Eemers, S., Minoda, Y., Wolfson, D., Verdonschot, N. J. J., & Janssen, D. W. (2021) · Journal of Biomedical Materials Research Part B Applied Biomaterials · doi:10.1002/jbm.b.34957 · Cited by 12
Mobile Internet and the Rise of Political Tribalism in EuropePreprint
Manacorda, M., Tabellini, G., & Tesei, A. (2022) · Social Science Research Network · doi:10.2139/ssrn.4235470 · Cited by 6
How is the behavioral immune system related to hygiene behaviors?
Wormley, A. S., & Varnum, M. E. W. (2022) · Current Research in Ecological and Social Psychology · doi:10.1016/j.cresp.2022.100081 · Cited by 12
Krüger, S. (2020) · Journal of Archaeological Science Reports · doi:10.1016/j.jasrep.2020.102370 · Cited by 10
Albarello, F., Moscatelli, S., Menegatti, M., Lucidi, F., Cavicchiolo, E., Manganelli, S., Diotaiuti, P., Chirico, A., & Alivernini, F. (2023) · Social Sciences · doi:10.3390/socsci13010024 · Cited by 10
Wang, X., Mo, Q. L., Chen, H., & Klein, V. (2024) · Sex Roles · doi:10.1007/s11199-024-01511-z · Cited by 13
Zingora, T., Birtel, M. D., Graf, S., Hřebı́čková, M., Lacko, D., Rupar, M., Točík, J., & Voca, S. (2022) · European Journal of Social Psychology · doi:10.1002/ejsp.2928 · Cited by 10
Gaitho, D., Kinoti, F., Mwaniki, L., Kemunto, D., Ogoti, V., Njigua, C., Kubo, E. N., Langat, A., & Mecha, J. O. (2021) · BMC Public Health · doi:10.1186/s12889-021-10587-1 · Cited by 10
Vagus nerve bundle stimulation using 1505‐nm laser irradiation in an in‐vivo rat model
Yetis, O., Güner, Ö., Akkaya, İ., Güneli, E., Bağrıyanık, A., & Tozburun, S. (2021) · Journal of Biophotonics · doi:10.1002/jbio.202100197 · Cited by 10
Potoczek, A., Bukowski, M., Jaśko, K., Czepluch, F., Fritsche, I., Jugert, P., & Kossowska, M. (2022) · Journal of Experimental Social Psychology · doi:10.1016/j.jesp.2022.104352 · Cited by 10
Contu, F., Santo, D. D., Baldner, C., & Pierro, A. (2023) · Sustainability · doi:10.3390/su15031865 · Cited by 7
Health workers as Hate Crimes Targets during COVID-19 outbreak in the Americas
Orellana, C. I. (2020) · Revista de Salud Pública · doi:10.15446/rsap.v22n2.86766 · Cited by 9
Ikizer, E. G., Fischer, R. D., Kunst, J. R., & Dovidio, J. F. (2024) · Personality and Social Psychology Bulletin · doi:10.1177/01461672241273285 · Cited by 7
Self-citationLiu, R. W., Zhuang, J., & Li, X. (2025) · Journal of Intercultural Communication Research · doi:10.1080/17475759.2025.2573283 · Cited by 6
Mula, S., & Pierro, A. (2022) · Frontiers in Psychology · doi:10.3389/fpsyg.2022.951852 · Cited by 6
Torelli, C. J., Shen, J. (., & Rodas, M. A. (2024) · Oxford University Press eBooks · doi:10.1093/oxfordhb/9780190085384.013.22 · Cited by 6
da Silva, R. B. Z., Fogliatto, F. S., Krindges, A., & Cecconello, M. D. S. (2021) · BMC Health Services Research · doi:10.1186/s12913-021-06918-y · Cited by 7
Brons, L. L. (2022) · Punctum Books · doi:10.53288/0373.1.00 · Cited by 5
Validation of the Chinese Cultural Tightness–Looseness Scale and General Tightness–Looseness Scale
Leng, J., Ma, H., Lv, X., & Hu, P. (2023) · Frontiers in Psychology · doi:10.3389/fpsyg.2023.1131868 · Cited by 5
de Melo, E. H., Gomes, H. M., Suffys, P. N., Lopes, M. Q. P., Teixeira, R. L. D. F., dos Santos, Í. R., Franco, M. M. J., Langoni, H., Paes, A. C., Afonso, J. A. B., et al. (2021) · Frontiers in Veterinary Science · doi:10.3389/fvets.2021.747226 · Cited by 5
Santo, D. D., Santo, D. D., & Pierro, A. (2023) · Journal of Community & Applied Social Psychology · doi:10.1002/casp.2760 · Cited by 5
Spectroscopic and deep learning-based approaches to identify and quantify cerebral microhemorrhages
Crouzet, C., Jeong, G., Chae, R. H., LoPresti, K., Dunn, C. E., Xie, D. F., Agu, C. S., Fang, C., Nunes, A. C. F., Lau, W. L., et al. (2021) · Scientific Reports · doi:10.1038/s41598-021-88236-1 · Cited by 6
At the roots of attribution of human rights to migrants
Albarello, F., & Rubini, M. (2022) · Frontiers in Psychology · doi:10.3389/fpsyg.2022.1046616 · Cited by 5
Fog, A. (2023) · Culture and Evolution · doi:10.1556/2055.2023.00029 · Cited by 4
Murakami, M., Hiraishi, K., Yamagata, M., Nakanishi, D., Ortolani, A., Mifune, N., Li, Y., & Miura, A. (2023) · PeerJ · doi:10.7717/peerj.16147 · Cited by 4
Life is viewed as better for minorities in places with more variable habitats
de Vliert, E. V., Joshanloo, M., Conway, L. G., Kluwer, E. S., & Lange, P. A. M. V. (2025) · PLoS ONE · doi:10.1371/journal.pone.0322084 · Cited by 4
Zhang, X., English, A. S., Kulich, S. J., & Chen, Y. (2023) · Social and Personality Psychology Compass · doi:10.1111/spc3.12793 · Cited by 4
Worldwide Divergence of ValuesPreprint
Jackson, J. C., & Medvedev, D. (2023) · doi:10.31234/osf.io/4nh95 · Cited by 4
Self-citationWormley, A. S., Vornlocher, C., Baldwin, C. R., & Rodriguez, M. (2025) · Scientific Reports · doi:10.1038/s41598-025-12672-6 · Cited by 7
Normative climates and immigration: A societal psychology approach
Green, E. G. T., Gale, J., & Kende, J. (2026) · European Review of Social Psychology · doi:10.1080/10463283.2026.2638710 · Cited by 3
Delitos de odio. Incidencia de la pandemia COVID en los delitos de odio en España
Pérez, S. G. (2022) · Sociología y Tecnociencia · doi:10.24197/st.1.2022.216-240 · Cited by 3
Lin, K., Mumtaz, A., Rahaman, M. A., & Mok, K. H. (2021) · Frontiers in Public Health · doi:10.3389/fpubh.2021.614476 · Cited by 3
Zingora, T., Graf, S., Hřebı́čková, M., Točík, J., Lacko, D., Birtel, M. D., Voca, S., & Rupar, M. (2021) · doi:10.31234/osf.io/ry7se · Cited by 3
Seeing Religious Faith as Essential to Morality Predicts Deconversion Guilt
Bounds, E. M., Abrams, S., Jackson, J. C., Vonasch, A. J., & Gray, K. J. (2025) · International Journal for the Psychology of Religion · doi:10.1080/10508619.2025.2491893 · Cited by 3
Self-citationMobilizing against the disadvantaged: Unraveling the dynamics of anti-minority collective action
Guvensoy, I., Bağci, S. Ç., & Yurt, D. (2025) · European Review of Social Psychology · doi:10.1080/10463283.2025.2498283 · Cited by 4
Historical psychology: How the events of yesterday shaped the minds of today
Jackson, J. C., & Atari, M. (2025) · Current Research in Ecological and Social Psychology · doi:10.1016/j.cresp.2025.100247 · Cited by 4
Self-citationPutting Climate into Context: How Culture and Composition Shape the Effects of Diversity Climate
Hall, A. V., Avery, D. R., Gelfand, M. J., & McKay, P. F. (2025) · Organization Science · doi:10.1287/orsc.2022.16752 · Cited by 3
Self-citationThe cultural evolution of pluralistic ignorance
Gavrilets, S., Karl, J. A., & Gelfand, M. J. (2026) · Proceedings of the National Academy of Sciences · doi:10.1073/pnas.2522998123 · Cited by 4
Self-citationBaldner, C., & Pierro, A. (2024) · Frontiers in Psychology · doi:10.3389/fpsyg.2024.1340152 · Cited by 2
McGovern, H. T., Nitschinsk, L., O’Shea, B. A., Murray, D. R., & Blake, K. R. (2024) · Evolutionary Psychological Science · doi:10.1007/s40806-024-00407-1 · Cited by 2
Greater Bias Toward Transgender People Compared to Gay Men and Lesbian Women Is WEIRD
Napier, J. L. (2025) · Social Psychological and Personality Science · doi:10.1177/19485506251352242 · Cited by 2
Prislei, L., Marini, M., Cicco, G. D., Parisse, C., & Livi, S. (2024) · International Journal of Intercultural Relations · doi:10.1016/j.ijintrel.2024.102056 · Cited by 2
Metadata
- Authors
- Jackson, J. C., van Egmond, M., Choi, V. K., Ember, C. R., Halberstadt, J., Balanovic, J., Basker, I. N., Boehnke, K., Buki, N., Fischer, R., Fulop, M., Fulmer, A., Homan, A. C., van Kleef, G. A., Kreemers, L., Schei, V., Szabo, E., Ward, C., & Gelfand, M. J.
- Affiliations
- University of North Carolina at Chapel Hill (US)
- University of Maryland, College Park (US)
- Yale University (US)
- University of Otago (NZ)
- Victoria University of Wellington (NZ)
- Norwegian School of Economics (NO)
- National Research University Higher School of Economics (RU)
- Georgia State University (US)
- University of Amsterdam (NL)
- Johannes Kepler University of Linz (AT)
- Corresponding author
- Jackson, Joshua Conrad
- Gelfand, Michele J.
- ORCID
- Venue
- PLOS ONE
- Publisher
- Public Library of Science (PLoS)
- Published
- 2019-09-06
- Volume
- 14
- Issue
- 9
- Pages
- e0221953
- ISSN
- 1932-6203 (ISSN-L)
- PMC
- PMC6730889
- OpenAlex
- W2971921871
- Semantic Scholar
- de4913570576094714035d8ee0524e4c062b3bb7
- Cited by
- 144
- References
- 59
- Citations by year
- 2026: 11 · 2025: 15 · 2024: 18 · 2023: 20 · 2022: 30 · 2021: 34 · 2020: 14 · 2019: 2
- FWCI
- 40.18
- Type
- journal article
- Language
- en
- Open access
- gold
- doi.org
- Licence
- Locations
- PLoS ONE (publishedVersion, cc-by)
- Europe PMC (PubMed Central) (publishedVersion, cc-by)
- PubMed Central (publishedVersion, cc-by)
- PubMed (publishedVersion)
- Repository of the Academy's Library (Library of the Hungarian Academy of Sciences) (acceptedVersion)
- Data Archiving and Networked Services (DANS) (submittedVersion, other-oa)
- RePEc: Research Papers in Economics (submittedVersion)
- UvA-DARE (University of Amsterdam) (submittedVersion, cc-by)
- DOAJ (DOAJ: Directory of Open Access Journals) (submittedVersion, cc-by-sa)
- ELTE Digital Institutional Repository (EDIT) (Eötvös Loránd University) (submittedVersion, other-oa)
- NORA - Norwegian Open Research Archives (submittedVersion, cc-by)
- OSF Preprints (OSF Preprints) (submittedVersion)
- Funders
- National Science Foundation
- Royster Society of Fellows
- Topics
- Social Sciences › Sociology and Political Science › Social and Intergroup Psychology
- Social Sciences › Psychology › Social Psychology › Cultural Differences and Values
- Social Sciences › Psychology › Experimental and Cognitive Psychology › Evolutionary Psychology and Human Behavior
- Keywords
- prejudice, cultural tightness, ecological threats, political nationalism, religious prejudice, national prejudice, sexual orientation prejudice, cultural evolution, intergroup conflict, immigration, radicalization, cultural norms
- MeSH terms
- Culture, Humans, Politics, Prejudice, Internationality, Ecological and Environmental Phenomena
About these checks
Registry, retraction, Cites and statistics results are computed, not judged, with one exception: a printed reference that no index lists is read once by a model before it counts as a citation error. Claims are extracted by a model and kept only when their quote appears verbatim in the text; each cited source is then checked, with a model’s help, for whether it says what the claim relies on. Those verdicts can be wrong — read the claim’s quote and the cited source before relying on one.
A language model drew the claims from the paper on 2026-10-09, under version 3 of the claim definition (model deepseek-v4.1-flash, prompt extract-v3).
A second model labelled each claim on 2026-10-09 (model jev-1.13-20260917, definition revision gold-guideline-v0.2).
Statistics and arithmetic are recomputed, not judged.
Confidence bands are shown only for fields calibrated on our annotated test set. None is calibrated yet, so no band is shown.
What counts as a claim ›How we measure confidence ›How we check this ›
Are you an author, or do you see a problem with this page? Request a review
