

The DOI matches its Crossref record; 33 of the 33 references it cites were found in a registry or an index.
Inter- and intraindividual variability in daily resting heart rate and its associations with age, sex, sleep, BMI, and time of year: Retrospective, longitudinal cohort study of 92,457 adults
Open accessAbstract
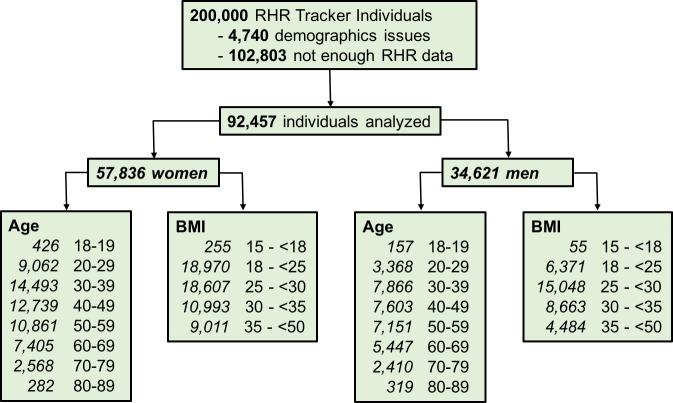
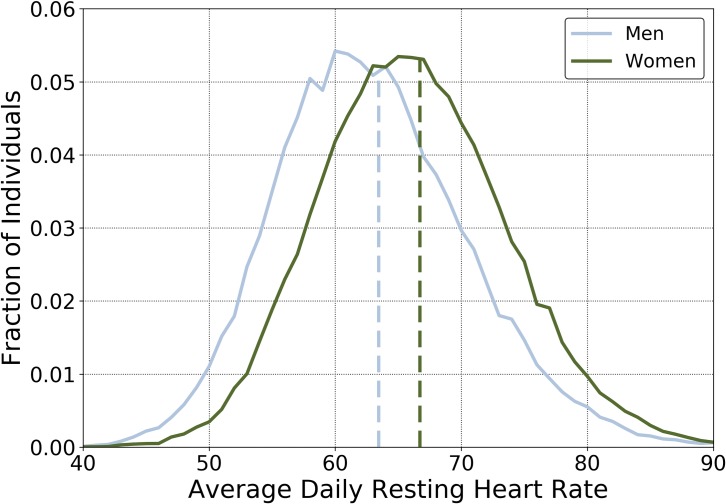
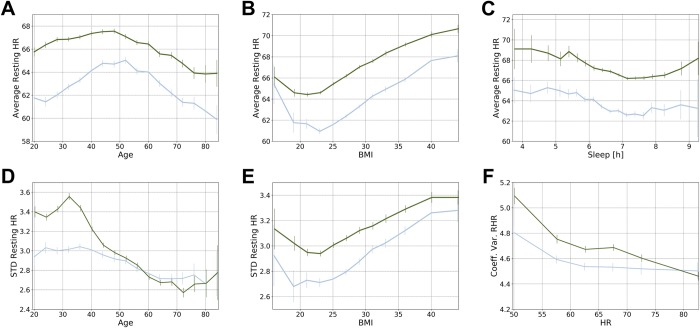
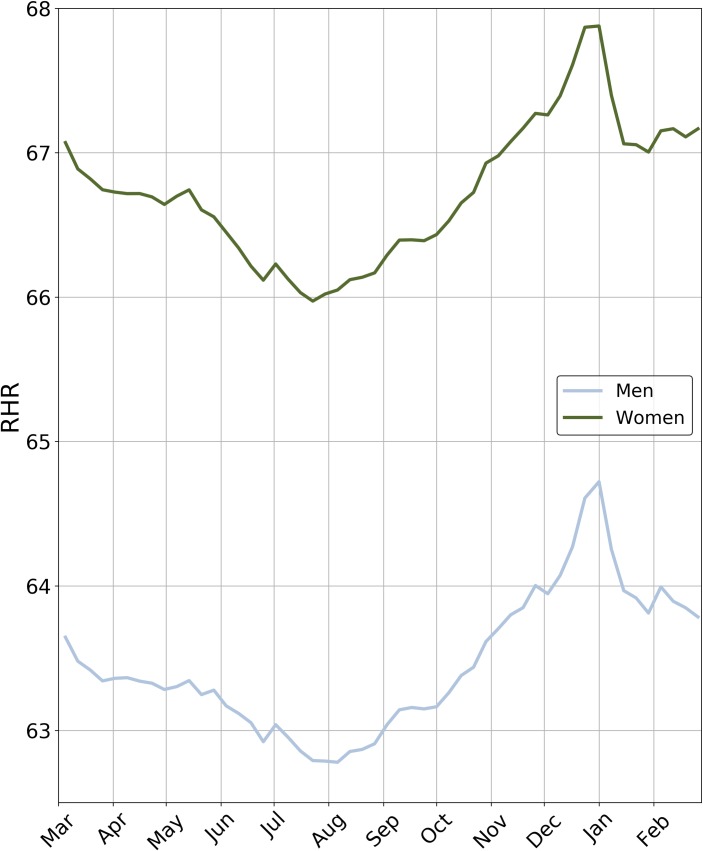
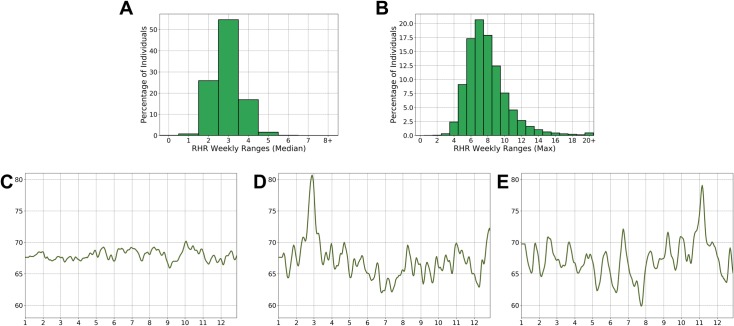
BACKGROUND: Heart rate is routinely measured as part of the clinical examination but is rarely acted upon unless it is well outside a population-based normal range. With wearable sensor technologies, heart rate can now be continuously measured, making it possible to accurately identify an individual's "normal" heart rate and potentially important variations in it over time. Our objective is to describe inter- and intra-individual variability in resting heart rate (RHR) collected over the course of two years using a wearable device, studying the variations of resting heart rate as a function of time of year, as well as individuals characteristics like age, sex, average sleep duration, and body mass index (BMI). METHODS AND FINDINGS: Our retrospective, longitudinal cohort study includes 92,457 de-identified individuals from the United States (all 50 states), who consistently-over at least 35 weeks in the period from March 2016 to February 2018, for at least 2 days per week, and at least 20 hours per day-wore a heart rate wrist-worn tracker. In this study, we report daily RHR and its association with age, BMI, sex, and sleep duration, and its variation over time. Individual daily RHR was available for a median of 320 days, providing nearly 33 million daily RHR values. We also explored the range in daily RHR variability between individuals, and the long- and short-term changes in the trajectory of an individual's daily RHR. Mean daily RHR was 65 beats per minute (bpm), with a range of 40 to 109 bpm among all individuals. The mean RHR differed significantly by age, sex, BMI, and average sleep duration. Time of year variations were also noted, with a minimum in July and maximum in January. For most subjects, RHR remained relatively stable over the short term, but 20% experienced at least 1 week in which their RHR fluctuated by 10 bpm or more. CONCLUSIONS: Individuals have a daily RHR that is normal for them but can differ from another individual's normal by as much as 70 bpm. Within individuals, RHR was much more consistent over time, with a small but significant seasonal trend, and detectable discrete and infrequent episodes outside their norms.
Overview
The claims and statistics of this paper haven’t been checked yet.
Run the check — free, no account needed. It reads the open-access text and checks the sources it cites.
Integrity signals
Registry
Cites
Statistics
Figures
Verification
Claims the paper makes
The claims and statistics of this paper haven’t been checked yet.
Run the check — free, no account needed. It reads the open-access text and checks the sources it cites.
Claims other papers make about this one
Each is checked against this paper’s own text: does it say what the citing paper says it does?
In the citing paper
“Moreover, longitudinal HR data can establish what is normal for an individual and, subsequently, recognize important deviations in lifestyle earlier, before cardiovascular disease develops46.”
From Smart wearable devices in cardiovascular care: Where we are and how to move forward (2021) · cites this paper as [46]
Self-check
Percentages, sums and reported differences re-computed from the paper’s own numbers.
The self-check needs the paper’s full text.
Citations
Cites
Large-Scale Assessment of a Smartwatch to Identify Atrial Fibrillation
Perez, M. V., Mahaffey, K. W., Hedlin, H., Rumsfeld, J. S., Garcia, A., Ferris, T., Balasubramanian, V., Russo, A. M., Rajmane, A., Cheung, L., et al. (2019) · New England Journal of Medicine · doi:10.1056/nejmoa1901183 · Cited by 1,917
Böhm, M., Swedberg, K. B., Michel Komajda, N., BORER, J. S., Ford, I., Dubost-Brama, A., Lerebours, G., & Tavazzi, L. (2010) · The Lancet · doi:10.1016/s0140-6736(10)61259-7 · Cited by 1,100
Diaz, A., Bourassa, M. G., Guertin, M.-C., & Tardif, J.-C. (2005) · European Heart Journal · doi:10.1093/eurheartj/ehi190 · Cited by 790
Fox, K., Ford, I., Steg, P. G., Tendera, M., Robertson, M., & Ferrari, R. (2008) · The Lancet · doi:10.1016/s0140-6736(08)61171-x · Cited by 789
Shcherbina, A., Mattsson, C., Waggott, D., Salisbury, H., Christle, J., Hastie, T., Wheeler, M., & Ashley, E. (2017) · Journal of Personalized Medicine · doi:10.3390/jpm7020003 · Cited by 625
Influence of heart rate on mortality among persons with hypertension: The Framingham Study
Gillman, M. W., Kannel, W. B., Belanger, A. J., & D’Agostino, R. B. (1993) · American Heart Journal · doi:10.1016/0002-8703(93)90128-v · Cited by 622
Wearable sensors for monitoring the physiological and biochemical profile of the athlete
Seshadri, D. R., Li, R. T., Voos, J. E., Rowbottom, J. R., Alfes, C. M., Zorman, C. A., & Drummond, C. K. (2019) · npj Digital Medicine · doi:10.1038/s41746-019-0150-9 · Cited by 537
A Longitudinal Big Data Approach for Precision Health
Schüssler-Fiorenza Rose, S. M., Contrepois, K., Moneghetti, K. J., Zhou, W., Mishra, T., Mataraso, S., Dagan-Rosenfeld, O., Ganz, A. B., Dunn, J., Hornburg, D., et al. (2019) · Nature Medicine · doi:10.1038/s41591-019-0414-6 · Cited by 494
Li, X., Dunn, J., Salins, D., Zhou, G., Zhou, W., Schüssler-Fiorenza Rose, S. M., Perelman, D., Colbert, E., Runge, R., Rego, S., et al. (2017) · PLOS Biology · doi:10.1371/journal.pbio.2001402 · Cited by 431
Cooney, M. T., Vartiainen, E. A., Laakitainen, T., Juolevi, A., Dudina, A. L., & Graham, I. M. (2010) · American Heart Journal · doi:10.1016/j.ahj.2009.12.029 · Cited by 416
Accuracy of wrist-worn heart rate monitors
Wang, R., Blackburn, G., Desai, M., Phelan, D., Gillinov, L., Houghtaling, P., & Gillinov, M. (2017) · JAMA Cardiology · doi:10.1001/jamacardio.2016.3340 · Cited by 386
Influence of Heart Rate on Mortality in a French Population: Role of Age, Gender, and Blood Pressure
Benetos, A., Rudnichi, A., Thomas, F., Safar, M., & Guize, L. (1999) · Hypertension · doi:10.1161/01.hyp.33.1.44 · Cited by 356
Accuracy of Heart Rate Watches: Implications for Weight Management
Wallen, M. P., Gomersall, S. R., Keating, S. E., Wisløff, U., & Coombes, J. S. (2016) · PLOS ONE · doi:10.1371/journal.pone.0154420 · Cited by 336
Kolloch, R. E., Legler, U. F., Champion, A., COOPERDEHOFF, R., Handberg, E. M., Zhou, Q., & Pepine, C. J. (2007) · European Heart Journal · doi:10.1093/eurheartj/ehn123 · Cited by 330
Palatini, P., Casiglia, E., Julius, S., & Pessina, A. C. (1999) · Archives of Internal Medicine · doi:10.1001/archinte.159.6.585 · Cited by 269
Resting Heart Rate: Risk Indicator and Emerging Risk Factor in Cardiovascular Disease
Böhm, M., Reil, J.-C., Deedwania, P., Kim, J. B., & Borer, J. S. (2015) · The American Journal of Medicine · doi:10.1016/j.amjmed.2014.09.016 · Cited by 236
de Zambotti, M., Baker, F. C., Willoughby, A. R., Godino, J. G., Wing, D., Patrick, K., & Colrain, I. M. (2016) · Physiology & Behavior · doi:10.1016/j.physbeh.2016.03.006 · Cited by 222
Heart Rate as a Predictor of Mortality: The MATISS Project
Seccareccia, F., Pannozzo, F., Dima, F., Minoprio, A., Menditto, A., Lo Noce, C., & Giampaoli, S. (2001) · American Journal of Public Health · doi:10.2105/ajph.91.8.1258 · Cited by 201
Heart rate, ischaemic heart disease, and sudden cardiac death in middle-aged British men.
Shaper, A. G., Wannamethee, G., Macfarlane, P. W., & Walker, M. (1993) · Heart · doi:10.1136/hrt.70.1.49 · Cited by 196
Temporal changes in resting heart rate and deaths from ischemic heart disease
Nauman, J., Janszky, I., Vatten, L. J., & Wisløff, U. (2011) · JAMA · doi:10.1001/jama.2011.1826 · Cited by 181
(2011) · PubMed · Cited by 159
The Accuracy of Heart Rate Monitoring by Some Wrist-Worn Activity Trackers
Cadmus‐Bertram, L., Gangnon, R. E., Wirkus, E. J., Thraen-Borowski, K. M., & Gorzelitz, J. (2017) · Annals of Internal Medicine · doi:10.7326/l16-0353 · Cited by 80
Vazir, A., Claggett, B. L., Jhund, P. S., Castagno, D., Skali, H., Yusuf, S., Swedberg, K. B., Granger, C. B., McMurray, J. J. V., Pfeffer, M. A., et al. (2014) · European Heart Journal · doi:10.1093/eurheartj/ehu401 · Cited by 77
Vazir, A., Claggett, B. L., Cheng, S. C., Skali, H., Shah, A. M., Agulair, D., Ballantyne, C. M., Vardeny, O., & Solomon, S. D. (2018) · JAMA Cardiology · doi:10.1001/jamacardio.2017.4974 · Cited by 57
Huffaker, M. F., Carchia, M., Harris, B., Kethman, W. C., Murphy, T. E., Sakarovitch, C., Qin, F., & Cornfield, D. N. (2018) · American Journal of Respiratory and Critical Care Medicine · doi:10.1164/rccm.201712-2606oc · Cited by 53
Accuracy of Heart Rate Monitoring by Some Wrist-Worn Activity Trackers
Cadmus‐Bertram, L., Gangnon, R. E., Wirkus, E. J., Thraen-Borowski, K. M., & Gorzelitz, J. (2017) · Annals of Internal Medicine · doi:10.7326/l17-0380 · Cited by 21
Tian, J., Yuan, Y. L., Shen, M., Zhang, X., He, M., Guo, H., Yang, H., & Wu, T. (2019) · Scientific Reports · doi:10.1038/s41598-019-43045-5 · Cited by 18
Investigation of an estimate of daily resting heart rate using a consumer wearable devicePreprint
Russell, A., Heneghan, C., & Venkatraman, S. S. (2019) · medRxiv · doi:10.1101/19008771 · Cited by 18
Kim, G., Lee, Y., Jeon, J. Y., Bang, H., Lee, B., Kang, E. S., Lee, I. K., Cha, B.-S., & Kim, C. S. (2016) · Diabetes & Metabolism · doi:10.1016/j.diabet.2016.09.002 · Cited by 16
The future of individualized health maintenance
Steinhubl, S. R. (2019) · Nature Medicine · doi:10.1038/s41591-019-0443-1 · Cited by 8
Self-citationLong data from the electrocardiogram
Quer, G., Muse, E. D., Topol, E. J., & Steinhubl, S. R. (2019) · The Lancet · doi:10.1016/s0140-6736(19)31186-9 · Cited by 8
Self-citationAccuracy of Heart Rate Monitoring by Some Wrist-Worn Activity Trackers
Singh, J., & Sittig, D. F. (2017) · Annals of Internal Medicine · doi:10.7326/l17-0379 · Cited by 6
A novel contact free sensor for the prediction of ovulation and fertile window
Maman, E., Segal, E. M., Sarda, Y., Baum, M., & Hourvitz, A. (2017) · Fertility and Sterility · doi:10.1016/j.fertnstert.2017.07.992 · Cited by 2
Cited by
Sorted by citations
Smart wearable devices in cardiovascular care: Where we are and how to move forward
Bayoumy, K., Gaber, M., Elshafeey, A., Mhaimeed, O., Dineen, E. H., Marvel, F. A., Martin, S. S., Muse, E. D., Turakhia, M. P., Tarakji, K. G., et al. (2021) · Nature Reviews Cardiology · doi:10.1038/s41569-021-00522-7 · Cited by 829
Wearable sensor data and self-reported symptoms for COVID-19 detection
Quer, G., Radin, J. M., Gadaleta, M., Baca-Motes, K., Ariniello, L., Ramos, E., Kheterpal, V., Topol, E. J., & Steinhubl, S. R. (2021) · Nature Medicine · doi:10.1038/s41591-020-1123-x · Cited by 447
Self-citationThe impact of wearable technologies in health research: scoping review
Huhn, S., Axt, M., Gunga, H.-C., Maggioni, M. A., Munga, S., Obor, D., Sié, A., Boudo, V., Bunker, A., Sauerborn, R., et al. (2022) · JMIR mHealth and uHealth · doi:10.2196/34384 · Cited by 379
Wearable Photoplethysmography for Cardiovascular Monitoring
Charlton, P. H., Kyriacou, P. A., Mant, J., Marozas, V., Chowienczyk, P., & Alastruey, J. (2022) · Proceedings of the IEEE · doi:10.1109/jproc.2022.3149785 · Cited by 250
Wearable Devices: Implications for Precision Medicine and the Future of Health Care
Babu, M., Lautman, Z., Lin, X., Sobota, M. H. B., & Snyder, M. P. (2023) · Annual Review of Medicine · doi:10.1146/annurev-med-052422-020437 · Cited by 206
Metadata
- Authors
- Quer, G., Gouda, P., Galarnyk, M., Topol, E. J., & Steinhubl, S. R.
- Affiliations
- University of Alberta (CA)
- Corresponding author
- Quer, Giorgio
- Venue
- PLOS ONE
- Publisher
- Public Library of Science (PLoS)
- Published
- 2020-02-05
- Volume
- 15
- Issue
- 2
- Pages
- e0227709
- ISSN
- 1932-6203 (ISSN-L)
- PMC
- PMC7001906
- OpenAlex
- W3005497886
- Cited by
- 185
- References
- 33
- Citations by year
- 2026: 17 · 2025: 33 · 2024: 33 · 2023: 29 · 2022: 38 · 2021: 25 · 2020: 10
- FWCI
- 15.77
- Type
- journal article
- Language
- en
- Open access
- gold
- doi.org
- Licence
- Locations
- PLoS ONE (publishedVersion, cc-by)
- Europe PMC (PubMed Central) (publishedVersion, cc-by)
- PubMed Central (publishedVersion, cc-by)
- PubMed (publishedVersion)
- RePEc: Research Papers in Economics (submittedVersion)
- DOAJ (DOAJ: Directory of Open Access Journals) (submittedVersion, cc-by-sa)
- eScholarship (California Digital Library) (submittedVersion, cc-by)
- Funders
- National Center for Advancing Translational Sciences (UL1TR001114)
- Topics
- Health Sciences › Medicine › Cardiology and Cardiovascular Medicine › Heart Rate Variability and Autonomic Control
- Health Sciences › Medicine › Public Health, Environmental and Occupational Health › Physical Activity and Health
- Physical Sciences › Engineering › Biomedical Engineering › Non-Invasive Vital Sign Monitoring
- Keywords
- resting heart rate, interindividual variability, within-person variability, seasonal variation, sleep duration, body mass index, age and sex differences
- MeSH terms
- Adolescent, Adult, Age Factors, Aged, Aged, 80 and over, Female, Heart Rate, Humans, Longitudinal Studies, Male, Middle Aged, Rest, Retrospective Studies, Seasons, Sex Factors, Sleep, Body Mass Index, Young Adult
About these checks
Registry, retraction, Cites and statistics results are computed, not judged, with one exception: a printed reference that no index lists is read once by a model before it counts as a citation error. Claims are extracted by a model and kept only when their quote appears verbatim in the text; each cited source is then checked, with a model’s help, for whether it says what the claim relies on. Those verdicts can be wrong — read the claim’s quote and the cited source before relying on one.
Statistics and arithmetic are recomputed, not judged.
Confidence bands are shown only for fields calibrated on our annotated test set. None is calibrated yet, so no band is shown.
What counts as a claim ›How we measure confidence ›How we check this ›
Are you an author, or do you see a problem with this page? Request a review
