

The DOI matches its Crossref record; 44 of the 45 references it cites were found in a registry or an index.
Influence of COVID-19 confinement on students’ performance in higher education
Open accessAbstract
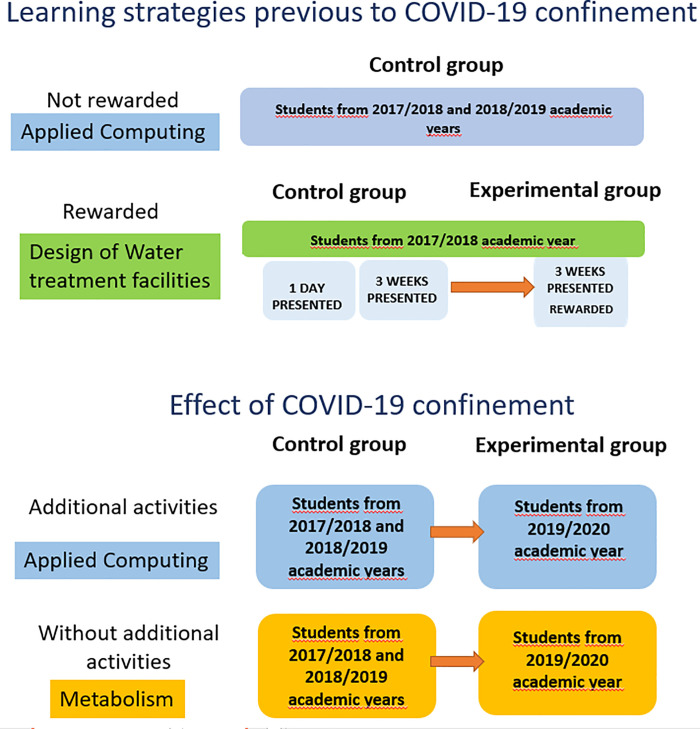
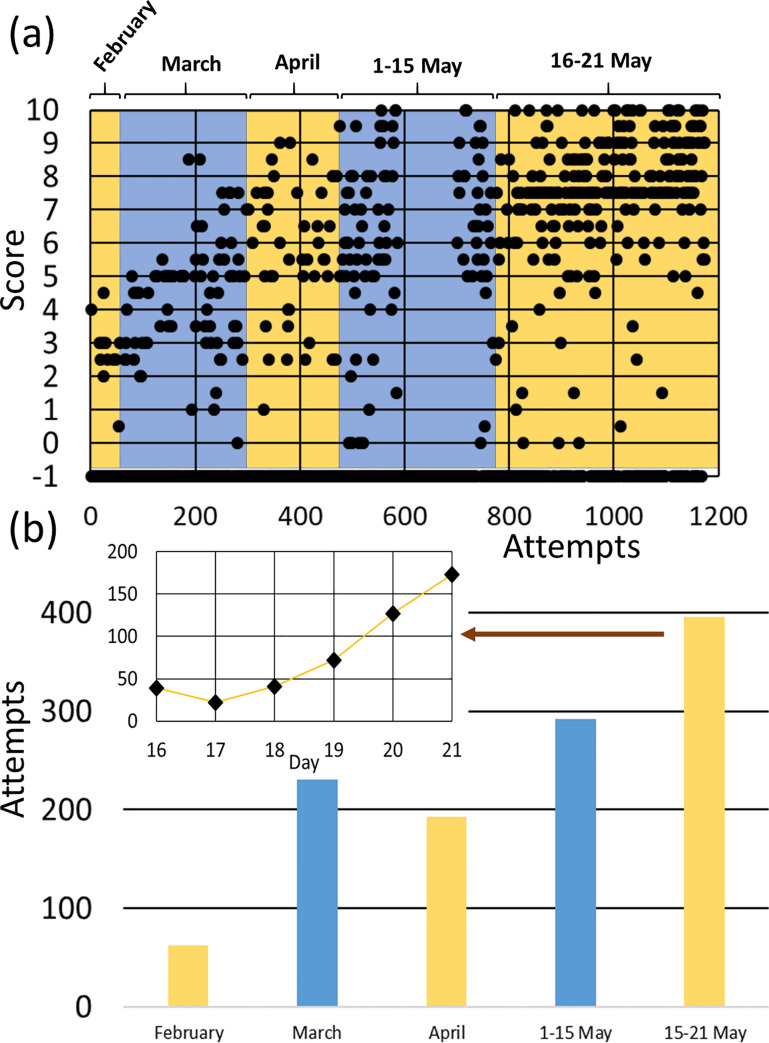
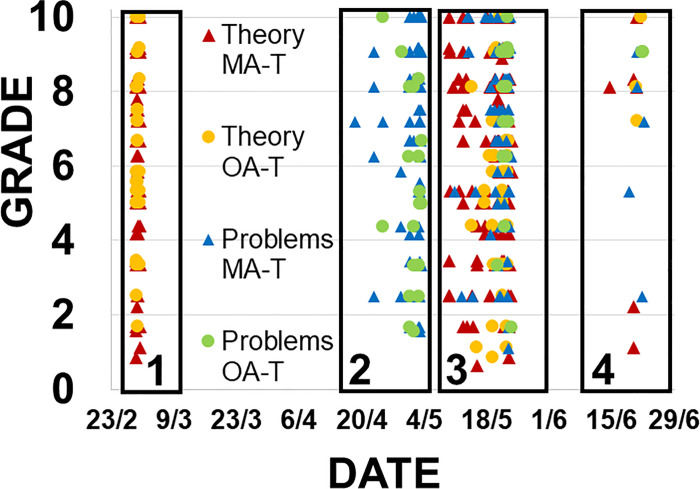
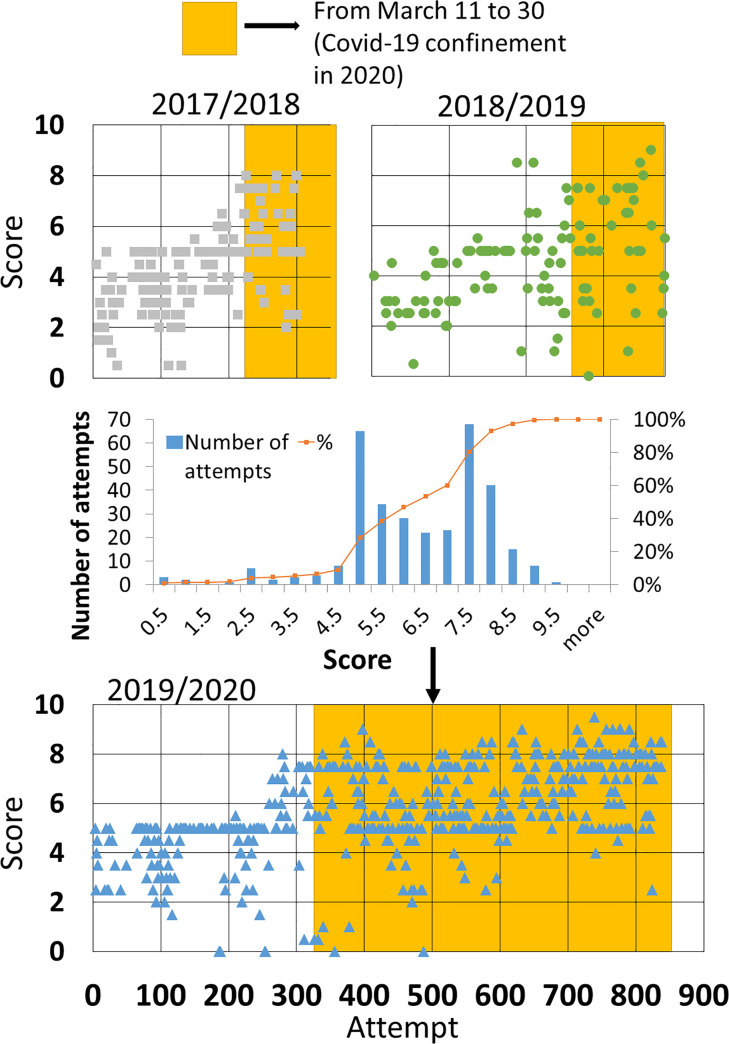
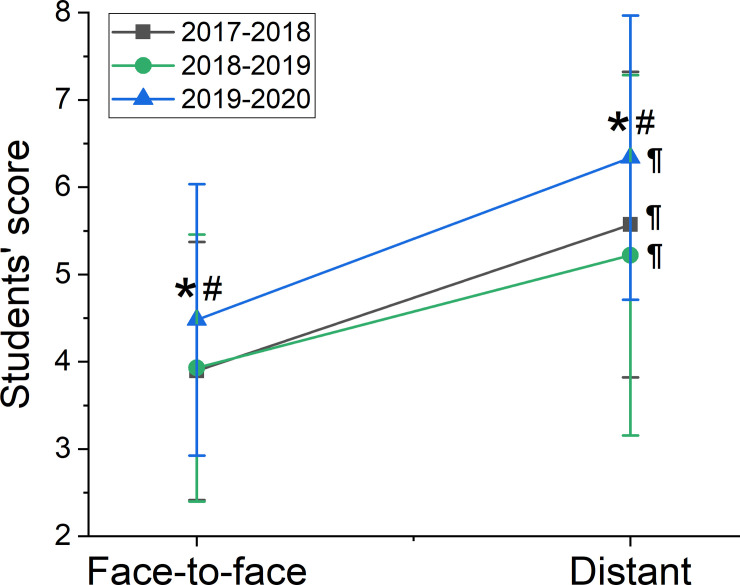
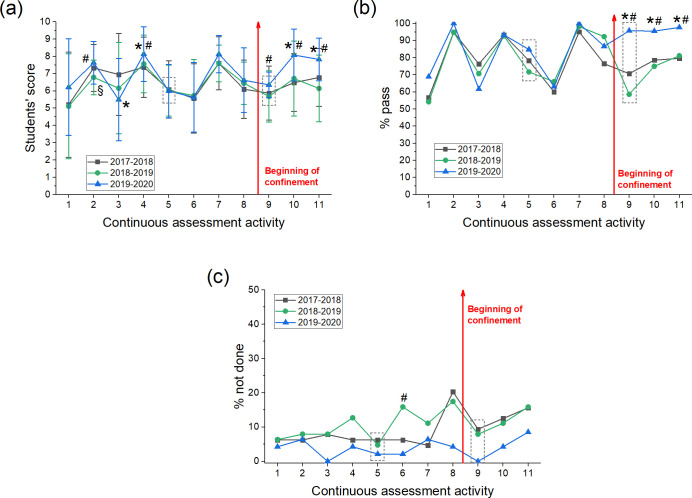
This study analyzes the effects of COVID-19 confinement on the autonomous learning performance of students in higher education. Using a field experiment with 458 students from three different subjects at Universidad Autónoma de Madrid (Spain), we study the differences in assessments by dividing students into two groups. The first group (control) corresponds to academic years 2017/2018 and 2018/2019. The second group (experimental) corresponds to students from 2019/2020, which is the group of students that had their face-to-face activities interrupted because of the confinement. The results show that there is a significant positive effect of the COVID-19 confinement on students' performance. This effect is also significant in activities that did not change their format when performed after the confinement. We find that this effect is significant both in subjects that increased the number of assessment activities and subjects that did not change the student workload. Additionally, an analysis of students' learning strategies before confinement shows that students did not study on a continuous basis. Based on these results, we conclude that COVID-19 confinement changed students' learning strategies to a more continuous habit, improving their efficiency. For these reasons, better scores in students' assessment are expected due to COVID-19 confinement that can be explained by an improvement in their learning performance.
Overview
The claims and statistics of this paper haven’t been checked yet.
Run the check — free, no account needed. It reads the open-access text and checks the sources it cites.
Integrity signals
Registry
Cites
Statistics
Figures
Verification
Claims the paper makes
The claims and statistics of this paper haven’t been checked yet.
Run the check — free, no account needed. It reads the open-access text and checks the sources it cites.
Claims other papers make about this one
Each is checked against this paper’s own text: does it say what the citing paper says it does?
In the citing paper
“Our results then seem to confirm, at a larger scale, those of Gonzalez et al. (2020) in a different university in Madrid.”
From Emergency remote teaching and students’ academic performance in higher education during the COVID-19 pandemic: A case study (2021) · cites this paper as Gonzalez et al., 2020
In the citing paper
“As mentioned in Section 6, while counter-intuitive, this result confirms, across a larger number of courses, the findings of Gonzalez et al. (2020) in a very similar albeit smaller context.”
From Emergency remote teaching and students’ academic performance in higher education during the COVID-19 pandemic: A case study (2021) · cites this paper as Gonzalez et al. (2020)
In the citing paper
“At the university level, in a single university, for 458 students in STEM faculties, learning outcomes actually improved (Gonzalez et al., 2020).”
From Learning loss during Covid-19: An early systematic review (2022) · cites this paper as Gonzalez et al. (2020)
Self-check
Percentages, sums and reported differences re-computed from the paper’s own numbers.
The self-check needs the paper’s full text.
Citations
Cites
On a Test of Whether one of Two Random Variables is Stochastically Larger than the Other
Mann, H. B., & Whitney, D. R. (1947) · The Annals of Mathematical Statistics · doi:10.1214/aoms/1177730491 · Cited by 14,320 · cited 1×
“Means were compared by a Kruskal-Wallis test [46] and, when differences were found, by a Mann-Whitney post hoc test [47] to determine which pairs of means were different.”
MethodUse of Ranks in One-Criterion Variance Analysis
Kruskal, W. H., & Wallis, W. A. (1952) · Journal of the American Statistical Association · doi:10.1080/01621459.1952.10483441 · Cited by 13,912 · cited 1×
“Means were compared by a Kruskal-Wallis test [46] and, when differences were found, by a Mann-Whitney post hoc test [47] to determine which pairs of means were different.”
MethodZimmerman, B. J. (2008) · American Educational Research Journal · doi:10.3102/0002831207312909 · Cited by 3,735 · cited 1×
“Related to autonomous learning, many studies have been performed regarding the concept of self-regulated learning (SRL), in which students are active and responsible for their own learning process [18, 19] as well as being knowledgeable, self-aware and able to select their own approach to learning [20, 21].”
BackgroundFundamentals of item response theory
(1992) · Choice Reviews Online · doi:10.5860/choice.29-4185 · Cited by 3,420
Zimmerman, B. J., & Martinez-Pons, M. (1990) · Journal of Educational Psychology · doi:10.1037/0022-0663.82.1.51 · Cited by 1,825 · cited 1×
“Related to autonomous learning, many studies have been performed regarding the concept of self-regulated learning (SRL), in which students are active and responsible for their own learning process [18, 19] as well as being knowledgeable, self-aware and able to select their own approach to learning [20, 21].”
BackgroundComputerized Adaptive Testing: A Primer
Wainer, H., Dorans, N. J., Flaugher, R. L., Green, B. F., & Mislevy, R. J. (1990) · Medical Entomology and Zoology · Cited by 1,169
La evaluación online en la educación superior en tiempos de la COVID-19
García‐Peñalvo, F. J., Corell, A., García, V. A., & de Prado, M. G. (2020) · Education in the Knowledge Society (EKS) · doi:10.14201/eks.23086 · Cited by 866
The MOOC model for digital practice
McAuley, A. B. T., Stewart, B. E., Siemens, G., & Cormier, D. (2010) · Cited by 698
Comparing online and blended learner's self-regulated learning strategies and academic performance
Broadbent, J. (2017) · The Internet and Higher Education · doi:10.1016/j.iheduc.2017.01.004 · Cited by 679
Wainer, H., Dorans, N. J., Flaugher, R. L., Green, B. F., & Mislevy, R. J. (2000) · Routledge eBooks · doi:10.4324/9781410605931 · Cited by 659
Research works printed but not linked: 2
- FJ García-Peñalvo, 2020, Online Assessment in Higher Education in the Time of COVID-19, Education in the Knowledge Society, 21, 12
- FM Lord, 1980, Applications of item response theory to practical problems
Cited by
Sorted by citations
Items 601–700 of 744
Karaduman, G. (2022) · Advances in educational marketing, administration, and leadership book series · doi:10.4018/978-1-6684-3600-4.ch002
Flipped Exams as a Reliable and Formative Assessment Tool in Higher Education
Oltra‐Massuet, I., Alvarez-Morera, G., & Fullana, C. (2022) · Advances in educational technologies and instructional design book series · doi:10.4018/978-1-6684-4446-7.ch012
Higher Education Students' Online Learning Attitudes and Academic Performance
Othman, R., Othman, R., Chan, S., Roni, S. M., & Ameer, R. (2022) · Advances in educational technologies and instructional design book series · doi:10.4018/978-1-6684-4446-7.ch011
Implementing the Flipped Classroom Model and the CEFR to Enhance Learners' 21st Century Skills
Gidiotis, I. (2022) · Advances in educational technologies and instructional design book series · doi:10.4018/978-1-6684-4446-7.ch015
Gamification-Based Tools Embedded in the Helios Educational Platform
Strileţchi, C., Stan, A., & Jecan, E. (2022) · Lecture notes in networks and systems · doi:10.1007/978-3-031-04819-7_46
Study of Impact of COVID-19 on Students Education
Mahajan, D. A., & Mahender, C. N. (2022) · Lecture notes on data engineering and communications technologies · doi:10.1007/978-981-16-9416-5_42
Experiencia docente en el curso online Community Manager en situación de confinamiento por COVID-19.
Rodríguez, Á. D. C. (2021) · International Conference on Innovation, Documentation and Education (INNODOCT) · doi:10.4995/inn2021.2021.13354
The Digital Transformation of Education Amidst COVID-19
Currey, R., & GEORGE, B. P. (2022) · Advances in educational marketing, administration, and leadership book series · doi:10.4018/978-1-6684-4803-8.ch016
Pinto, M. E., Yarema, S., & Paulín, H. L. (2022) · Simpósio Internacional Trabalho, Relações de Trabalho, Educação e Identidade (SITRE) · doi:10.47930/1980-685x.2022.3203
Saúde e trabalho docente durante o ensino remoto emergencia
Vieira, C., Fonseca, J. E., & Fujii, J. (2022) · Simpósio Internacional Trabalho, Relações de Trabalho, Educação e Identidade (SITRE) · doi:10.47930/1980-685x.2022.3202
Didática: uma proposta ergoavaliativa para reconfiguração da prática pedagógica durante a pandemia
da Silva, J. B., Veríssimo, M., & Philippe, G. (2022) · Simpósio Internacional Trabalho, Relações de Trabalho, Educação e Identidade (SITRE) · doi:10.47930/1980-685x.2022.3204
Vivências universitárias de professores e estudantes durante a pandemia da COVID-19
Perez, K., Giongo, C. R., & Ribeiro, B. (2022) · Simpósio Internacional Trabalho, Relações de Trabalho, Educação e Identidade (SITRE) · doi:10.47930/1980-685x.2022.3205
Tsai, Y.-H. R., Vu, T., Janssen, T. W. P., Jansen, B. R. J., van Atteveldt, N., Meeter, M., & Magis‐Weinberg, L. (2022) · doi:10.31234/osf.io/7wgka
Covid-19 among College Students in Pekanbaru: How Much Do They Know?
Yumarlin, K., Fitri, L., Hasibuan, E. R., & Rustam, M. (2022) · Diversity Disease Preventive of Research Integrity · doi:10.24252/diversity.v3i1.28188
Ensino superior de enfermagem em tempos de pandemia: visão dos acadêmicos em ensino remoto
Guimarães, F. P., Lima, T. S., de Carvalho, C. A., Barcelos, K. L., & de Lieberenz, L. V. A. (2022) · STUDIES IN EDUCATION SCIENCES · doi:10.54019/sesv3n3-018
Tijero, M. D. C. F., Matas, J. A. V., Jiménez, P. M. C., Maudes, J. C., & Osa, J. O. (2022) · Tabanque · doi:10.24197/trp.1.2022.179-206
Albishi, W., Alsanawi, H. A., AlFaleh, A. F., Alrabai, H. M., & Alaseem, A. (2022) · Research Square · doi:10.21203/rs.3.rs-2169946/v1
The Evolutionary of Electronic Learning Platforms during COVID-19 Pandemic at the Saudi Universities
AlRugaibah, A. A., & Hadwan, M. (2022) · International Conference on Emerging Smart Technologies and Applications (eSmarTA) · doi:10.1109/esmarta56775.2022.9935418
“During the COVID-19 Pandemic, the governments world widely have started imposing lockdown, social distancing, and avoiding face-to-face teaching to control the spread of this contagious disease [4].”
BackgroundDaryanto, B., Kristi, B., & Prawestiningtyas, E. (2022) · majalah kesehatan · doi:10.21776/majalahkesehatan.2022.009.03.2
Byagar, S., Avhankar, M. S., & Pawar, J. (2021) · Gyankosh- The Journal of Library and Information Management · doi:10.5958/2249-3182.2021.00013.7
Hybrid Mode: A New Norm for Electrical Engineering Laboratory Education?
Huang, T. X. H., Chu, R. H., & Jones, P. W. (2022) · Research in Engineering Education Symposium (REES) · doi:10.52202/066488-0056
Rahim, A. B., Abdullah, M., Daud, S. R., Othman, R., Ahmad, N., & Rafie, S. K. (2022) · International Journal of Academic Research in Progressive Education and Development · doi:10.6007/ijarped/v11-i3/15424
Perceived effectiveness of lecture videos
Kuijer, L. B. (2023) · Developing Academic Practice · doi:10.3828/dap.2023.7
¿Qué pasa con la educación durante una pandemia?
Barreto, P. A. E., & Acosta, J. S. H. (2023) · Ecos de Economía · doi:10.17230/ecos.2021.53.3
The Dynamics of Changes in the Personal Resources of Pedagogy Students During COVID-19 Pandemic
Kulawska, E. (2022) · Lubelski Rocznik Pedagogiczny · doi:10.17951/lrp.2022.41.3.83-100
Comprehensive Analysis of COVID-19’s Effects on the Education System
Rehani, S., Kumar, P., Sharma, M., Gupta, C., & Kumar, N. (2022) · International Conference on Innovative Sustainable Computational Technologies (CISCT) · doi:10.1109/cisct55310.2022.10046513
Belov, O. O. (2023) · Ukraïnsʹkij žurnal medicini bìologìï ta sportu · doi:10.26693/jmbs08.01.100
Majid, H., Arshad, H., Rehman, S., Abıdın, Z. U., Siddiqi, H. S., Fatima, S., & Jafri, L. (2023) · doi:10.2196/preprints.47303
From Explaining to Engaging: A Seventy-Thirty Rule
Hassan, T., & McKee, G. T. (2023) · Lecture notes in networks and systems · doi:10.1007/978-3-031-26876-2_60
Students’ Perception of Anatomy Learning Method During the COVID-19 Pandemic: A Qualitative Study
Mubarokah, M. A., Kurniawati, D., & Handayani, S. (2023) · Atlantis highlights in social sciences, education and humanities/Atlantis Highlights in Social Sciences, Education and Humanities · doi:10.2991/978-2-38476-036-7_28
A Comparison of Students' Mean Achievements before and during the Covid-19 Pandemic: A Case Study
Ossai, P. A. U. (2023) · International Journal of Information and Education Technology · doi:10.18178/ijiet.2023.13.4.1861
Mental Health Challenges of Higher Education Students During the COVID-19 Pandemic
Akhil, M. P. (2023) · Advances in psychology, mental health, and behavioral studies (APMHBS) book series · doi:10.4018/978-1-6684-7221-7.ch006
Improving the Key Competences in K12 by Collaborating in an Active Learning Environment Online
Yeşil, L. B. (2023) · Advances in educational technologies and instructional design book series · doi:10.4018/978-1-6684-7015-2.ch006
Sunarti, S., Wulandari, D. A. N., Pahlevi, O., Schaduw, F. E., & Purwandani, I. (2023) · AIP conference proceedings · doi:10.1063/5.0128552
Best Practices in the Covid-19 Pandemic: Basis for the Development of Flexible Learning ModelPreprint
Ortiz, M. (2023) · SSRN Electronic Journal · doi:10.2139/ssrn.4475193
González, F. H., Ortega, C. M. V., & Aristizábal, L. S. M. (2023) · Brazilian Journal of Development · doi:10.34117/bjdv9n6-096
الحربي, ع. ح., & الزعبی, ه. ر. (2023) · Al-Mağallah Al-ʿilmiyyaẗ Lil-Maktabāt wa Al-Waṯā'iq wa Al-Ma'lūmāt · doi:10.21608/jslmf.2022.134416.1113
Omilis, D., Ramos, A. L. A., Parate, M. G., & Diaz, M. J. (2023) · International Conference for Emerging Technology (INCET) · doi:10.1109/incet57972.2023.10170517
Pupils’ Reading Motivation and Reading Literacy Level
Ilago, M. R. T., & Tantiado, R. C. (2023) · International Journal of Research Publications · doi:10.47119/ijrp1001281720235163
Perspective Chapter: Online Courses – An Antidote to Traditional Andragogy
Zireva, D. (2023) · IntechOpen eBooks · doi:10.5772/intechopen.1001361
Ahmad, M., Haq, A. U., Raina, S. H., Pala, S. M., & Khan, A. I. (2023) · Research Square · doi:10.21203/rs.3.rs-3091677/v1
Distance Learning and Financial Accounting in Portugal
Maldonado, I., Pinho, C., Silva, A. P., Magalhães, M., Pereira, M. S., & Torre, L. (2023) · Iberian Conference on Information Systems and Technologies (CISTI) · doi:10.23919/cisti58278.2023.10211477
“Distance education offers several advantages over traditional classroom teaching [13]; [12]; [14]; [15]; [16]), including increased student participation in debates ([14]), improvement in reflection and research time ([17]; [14]), increased student responsibility ([18]; [12]; [16]), among others.”
BackgroundPotter, C., Hiserman, L., Papp, G., Viswanathan, H., & Huff, L. E. (2023) · Frontiers in Education · doi:10.3389/feduc.2023.1201688
Chung, I.-S., & Choi, H.-C. (2023) · Journal of Educational and Social Research · doi:10.36941/jesr-2023-0115
Online Learning in Times of Pandemic
Martínez-Martínez, A. M., Díaz-López, M. D. P., Roith, C., & Gómez, N. N. (2023) · Advances in educational technologies and instructional design book series · doi:10.4018/978-1-6684-8861-4.ch007
Virtual Learning, Real Effects: Does Delivery Mode Influence Students' Attainment?Preprint
Motoki, F. Y. S., Neto, V. P., & Rodrigues, V. R. D. S. (2023) · SSRN Electronic Journal · doi:10.2139/ssrn.4582715
CASTILLO, E. (2023) · AIDE Interdisciplinary Research Journal · doi:10.56648/aide-irj.v6i1.91
Post Covid-19 Student’s Burnout Level in Boarding School’s Non-Academic Programs
Nafi’ah, U., Ciptandi, F., & Machfiroh, R. (2023) · Advances in Social Science, Education and Humanities Research/Advances in social science, education and humanities research · doi:10.2991/978-2-38476-118-0_54
Remote teaching for health academics in the COVID-19 pandemic
de Oliveira, H. V. C., Carvalho, R. C., do Nascimento, N. F., & Melo, M. R. S. (2023) · Revista Docência do Ensino Superior · doi:10.35699/2237-5864.2023.41509 · Cited by 12
Nazione, S. A., Heller, L. R., Vredeveld, A. J., Dexter, C. A., & McElveen, M. (2023) · Journal of American College Health · doi:10.1080/07448481.2023.2280841
“Iglesias-Pradas et al. 19 and Gonzalez et al. 20 conducted research outside the U.S. and found COVID-19 to have a positive impact on student grades, finding improvements as compared to past semesters.”
Iqbal, S., Kausar, S., Malik, H., & Masaud, P. (2023) · Qlantic journal of social sciences. · doi:10.55737/qjss.737076082
de Almeida, A. C. S., Rangel, D. F., & Costa, L. L. (2023) · Journal of Biological Education · doi:10.1080/00219266.2023.2288338
“The implementation of distance learning in face-to-face courses was challenging for basic and higher education, mainly because students needed to reconcile meeting the requirements of their courses with daily tasks at home, at work and in family care (Odriozola-González et al. 2020).”
Barriers of Distance Learning in studied English for Logistics: Literature Review
Puspanikan, S. K., & Wulansari, D. N. (2021) · Journal of Logistics and Supply Chain · doi:10.17509/jlsc.v1i2.39939
Laryea, E. A., Agbodjah, S., & Annoh, W. O. (2023) · doi:10.14507/mcf-eli.i17
Yáñez-Pizaña, A., Montiel-Flores, E., Herrera-López, M. E., Romero-Morelos, P., Bandala, C., Alfaro-Rodríguez, A., & Cortes-Altamirano, J. L. (2023) · Investigación en Discapacidad · doi:10.35366/113825
Mahmood, O. B., & Yesmin, S. (2023) · Journal of Knowledge & Communication Management · doi:10.5958/2277-7946.2023.00009.8
Impact of COVID-19 on Teaching and Learning: Perspectives of South African University Lecturers
Ugwuanyi, C. S. (2023) · International Journal of Home Economics Hospitality and Allied Research · doi:10.57012/ijhhr.v2n2.021
“There are numerous problems associated with higher education across the globe as a result of the COVID-19 epidemic (Gonzalez et al., 2020).”
BackgroundKoyuncuoğlu, Ö., ŞENDOĞDU, A. A., & Koyuncuoğlu, D. (2023) · Yuksekogretim Dergisi · doi:10.53478/yuksekogretim.1199841
The Effect of the COVID-19 Lockdown on Learning and Teaching
Alhassan, Y., McChristie, S., & Paul, G. (2023) · Advances in educational marketing, administration, and leadership book series · doi:10.4018/978-1-6684-8332-9.ch001
Effectiveness of Student Online Learning in Indonesia
Hafizh, M., & Asril, Z. (2023) · Ahlussunnah Journal of Islamic Education · doi:10.58485/jie.v2i3.181
Bakar, S. A., Hadi, N. A., Alwadood, Z., & Yahya, A. A. (2022) · Asian Journal of Assessment in Teaching and Learning · doi:10.37134/ajatel.vol12.2.9.2022
Kutoane, M. (2023) · ResearchSpace (University of KwaZulu-Natal) · doi:10.29086/10413/22840
Advances and New Perspectives in Higher Education Quality
(2024) · Frontiers research topics · doi:10.3389/978-2-8325-4820-2
Evaluation and assessment as main concerns of higher education students after COVID-19 confinement
Martínez, Ú. F., Lechuga, M. L., & Cifuentes‐Faura, J. (2024) · Innovation The European Journal of Social Science Research · doi:10.1080/13511610.2024.2349945 · Cited by 1
Green, S. L., & du Plessis, E. C. (2023) · Journal of Educational Studies · doi:10.59915/jes.2023.22.4.4 · Cited by 2
Aksovaara, S., Kärkkäinen, T., & Silvennoinen, M. (2024) · doi:10.18690/um.fov.4.2024.5
WhatsApp and English Language Learning: Students’ Experiences during the Pandemic in Pakistan
Muhammad, R., & Annamalai, N. (2023) · Mextesol journal. · doi:10.61871/mj.v47n3-10 · Cited by 6
Face-to-Face Versus Online Modality: A Comparative Analysis of Student Performance in StatisticsPreprint
Marina, P.-G. L., Basantes-Andrade, A., & Albán, R. C. (2024) · SSRN Electronic Journal · doi:10.2139/ssrn.4865312
Evaluating the effectiveness of learning management systems for remote assessments during COVID-19
Rabeh, M. D., & Elmotri, B. (2024) · International Journal of ADVANCED AND APPLIED SCIENCES · doi:10.21833/ijaas.2024.06.013
Academic Skills Used by College Students Without Brain Injury: A Validation Study
Isaki, E., Lininger, M. R., & Cross, E. (2024) · American Journal of Speech-Language Pathology · doi:10.1044/2024_ajslp-24-00083
Virtual Laboratories in the Teaching and Learning Paradigm
Lyngdoh, D. C., Dakua, S. P., & Mourya, G. K. (2024) · Advances in hospitality, tourism and the services industry (AHTSI) book series · doi:10.4018/979-8-3693-2272-7.ch015
Rui-li, L., Zhang, J., TONGZHAO, X., & SHIZHANG, H. (2024) · British Journal of Teacher Education and Pedagogy · doi:10.32996/bjtep.2024.3.2.12
DESEMPENHO ACADÊMICO NO ENSINO SUPERIOR: PRESENCIAL VERSUS REMOTO
Bihain, A., Ferreira, P. P., & Irala, V. B. (2024) · Revista GESTO-Debate · doi:10.55028/gd.v24i01.21580
Aprendizagem, desempenho e satisfação de discentes no ensino remoto
Aquino, C. V. M. G., da Silva, C. R. M., Castelo, J. L., Ferreira, M. A., Pereira, R. B., & Siebra, A. A. (2024) · Revista Docência do Ensino Superior · doi:10.35699/2237-5864.2024.48452
Confinement and its Impact on Pedagogical Continuity
Mohamed, A., Brahim, D., & Brahim, M. (2024) · Journal of Southwest Jiaotong University · doi:10.35741/issn.0258-2724.59.5.4
Aggarwal, P., Kumari, A., & Srivastava, A. (2024) · Lecture notes in electrical engineering · doi:10.1007/978-981-97-5227-0_25
Gentner-Polanco, D. A., Ávila-Amezcua, M. J., Tapia-Hernández, B. G., Chowell, G., Mamelund, S., & Santana-Mancilla, P. C. (2024) · Avances en Interacción Humano-Computadora · doi:10.47756/aihc.y9i1.165
“In an analysis of the pandemic's effects on students' academic performance, González et al. [12] found that COVID-19 confinement had a positive impact on students' performance in terms of more consistent and efficient study habits, resulting in higher grades in assessments.”
Ndamukunda, O. N. U., Mutuyimana, M. T., Umubano, F., & Tuyishime, E. (2025) · PLoS ONE · doi:10.1371/journal.pone.0318066
Hernández, A. F. S., & Cabrero, B. G. (2024) · Psicología Educativa · doi:10.22201/fpsic.24486957e.2024.12.23
University Education of the Future: Students’ Perspective
Dyukina, T., Diukina, I. V., Терентьева, Т. В., & Valebnikova, N. (2025) · Lecture notes in networks and systems · doi:10.1007/978-3-031-85608-2_12
The heterogeneous impact of COVID-19 on university student´s academic performance
Acuña, M., Álvarez, R., & Avarca, C. (2025) · International Review of Economics Education · doi:10.1016/j.iree.2025.100318
Xiao, B., & Shapka, J. D. (2025) · Current Psychology · doi:10.1007/s12144-025-07977-8
Residual post-pandemic ICT literacy in higher education
Tejero, O. M. C. (2022) · HUMAN REVIEW International Humanities Review / Revista Internacional de Humanidades · doi:10.37819/humanrev.v13i1.1106
Hamka, M., Purwanto, P., & Wibowo, A. (2025) · AIP conference proceedings · doi:10.1063/5.0259237
Koca, S., & YALMAN, F. (2025) · Uluslararası Yönetim Akademisi Dergisi · doi:10.33712/mana.1587431 · Cited by 1
Effects of teaching modality changes: Evidence from a lab-in-the-field experiment
Portilla, K. G., Hoyos, M., Muñoz, J., & Rodríguez, G. C. (2025) · International Journal of Educational Development · doi:10.1016/j.ijedudev.2025.103396
Espinosa, B. S. O., Cando, E. L. C., Álvarez, E. M. B., & Chito, A. L. B. (2025) · Revista Ciencia Innovadora · doi:10.64422/rci.v3n3.2025.65
Weliwita, C., Ariyasinghe, I., & Piyasoma, W. (2025) · Open Learning The Journal of Open Distance and e-Learning · doi:10.1080/02680513.2025.2567351
Chapter 5: Traversing methodological confinements
Moodley, D. L., & Craighead, C. (2025) · doi:10.4102/aosis.2025.bk524.05
Chapter 6: Processing alternative methodologies
Moodley, D. L., & Craighead, C. (2025) · doi:10.4102/aosis.2025.bk524.06
Chapter 10: There is liberation in breaking ‘rules’
Moodley, D. L., & Craighead, C. (2025) · doi:10.4102/aosis.2025.bk524.10
Moodley, D. L., & Craighead, C. (2025) · doi:10.4102/aosis.2025.bk524.01
Chapter 2: A double self-reflexivity
Moodley, D. L., & Craighead, C. (2025) · doi:10.4102/aosis.2025.bk524.02
Chapter 3: Back to context: A system fractured, now grappling
Moodley, D. L., & Craighead, C. (2025) · doi:10.4102/aosis.2025.bk524.03
Chapter 4: No words to tell! – shifting the paradigm
Moodley, D. L., & Craighead, C. (2025) · doi:10.4102/aosis.2025.bk524.04
Metadata
- Authors
- Gonzalez, T., de la Rubia, M. A., Hincz, K. P., Comas-Lopez, M., Subirats, L., Fort, S., & Sacha, G. M.
- Affiliations
- Universidad Autónoma de Madrid (ES)
- Universitat Oberta de Catalunya (ES)
- EURECAT Centre Tecnològic de Catalunya (ES)
- Corresponding author
- Sacha, G. M.
- Venue
- PLOS ONE
- Publisher
- Public Library of Science (PLoS)
- Published
- 2020-10-09
- Volume
- 15
- Issue
- 10
- Pages
- e0239490
- ISSN
- 1932-6203 (ISSN-L)
- PMC
- PMC7546684
- OpenAlex
- W3091995338
- Cited by
- 743
- References
- 45
- Citations by year
- 2026: 23 · 2025: 52 · 2024: 71 · 2023: 142 · 2022: 203 · 2021: 230 · 2020: 22
- FWCI
- 226.20
- Type
- journal article
- Language
- en
- Open access
- gold
- doi.org
- Licence
- Locations
- PLoS ONE (publishedVersion, cc-by)
- PubMed Central (publishedVersion, cc-by)
- PubMed (publishedVersion)
- RePEc: Research Papers in Economics (submittedVersion)
- DOAJ (DOAJ: Directory of Open Access Journals) (submittedVersion, cc-by-sa)
- Hispana (submittedVersion)
- Biblos-e Archivo (Universidad Autónoma de Madrid) (submittedVersion, public-domain)
- Funders
- Erasmus+ Program (2017-1-ES01-KA203-038266)
- Topics
- Social Sciences › Education › Education during COVID-19 pandemic
- Social Sciences › Education › Educational Outcomes and Influences
- Social Sciences › Education › E-Learning and COVID-19
- Keywords
- COVID-19 lockdown, university students, student performance, self-directed learning, learning strategies, assessment performance, student workload, Universidad Autónoma de Madrid
- MeSH terms
- Betacoronavirus, COVID-19, SARS-CoV-2, Adult, Educational Measurement, Female, Humans, Male, Models, Theoretical, Pneumonia, Viral, Spain, Students, Medical, Coronavirus Infections, Education, Distance, Young Adult, Pandemics
About these checks
Registry, retraction, Cites and statistics results are computed, not judged, with one exception: a printed reference that no index lists is read once by a model before it counts as a citation error. Claims are extracted by a model and kept only when their quote appears verbatim in the text; each cited source is then checked, with a model’s help, for whether it says what the claim relies on. Those verdicts can be wrong — read the claim’s quote and the cited source before relying on one.
Statistics and arithmetic are recomputed, not judged.
Confidence bands are shown only for fields calibrated on our annotated test set. None is calibrated yet, so no band is shown.
What counts as a claim ›How we measure confidence ›How we check this ›
Are you an author, or do you see a problem with this page? Request a review
