

The DOI matches its Crossref record; 63 of the 63 references it cites were found in a registry or an index.
Perineuronal Nets Enhance the Excitability of Fast-Spiking Neurons
Open accessAbstract
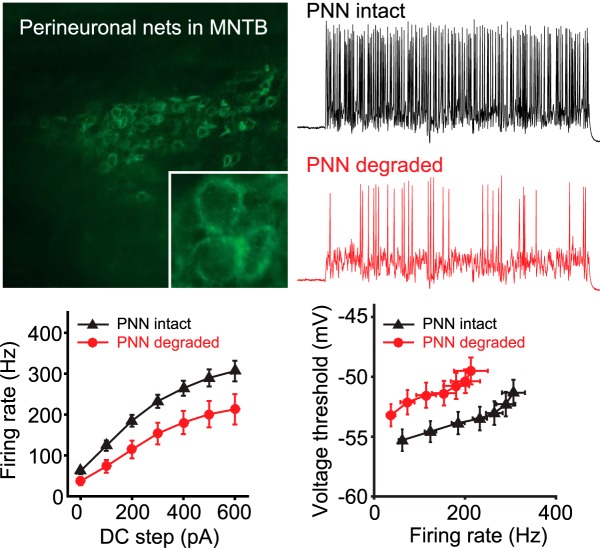
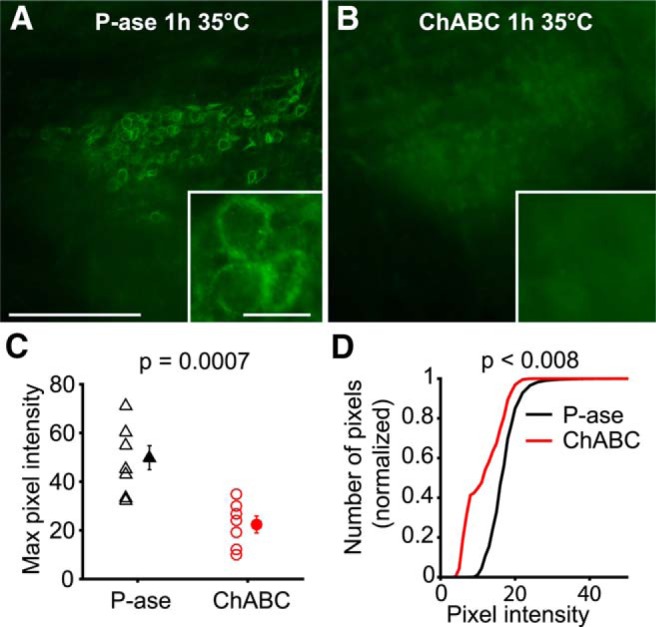
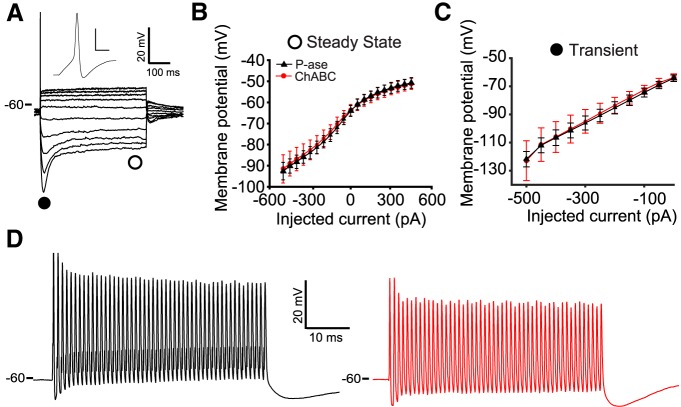
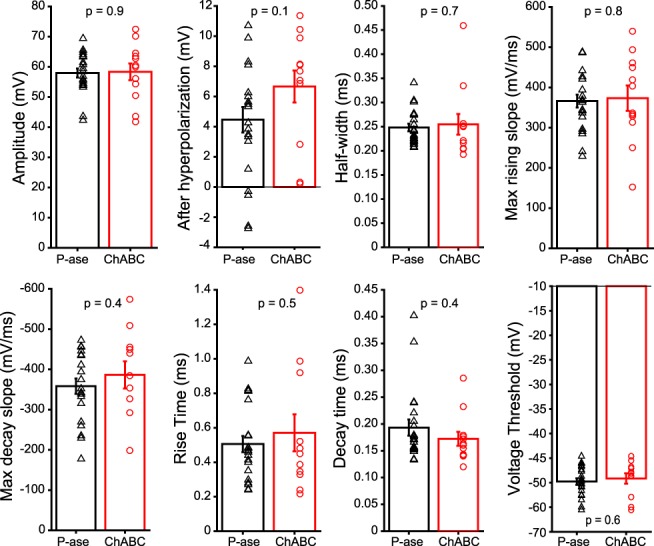
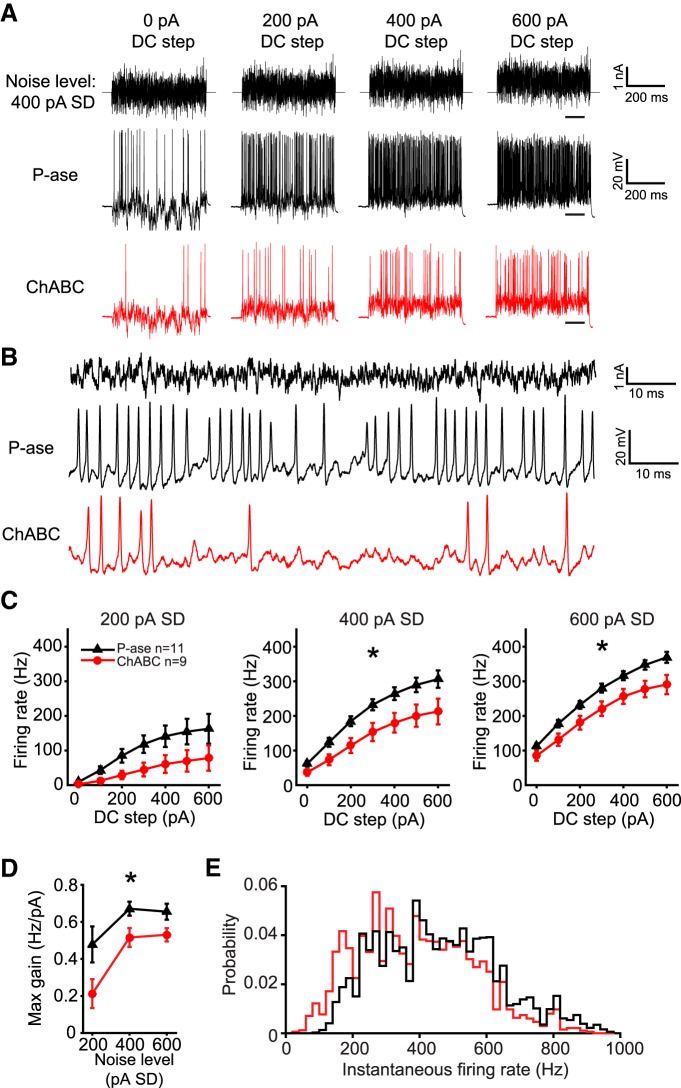
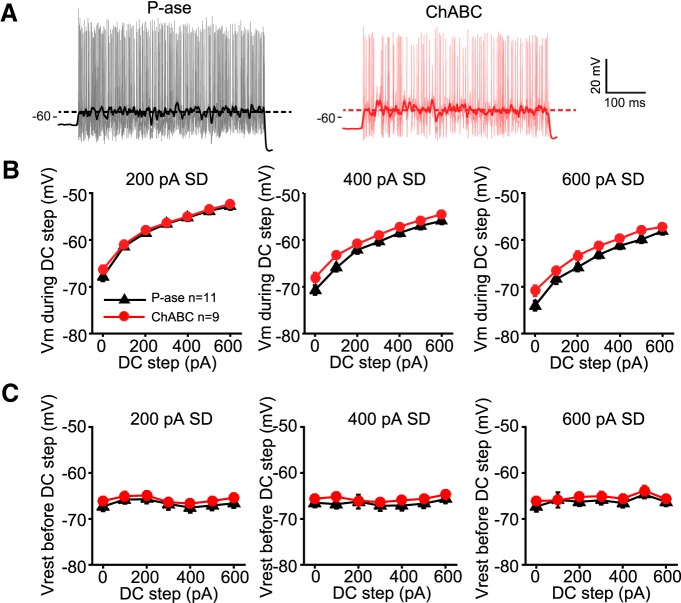
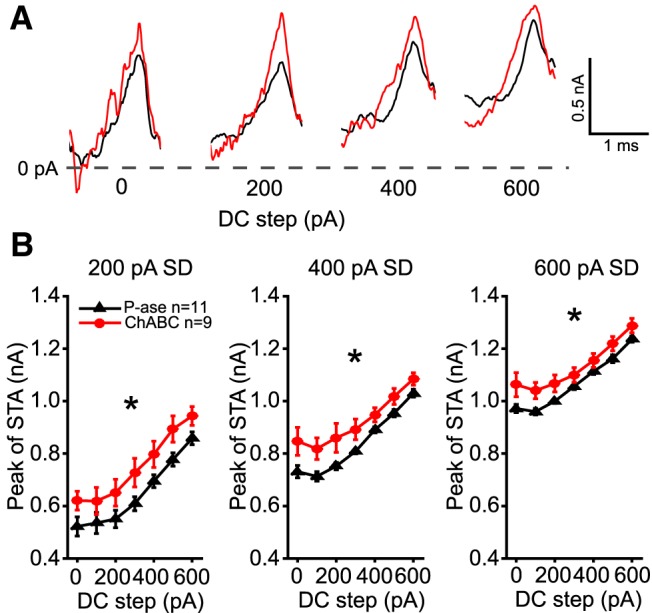
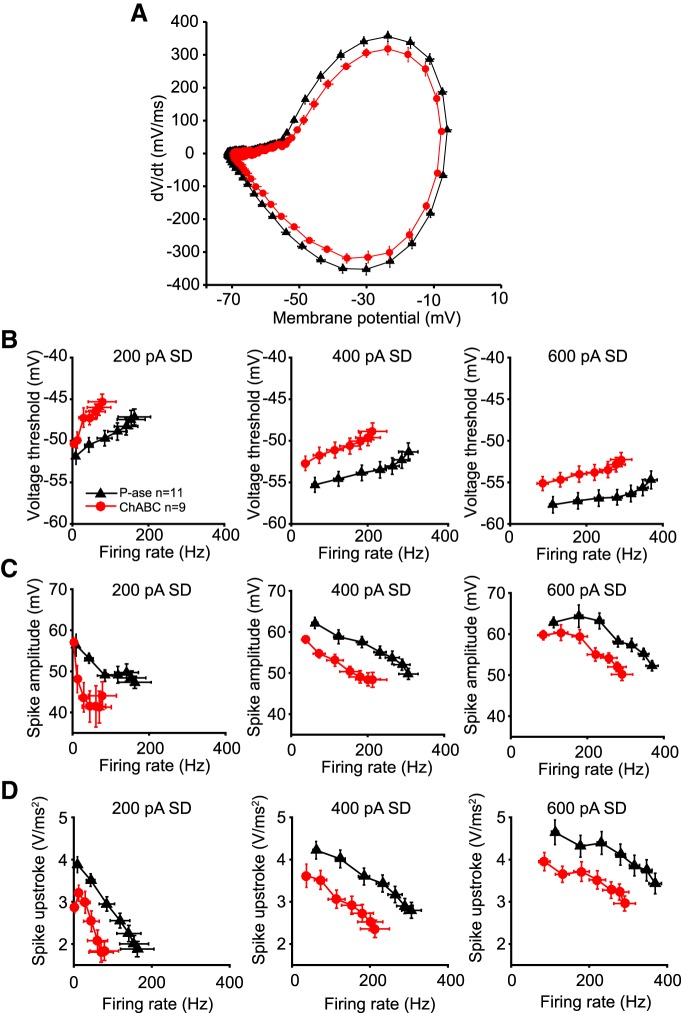
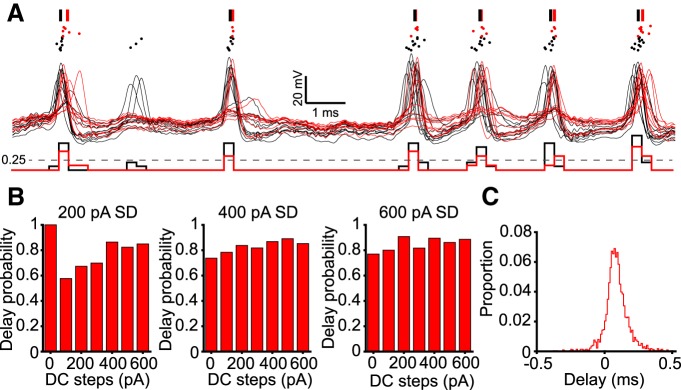
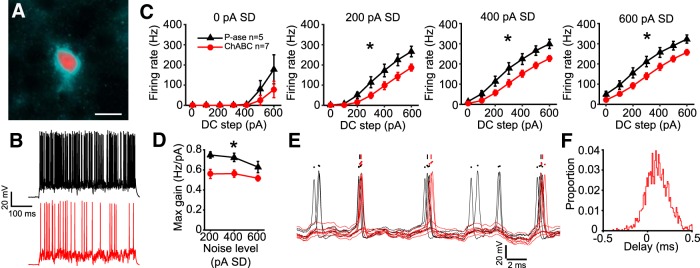
Perineuronal nets (PNNs) are specialized complexes of extracellular matrix molecules that surround the somata of fast-spiking neurons throughout the vertebrate brain. PNNs are particularly prevalent throughout the auditory brainstem, which transmits signals with high speed and precision. It is unknown whether PNNs contribute to the fast-spiking ability of the neurons they surround. Whole-cell recordings were made from medial nucleus of the trapezoid body (MNTB) principal neurons in acute brain slices from postnatal day 21 (P21) to P27 mice. PNNs were degraded by incubating slices in chondroitinase ABC (ChABC) and were compared to slices that were treated with a control enzyme (penicillinase). ChABC treatment did not affect the ability of MNTB neurons to fire at up to 1000 Hz when driven by current pulses. However, f – I (frequency–intensity) curves constructed by injecting Gaussian white noise currents superimposed on DC current steps showed that ChABC treatment reduced the gain of spike output. An increase in spike threshold may have contributed to this effect, which is consistent with the observation that spikes in ChABC-treated cells were delayed relative to control-treated cells. In addition, parvalbumin-expressing fast-spiking cortical neurons in >P70 slices that were treated with ChABC also had reduced excitability and gain. The development of PNNs around somata of fast-spiking neurons may be essential for fast and precise sensory transmission and synaptic inhibition in the brain.
Overview
The claims and statistics of this paper haven’t been checked yet.
Run the check — free, no account needed. It reads the open-access text and checks the sources it cites.
Integrity signals
Registry
Cites
Statistics
Figures
Verification
Claims the paper makes
The claims and statistics of this paper haven’t been checked yet.
Run the check — free, no account needed. It reads the open-access text and checks the sources it cites.
Claims other papers make about this one
Each is checked against this paper’s own text: does it say what the citing paper says it does?
In the citing paper
“As PNNs are implicated in neuronal health and function, protecting cells against neurotoxins such as Aβ1–42 [39] and oxidative stress [65] in addition to modulating neuronal activity [63, 66], the microglia-mediated loss of these structures in disease likely plays an important role in AD pathogenesis.”
From Microglia facilitate loss of perineuronal nets in the Alzheimer's disease brain (2020) · cites this paper as [63]
In the citing paper
“However, it is important to recognize that in addition to changes in the excitability of inhibitory neurons as suggested here and by others55, PNN degradation may also alter synaptic activity56 and hence network excitability.”
From Perineuronal nets decrease membrane capacitance of peritumoral fast spiking interneurons in a model of epilepsy (2018) · cites this paper as [55]
In the citing paper
“However, the role of PNNs in neural and network excitability is only beginning to be understood (Balmer, 2016; Murase et al., 2017; Wen et al., 2017).”
From The Perineuronal ‘Safety’ Net? Perineuronal Net Abnormalities in Neurological Disorders (2018) · cites this paper as Balmer, 2016
In the citing paper
“Perineuronal net dysfunction in schizophrenia may also drive changes in GABAergic cell function leading to network dysfunction, as normal PNN expression regulates excitability of PV cells (Liu et al., 2013; Balmer, 2016).”
From The Perineuronal ‘Safety’ Net? Perineuronal Net Abnormalities in Neurological Disorders (2018) · cites this paper as Balmer, 2016
In the citing paper
“While this mechanism has not been confirmed, chABC-mediated removal of chondroitin sulfate side chains from PNNs reduced spiking of PV cells in adult rats (Balmer, 2016; Lensjø et al., 2017) and increased spiking variability (Lensjø et al., 2017).”
From The Perineuronal ‘Safety’ Net? Perineuronal Net Abnormalities in Neurological Disorders (2018) · cites this paper as Balmer, 2016
In the citing paper
“As PNNs regulate PV cell activity (Balmer, 2016; Lensjø et al., 2017) and protect PV cells from oxidative stress (Cabungcal et al., 2013), PNNs can be potentially targeted to control seizures.”
From The Perineuronal ‘Safety’ Net? Perineuronal Net Abnormalities in Neurological Disorders (2018) · cites this paper as Balmer, 2016
In the citing paper
“chABC-mediated degradation of PNNs around PV cells in brainstem and central auditory neurons has similar effects, resulting in reduced PV cell excitability and gain (Balmer, 2016).”
From The Perineuronal ‘Safety’ Net? Perineuronal Net Abnormalities in Neurological Disorders (2018) · cites this paper as Balmer, 2016
In the citing paper
“Chondroitinase ABC, an enzyme that cleaves PNN proteoglycans, reduces GABA A inhibitory postsynaptic currents (Liu et al. 2013) and reduces excitability of PV fast-spiking cortical interneurons (Balmer 2016).”
In the citing paper
“Our findings reporting increased intensities of WFA labelled PNNs around PV+ interneurons suggest altered plasticity of PV+ cells as PNNs have been known to regulate synaptic and cellular plasticity of the cells they encapsulate (45) and digestion of PNNs around PV+ cells has been shown to reduce the fast spiking properties and excitability of PV+ cells (73)”
From Perineuronal nets, inhibitory interneurons and anxiety-related ventral hippocampal neuronal oscillations are altered by early life adversity (2019) · cites this paper as [73]
Self-check
Percentages, sums and reported differences re-computed from the paper’s own numbers.
The self-check needs the paper’s full text.
Citations
Cites
NIH Image to ImageJ: 25 years of image analysis
Schneider, C. A., Rasband, W. S., & Eliceiri, K. W. (2012) · Nature Methods · doi:10.1038/nmeth.2089 · Cited by 64,638
Ion Channels/Excitable Membranes
(2011) · Springer eBooks · doi:10.1007/springerreference_33998 · Cited by 4,066
The action of calcium on the electrical properties of squid axons
FRANKENHAEUSER, B., & Hodgkin, A. L. (1957) · The Journal of Physiology · doi:10.1113/jphysiol.1957.sp005808 · Cited by 1,839
Reactivation of Ocular Dominance Plasticity in the Adult Visual Cortex
Pizzorusso, T., Medini, P., Berardi, N., Chierzi, S., Fawcett, J. W., & Maffei, L. (2002) · Science · doi:10.1126/science.1072699 · Cited by 1,679
Perineuronal Nets Protect Fear Memories from Erasure
Gogolla, N., Caroni, P., Lüthi, A., & Herry, C. (2009) · Science · doi:10.1126/science.1174146 · Cited by 760
PTPσ Is a Receptor for Chondroitin Sulfate Proteoglycan, an Inhibitor of Neural Regeneration
Shen, Y., Tenney, A. P., Busch, S. A., Horn, K. P., Cuascut, F. X., Liu, K., He, Z., Silver, J., & Flanagan, J. G. (2009) · Science · doi:10.1126/science.1178310 · Cited by 682
Balancing Plasticity/Stability Across Brain Development
Takesian, A. E., & Hensch, T. K. (2013) · Progress in Brain Research · doi:10.1016/b978-0-444-63327-9.00001-1 · Cited by 667
Experience-driven plasticity of visual cortex limited by myelin and nogo receptor
McGee, A. W., Yang, Y., Fischer, Q. S., Daw, N. W., & Strittmatter, S. M. (2005) · Science · doi:10.1126/science.1114362 · Cited by 643
Chattopadhyaya, B., Di Cristo, G., Higashiyama, H., Knott, G. W., Kuhlman, S. J., Welker, E., & Huang, Z. J. (2004) · The Journal of Neuroscience · doi:10.1523/jneurosci.1851-04.2004 · Cited by 596
Brain extracellular matrix affects AMPA receptor lateral mobility and short-term synaptic plasticity
Frischknecht, R., Heine, M., Perrais, D., Seidenbecher, C. I., Choquet, D., & Gundelfinger, E. D. (2009) · Nature Neuroscience · doi:10.1038/nn.2338 · Cited by 554
Cited by
Sorted by citations
Perineuronal nets stabilize the grid cell network
Christensen, A. C., Lensjø, K. K., Lepperød, M. E., Dragly, S.-A., Sutterud, H., Blackstad, J. S., Fyhn, M., & Hafting, T. (2021) · Nature Communications · doi:10.1038/s41467-020-20241-w · Cited by 1,865
Critical period regulation across multiple timescales
Reh, R. K., Dias, B. G., Nelson, C. A., Kaufer, D., Werker, J. F., Kolb, B., Levine, J. D., & Hensch, T. K. (2020) · Proceedings of the National Academy of Sciences · doi:10.1073/pnas.1820836117 · Cited by 492
Neuron–glia interactions in the pathophysiology of epilepsy
Patel, D. C., Tewari, B. P., Chaunsali, L., & Sontheimer, H. W. (2019) · Nature reviews. Neuroscience · doi:10.1038/s41583-019-0126-4 · Cited by 476
Microglia facilitate loss of perineuronal nets in the Alzheimer's disease brain
Crapser, J. D., Spangenberg, E. E., Barahona, R. A., Arreola, M. A., Hohsfield, L. A., & Green, K. N. (2020) · EBioMedicine · doi:10.1016/j.ebiom.2020.102919 · Cited by 280
Crosstalk between glia, extracellular matrix and neurons
Song, I., & Dityatev, A. E. (2017) · Brain Research Bulletin · doi:10.1016/j.brainresbull.2017.03.003 · Cited by 270
Perineuronal Nets: Plasticity, Protection, and Therapeutic Potential
Reichelt, A. C., Hare, D. J., Bussey, T. J., & Saksida, L. M. (2019) · Trends in Neurosciences · doi:10.1016/j.tins.2019.04.003 · Cited by 219
Page, C. E., & Coutellier, L. (2019) · Neuroscience & Biobehavioral Reviews · doi:10.1016/j.neubiorev.2019.07.024 · Cited by 213
Tewari, B. P., Chaunsali, L., Campbell, S. L., Patel, D. C., Goode, A. E., & Sontheimer, H. (2018) · Nature Communications · doi:10.1038/s41467-018-07113-0 · Cited by 208
Aggrecan Directs Extracellular Matrix-Mediated Neuronal Plasticity
Rowlands, D., Lensjø, K. K., Dinh, T., Yang, S., Andrews, M. R., Hafting, T., Fyhn, M., Fawcett, J. W., & Dick, G. (2018) · The Journal of Neuroscience · doi:10.1523/jneurosci.1122-18.2018 · Cited by 204
Microglia as hackers of the matrix: sculpting synapses and the extracellular space
Crapser, J. D., Arreola, M. A., Tsourmas, K. I., & Green, K. N. (2021) · Cellular & Molecular Immunology · doi:10.1038/s41423-021-00751-3 · Cited by 178
The Perineuronal ‘Safety’ Net? Perineuronal Net Abnormalities in Neurological Disorders
Wen, T. H., Binder, D. K., Ethell, I. M., & Razak, K. A. (2018) · Frontiers in Molecular Neuroscience · doi:10.3389/fnmol.2018.00270 · Cited by 170
Steullet, P., Cabungcal, J.-H., Bukhari, S. A., Ardelt, M., Pantazopoulos, H., Hamati, F., Salt, T. E., Cuénod, M., Kim, Q., & Berretta, S. (2017) · Molecular Psychiatry · doi:10.1038/mp.2017.230 · Cited by 173
Wen, T. H., Afroz, S., Reinhard, S. M., Palacios, A. R., Tapia, K., Binder, D. K., Razak, K. A., & Ethell, I. M. (2018) · Cerebral Cortex · doi:10.1093/cercor/bhx258 · Cited by 165
Translation-relevant EEG phenotypes in a mouse model of Fragile X Syndrome.
Lovelace, J. W., Ethell, I. M., Binder, D. K., & Razak, K. A. (2018) · Neurobiology of Disease · doi:10.1016/j.nbd.2018.03.012 · Cited by 154
Perineuronal nets in brain physiology and disease
Testa, D., Prochiantz, A., & Nardo, A. A. D. (2018) · Seminars in Cell and Developmental Biology · doi:10.1016/j.semcdb.2018.09.011 · Cited by 153
Lensjø, K. K., Christensen, A. C., Tennøe, S., Fyhn, M., & Hafting, T. (2017) · eneuro · doi:10.1523/eneuro.0379-16.2017 · Cited by 133
Wingert, J. C., & Sorg, B. A. (2021) · Frontiers in Synaptic Neuroscience · doi:10.3389/fnsyn.2021.673210 · Cited by 129
Sensory Processing Phenotypes in Fragile X Syndrome
Rais, M., Binder, D. K., Razak, K. A., & Ethell, I. M. (2018) · ASN NEURO · doi:10.1177/1759091418801092 · Cited by 143
Murthy, S., Kane, G. A., Katchur, N. J., Lara Mejia, P. S., Obiofuma, G., Buschman, T. J., McEwen, B. S., & Gould, E. (2019) · Biological Psychiatry · doi:10.1016/j.biopsych.2019.02.021 · Cited by 118
Tewari, B. P., Chaunsali, L., Prim, C. E., & Sontheimer, H. W. (2022) · Frontiers in Cellular Neuroscience · doi:10.3389/fncel.2022.1022754 · Cited by 112
Hakon, J., Quattromani, M. J., Sjölund, C., Tomasevic, G., Carey, L. M., Lee, J., Ruscher, K., Wieloch, T. W., & Bauer, A. Q. (2017) · NeuroImage Clinical · doi:10.1016/j.nicl.2017.11.022 · Cited by 94
Krishnaswamy, V. R., Benbenishty, A., Blinder, P., & Sagi, I. (2019) · Cellular and Molecular Life Sciences · doi:10.1007/s00018-019-03182-6 · Cited by 96
Arreola, M. A., Soni, N., Crapser, J. D., Hohsfield, L. A., Elmore, M. R. P., Matheos, D. P., Wood, M. A., Swarup, V., Mortazavi, A., & Green, K. N. (2021) · Science Advances · doi:10.1126/sciadv.abg1601 · Cited by 91
Bozzelli, P. L., Alaiyed, S., Kim, E., Villapol, S., & Conant, K. E. (2018) · Neural Plasticity · doi:10.1155/2018/5735789 · Cited by 93
Parisien, M., Samoshkin, A., Tansley, S. N., Piltonen, M. H., Martin, L. J., El-Hachem, N., Dagostino, C., Allegri, M., Mogil, J. S., Khoutorsky, A., et al. (2019) · Pain · doi:10.1097/j.pain.0000000000001471 · Cited by 85
Caccavano, A., Bozzelli, P. L., Forcelli, P. A., Pak, D. T. S., Wu, J., Conant, K. E., & Vicini, S. (2020) · Journal of Neuroscience · doi:10.1523/jneurosci.0425-20.2020 · Cited by 92
Santiago, A. N., Lim, K. Y., Opendak, M., Sullivan, R. M., & Aoki, C. (2018) · Journal of Comparative Neurology · doi:10.1002/cne.24522 · Cited by 87
Murase, S., Lantz, C. L., & Quinlan, E. M. (2017) · eLife · doi:10.7554/elife.27345 · Cited by 87
Alaiyed, S., McCann, M., Mahajan, G., Rajkowska, G., Stockmeier, C. A., Kellar, K. J., Wu, J. Y., & Conant, K. (2020) · The Journal of Neuroscience · doi:10.1523/jneurosci.2387-19.2020 · Cited by 84
The ontogeny of memory persistence and specificity
Ramsaran, A. I., Schlichting, M. L., & Frankland, P. W. (2018) · Developmental Cognitive Neuroscience · doi:10.1016/j.dcn.2018.09.002 · Cited by 92
Lovelace, J. W., Rais, M., Palacios, A. R., Shuai, X. S., Bishay, S., Popa, O., Pirbhoy, P. S., Binder, D. K., Nelson, D. L., Ethell, I. M., et al. (2019) · Cerebral Cortex · doi:10.1093/cercor/bhz141 · Cited by 82
Guadagno, A., Verlezza, S., Long, H., Wong, T. P., & Walker, C.-D. (2020) · The Journal of Neuroscience · doi:10.1523/jneurosci.1029-20.2020 · Cited by 78
Perineuronal nets in the insula regulate aversion‐resistant alcohol drinking
Chen, H., & Lasek, A. W. (2020) · Addiction Biology · doi:10.1111/adb.12821 · Cited by 73
Perineuronal nets control visual input via thalamic recruitment of cortical PV interneurons
Faini, G., Aguirre, A., Landi, S., Lamers, D., Pizzorusso, T., Ratto, G. M., Deleuze, C., & Bacci, A. (2018) · eLife · doi:10.7554/elife.41520 · Cited by 71
Drzewiecki, C. M., Willing, J., & Juraska, J. M. (2020) · Brain Structure and Function · doi:10.1007/s00429-020-02137-z · Cited by 71
Pathogenic hypothalamic extracellular matrix promotes metabolic disease
Beddows, C. A., Shi, F., Horton, A. L., Dalal, S., Zhang, P., Ling, C., Yong, V. W., Loh, K., Cho, H., Karagiannis, C., et al. (2024) · Nature · doi:10.1038/s41586-024-07922-y · Cited by 66
Reichelt, A. C., Gibson, G. D., Abbott, K. N., & Hare, D. J. (2019) · Food & Function · doi:10.1039/c8fo02118j · Cited by 65
Slaker, M. L., Jorgensen, E. T., Hegarty, D. M., Liu, X., Kong, Y., Zhang, F., Linhardt, R. J., Brown, T. E., Aicher, S. A., & Sorg, B. A. (2018) · eneuro · doi:10.1523/eneuro.0221-18.2018 · Cited by 64
“Full degradation of PNNs has been shown to both decrease (Balmer, 2016) and increase (Dityatev et al., 2007) the firing of cultured neurons and to impair the induction of long-term potentiation (Carstens et al., 2016), with the difference likely dependent on the brain region and time interval after…”
BackgroundResultMechanisms underlying auditory processing deficits in Fragile X syndrome
McCullagh, E. A., Rotschafer, S. E., Auerbach, B. D., Klug, A., Kaczmarek, L. K., Cramer, K. S., Kulesza, R. J., Razak, K. A., Lovelace, J. W., Lu, Y., et al. (2020) · The FASEB Journal · doi:10.1096/fj.201902435r · Cited by 66
Drzewiecki, C. M., & Juraska, J. M. (2020) · Pharmacology Biochemistry and Behavior · doi:10.1016/j.pbb.2020.173044 · Cited by 74
Uliana, D. L., Lisboa, J. R., Gomes, F. V., & Grace, A. A. (2024) · Biochemical Pharmacology · doi:10.1016/j.bcp.2024.116298 · Cited by 68
Pirbhoy, P. S., Rais, M., Lovelace, J. W., Woodard, W., Razak, K. A., Binder, D. K., & Ethell, I. M. (2020) · Journal of Neurochemistry · doi:10.1111/jnc.15037 · Cited by 62
Perineuronal Net Dynamics in the Pathophysiology of Epilepsy
Chaunsali, L., Tewari, B. P., & Sontheimer, H. W. (2021) · Epiliepsy currents/Epilepsy currents · doi:10.1177/15357597211018688 · Cited by 60
Rupert, D. D., & Shea, S. D. (2022) · Frontiers in Neural Circuits · doi:10.3389/fncir.2022.886629 · Cited by 58
Cortical reorganization during adolescence: What the rat can tell us about the cellular basis
Juraska, J. M., & Drzewiecki, C. M. (2020) · Developmental Cognitive Neuroscience · doi:10.1016/j.dcn.2020.100857 · Cited by 56
Incubation of depression: ECM assembly and parvalbumin interneurons after stress
Spijker, S., Koskinen, M.-K., & Riga, D. (2020) · Neuroscience & Biobehavioral Reviews · doi:10.1016/j.neubiorev.2020.07.015 · Cited by 55
Disruption of perineuronal nets increases the frequency of sharp wave ripple events
Sun, Z. Y., Bozzelli, P. L., Caccavano, A., Allen, M., Balmuth, J., Vicini, S., Wu, J., & Conant, K. E. (2017) · Hippocampus · doi:10.1002/hipo.22804 · Cited by 61
Diurnal changes in perineuronal nets and parvalbumin neurons in the rat medial prefrontal cortex
Harkness, J. H., Gonzalez, A. E., Bushana, P. N., Jorgensen, E. T., Hegarty, D. M., Nardo, A. A. D., Prochiantz, A., Wisor, J. P., Aicher, S. A., Brown, T. E., et al. (2021) · Brain Structure and Function · doi:10.1007/s00429-021-02229-4 · Cited by 55
Neural Correlates of Auditory Hypersensitivity in Fragile X Syndrome
Razak, K. A., Binder, D. K., & Ethell, I. M. (2021) · Frontiers in Psychiatry · doi:10.3389/fpsyt.2021.720752 · Cited by 55
Alterations of perineuronal nets in the dorsolateral prefrontal cortex of neuropsychiatric patients
Alcaide, J., Guirado, R., Crespo, C., Blasco-Ibáñez, J. M., Varea, E., Sanjuan, J., & Nacher, J. (2019) · International Journal of Bipolar Disorders · doi:10.1186/s40345-019-0161-0 · Cited by 51
Regulation of auditory plasticity during critical periods and following hearing loss
Persic, D., Thomas, M. E., Pelekanos, V., Ryugo, D. K., Takesian, A. E., Krumbholz, K., & Pyott, S. J. (2020) · Hearing Research · doi:10.1016/j.heares.2020.107976 · Cited by 51
The fate of interneurons, GABA A receptor sub‐types and perineuronal nets in Alzheimer's disease
Ali, A. B., Islam, A., & Constanti, A. (2022) · Brain Pathology · doi:10.1111/bpa.13129 · Cited by 49
Zhu, X., Cabungcal, J., Cuenod, M., Uliana, D., Do, K., & Grace, A. (2021) · Molecular Psychiatry · doi:10.1038/s41380-021-01198-8 · Cited by 41
Juvenile stress induces behavioral change and affects perineuronal net formation in juvenile mice
Ueno, H., Suemitsu, S., Murakami, S., Kitamura, N., Wani, K., Matsumoto, Y., Okamoto, M., Aoki, S., & Ishihara, T. (2018) · BMC Neuroscience · doi:10.1186/s12868-018-0442-z · Cited by 39
Perineuronal Net Protein Neurocan Inhibits NCAM/EphA3 Repellent Signaling in GABAergic Interneurons
Sullivan, C. S., Gotthard, I., Wyatt, E. V., Bongu, S., Mohan, V., Weinberg, R. J., & Maness, P. F. (2018) · Scientific Reports · doi:10.1038/s41598-018-24272-8 · Cited by 37
Chu, P., Abraham, R. R., Budhu, K., Khan, U., García, N. D. M., & Brumberg, J. C. (2018) · Neuroscience · doi:10.1016/j.neuroscience.2018.07.004 · Cited by 39
Fowke, T. M., Galinsky, R., Davidson, J. O., Wassink, G., Karunasinghe, R. N., Prasad, J. D., Bennet, L., Gunn, A. J., & Dean, J. M. (2018) · Scientific Reports · doi:10.1038/s41598-018-36083-y · Cited by 39
Cortical diurnal rhythms remain intact with microglial depletion
Barahona, R. A., Morabito, S., Swarup, V., & Green, K. N. (2022) · Scientific Reports · doi:10.1038/s41598-021-04079-w · Cited by 39
Consumption of a High-Fat Diet Alters Perineuronal Nets in the Prefrontal Cortex
Dingess, P. M., Harkness, J. H., Slaker, M. L., Zhang, Z., Wulff, S. S., Sorg, B. A., & Brown, T. E. (2018) · Neural Plasticity · doi:10.1155/2018/2108373 · Cited by 40
Neurocan Contributes to Perineuronal Net Development
Schmidt, S., Arendt, T., Morawski, M., & Sonntag, M. (2020) · Neuroscience · doi:10.1016/j.neuroscience.2020.06.040 · Cited by 36
Enzymatic Degradation of Cortical Perineuronal Nets Reverses GABAergic Interneuron Maturation
Willis, A., Pratt, J. A., & MORRIS, B. J. (2022) · Molecular Neurobiology · doi:10.1007/s12035-022-02772-z · Cited by 38
Zhang, L., Gao, Y.-Z., Zhao, C., Xia, J., Yang, J., & Ji, M. (2022) · Neuropharmacology · doi:10.1016/j.neuropharm.2022.109382 · Cited by 37
From molecules to behavior: Implications for perineuronal net remodeling in learning and memory
Sanchez, B., Kraszewski, P., Lee, S., & Cope, E. C. (2023) · Journal of Neurochemistry · doi:10.1111/jnc.16036 · Cited by 41
Nguyen, A., Khaleel, H. M., & Razak, K. A. (2017) · Hearing Research · doi:10.1016/j.heares.2017.04.015 · Cited by 36
Auditory Midbrain Hypoplasia and Dysmorphology after Prenatal Valproic Acid Exposure
Mansour, Y., Mangold, S., Chosky, D., & Kulesza, R. J. (2018) · Neuroscience · doi:10.1016/j.neuroscience.2018.11.016 · Cited by 36
Blanco, I., & Conant, K. E. (2020) · European Journal of Neuroscience · doi:10.1111/ejn.14910 · Cited by 42
Minocycline Treatment Reverses Sound Evoked EEG Abnormalities in a Mouse Model of Fragile X Syndrome
Lovelace, J. W., Ethell, I. M., Binder, D. K., & Razak, K. A. (2020) · Frontiers in Neuroscience · doi:10.3389/fnins.2020.00771 · Cited by 39
A conceptualized model linking matrix metalloproteinase-9 to schizophrenia pathogenesis
Bitanihirwe, B. K. Y., & Woo, T.-U. W. (2020) · Schizophrenia Research · doi:10.1016/j.schres.2019.12.015 · Cited by 35
Tendilla‐Beltrán, H., Sanchez-Islas, N. D. C., Marina-Ramos, M., Leza, J. C., & Flores, G. (2020) · Progress in Neurobiology · doi:10.1016/j.pneurobio.2020.101967 · Cited by 36
Regulation of the E/I-balance by the neural matrisome
Mueller-Buehl, C., Wegrzyn, D., Bauch, J., & Faissner, A. (2023) · Frontiers in Molecular Neuroscience · doi:10.3389/fnmol.2023.1102334 · Cited by 34
Reinhard, S. M., Rais, M., Afroz, S., Hanania, Y., Pendi, K., Espinoza, K., Rosenthal, R., Binder, D. K., Ethell, I. M., & Razak, K. A. (2019) · Neurobiology of Learning and Memory · doi:10.1016/j.nlm.2019.107042 · Cited by 37
Hernández‐Vivanco, A., Cano-Adamuz, N., Sánchez-Aguilera, A., González‐Alonso, A., Rodríguez-Fernández, A., Azcoitia, Í., de la Prida, L. M., & Méndez, P. (2022) · Nature Communications · doi:10.1038/s41467-022-31635-3 · Cited by 36
Saito, M., Smiley, J. F., Hui, M., Masiello, K., Betz, J., Ilina, M., Saito, M., & Wilson, D. A. (2018) · Cerebral Cortex · doi:10.1093/cercor/bhy034 · Cited by 32
The Role of Perineuronal Nets in Physiology and Disease: Insights from Recent Studies
Auer, S., Schicht, M., Hoffmann, L., Budday, S., Frischknecht, R., Blümcke, I., & Paulsen, F. P. (2025) · Cells · doi:10.3390/cells14050321 · Cited by 32
Burket, J. A., Webb, J. D., & Deutsch, S. I. (2021) · Biomolecules · doi:10.3390/biom11081235 · Cited by 31
Edamatsu, M., Miyano, R., Fujikawa, A., Fujii, F., Hori, T., Sakaba, T., & Oohashi, T. (2018) · Journal of Neurochemistry · doi:10.1111/jnc.14571 · Cited by 29
Kulinich, A. O., Reinhard, S. M., Rais, M., Lovelace, J. W., Scott, V., Binder, D. K., Razak, K. A., & Ethell, I. M. (2019) · Neurobiology of Disease · doi:10.1016/j.nbd.2019.104622 · Cited by 30
Bucher, E., Collins, J. M., King, A. E., Vickers, J. C., & Kirkcaldie, M. (2021) · Brain Structure and Function · doi:10.1007/s00429-021-02327-3 · Cited by 30
Juvenile Hippocampal CA2 Region Expresses Aggrecan
Noguchi, A., Matsumoto, N., Morikawa, S., Tamura, H., & Ikegaya, Y. (2017) · Frontiers in Neuroanatomy · doi:10.3389/fnana.2017.00041 · Cited by 29
Page, C. E., Alexander, J., Shepard, R. M., & Coutellier, L. D. (2018) · Genes Brain & Behavior · doi:10.1111/gbb.12459 · Cited by 31
Perineuronal Nets Restrict the Induction of Long-Term Depression in the Mouse Hippocampal CA1 Region
Khoo, G. H., Lin, Y.-T., Tsai, T.-C., & Hsu, K.-S. (2019) · Molecular Neurobiology · doi:10.1007/s12035-019-1526-1 · Cited by 29
Jakovljević, A., Tucić, M., Blažíková, M., Korenić, A., Missirlis, Y. F., Stamenković, V., & Anđjus, P. R. (2021) · Cells · doi:10.3390/cells10061345 · Cited by 32
Molecular neurobiology of loss: a role for basolateral amygdala extracellular matrix
Smail, M. A., Smith, B. L., Shukla, R., Alganem, K., Eby, H., Bollinger, J. L., Parikh, R. K., Chambers, J. B., Reigle, J. K., Moloney, R. D., et al. (2023) · Molecular Psychiatry · doi:10.1038/s41380-023-02231-8 · Cited by 27
Leveraging neural plasticity for the treatment of amblyopia
Birch, E. E., & Duffy, K. R. (2024) · Survey of Ophthalmology · doi:10.1016/j.survophthal.2024.04.006 · Cited by 30
Altered Relationship Between Parvalbumin and Perineuronal Nets in an Autism Model
Xia, D., Li, L., Yang, B., & Zhou, Q. (2021) · Frontiers in Molecular Neuroscience · doi:10.3389/fnmol.2021.597812 · Cited by 30
Cornez, G., Collignon, C., Müller, W., Cornil, C. A., Ball, G. F., & Balthazart, J. (2020) · eNeuro · doi:10.1523/eneuro.0361-19.2020 · Cited by 26
Orsini, C. A., Brown, T. E., Hodges, T. E., Alonso‐Caraballo, Y., Winstanley, C. A., & Becker, J. B. (2022) · Journal of Neuroscience · doi:10.1523/jneurosci.1378-22.2022 · Cited by 33
Liu, L., Zhang, Y., Men, S., Li, X., Hou, S., & Ju, J. (2023) · Hippocampus · doi:10.1002/hipo.23503 · Cited by 27
Li, X., Wu, X., Lu, T., Kuang, C., Si, Y., Zheng, W., Li, Z., & Xue, Y.-X. (2024) · International Journal of Molecular Sciences · doi:10.3390/ijms25063412 · Cited by 27
Net gain and loss: influence of natural rewards and drugs of abuse on perineuronal nets
Brown, T. E., & Sorg, B. A. (2022) · Neuropsychopharmacology · doi:10.1038/s41386-022-01337-x · Cited by 25
Lewin, M. P., Ilina, M., Betz, J., Masiello, K., Hui, M., Wilson, D. A., & Saito, M. (2017) · Neuroscience · doi:10.1016/j.neuroscience.2017.11.033 · Cited by 27
Cornez, G., Shevchouk, O. T., Ghorbanpoor, S., Ball, G. F., Cornil, C. A., & Balthazart, J. (2019) · Hormones and Behavior · doi:10.1016/j.yhbeh.2019.104643 · Cited by 25
Functional consequences of postnatal interventions in a mouse model of Fragile X syndrome
Rais, M., Lovelace, J. W., Shuai, X. S., Woodard, W., Bishay, S., Estrada, L., Sharma, A. R., Nguy, A. K., Kulinich, A. O., Pirbhoy, P. S., et al. (2021) · Neurobiology of Disease · doi:10.1016/j.nbd.2021.105577 · Cited by 25
Coleman, L. G., Crews, F. T., & Vetreno, R. P. (2021) · International review of neurobiology · doi:10.1016/bs.irn.2021.08.001 · Cited by 26
Tamura, H., Shiosaka, S., & Morikawa, S. (2017) · Neurochemistry International · doi:10.1016/j.neuint.2017.12.002 · Cited by 22
Sex and region-specific effects of high fat diet on PNNs in obesity susceptible rats
Dingess, P. M., Zhang, Z., Sorg, B. A., Ferrario, C. R., & Brown, T. E. (2020) · Physiology & Behavior · doi:10.1016/j.physbeh.2020.112963 · Cited by 21
Jorgensen, E. T., Gonzalez, A. E., Harkness, J. H., Hegarty, D. M., Thakar, A., Burchi, D. J., Aadland, J. A., Aicher, S. A., Sorg, B. A., & Brown, T. E. (2020) · Addiction Biology · doi:10.1111/adb.12947 · Cited by 20
Postnatal Arx transcriptional activity regulates functional properties of PV interneurons
Joseph, D. J., von Deimling, M., Hasegawa, Y., Cristancho, A. G., Ahrens‐Nicklas, R. C., Rogers, S. L., Risbud, R. M., McCoy, A. J., & Marsh, E. D. (2020) · iScience · doi:10.1016/j.isci.2020.101999 · Cited by 20
Parvalbumin interneuron-derived tissue-type plasminogen activator shapes perineuronal net structure
Lépine, M., Douceau, S., Devienne, G. F., Prunotto, P., Lenoir, S., Regnauld, C., Pouettre, E., Piquet, J., Lebouvier, L., Hommet, Y., et al. (2022) · BMC Biology · doi:10.1186/s12915-022-01419-8 · Cited by 21
Extracellular matrix abnormalities in the hippocampus of subjects with substance use disorder
Valeri, J., Stiplosek, C., O'Donovan, S. M., Sinclair, D., Grant, K. A., Bollavarapu, R., Platt, D. M., Stockmeier, C. A., Gisabella, B., & Pantazopoulos, H. (2024) · Translational Psychiatry · doi:10.1038/s41398-024-02833-y · Cited by 19
Metadata
- Authors
- Balmer, T. S.
- Affiliations
- Marine Biological Laboratory (US)
- Corresponding author
- Balmer, Timothy S.
- ORCID
- Balmer, Timothy S.
- Venue
- eneuro
- Publisher
- Society for Neuroscience
- Published
- 2016-07
- Volume
- 3
- Issue
- 4
- Pages
- ENEURO.0112-16.2016
- ISSN
- 2373-2822 (ISSN-L)
- PMC
- PMC4987413
- OpenAlex
- W2467652827
- Cited by
- 220
- References
- 63
- Citations by year
- 2026: 13 · 2025: 26 · 2024: 24 · 2023: 18 · 2022: 19 · 2021: 22 · 2020: 28 · 2019: 24 · 2018: 28 · 2017: 18
- FWCI
- 13.09
- Type
- journal article
- Language
- en
- Open access
- gold
- doi.org
- Locations
- eNeuro (publishedVersion, cc-by)
- PubMed Central (publishedVersion, cc-by)
- PubMed (publishedVersion)
- Open Access Server of the Woods Hole Scientific Community (Woods Hole Scientific Community) (submittedVersion, cc-by)
- Funders
- Grass Foundation
- Topics
- Life Sciences › Neuroscience › Cellular and Molecular Neuroscience › Neuroscience and Neuropharmacology Research
- Life Sciences › Neuroscience › Sensory Systems › Hearing, Cochlea, Tinnitus, Genetics
- Life Sciences › Neuroscience › Cognitive Neuroscience › Neural dynamics and brain function
- Keywords
- perineuronal nets, fast-spiking neurons, neuronal excitability, medial nucleus of the trapezoid body, auditory brainstem, chondroitinase ABC, extracellular matrix, parvalbumin interneurons, spike threshold, synaptic inhibition, sensory transmission
- MeSH terms
- Action Potentials, Analysis of Variance, Animals, Central Nervous System Agents, Extracellular Matrix, Female, Immunohistochemistry, Male, Mice, Inbred C57BL, Microscopy, Fluorescence, Neurons, Penicillinase, Patch-Clamp Techniques, Chondroitin ABC Lyase, Tissue Culture Techniques, Superior Olivary Complex
About these checks
Registry, retraction, Cites and statistics results are computed, not judged, with one exception: a printed reference that no index lists is read once by a model before it counts as a citation error. Claims are extracted by a model and kept only when their quote appears verbatim in the text; each cited source is then checked, with a model’s help, for whether it says what the claim relies on. Those verdicts can be wrong — read the claim’s quote and the cited source before relying on one.
Statistics and arithmetic are recomputed, not judged.
Confidence bands are shown only for fields calibrated on our annotated test set. None is calibrated yet, so no band is shown.
What counts as a claim ›How we measure confidence ›How we check this ›
Are you an author, or do you see a problem with this page? Request a review
