

The DOI matches its Crossref record; 55 of the 56 references it cites were found in a registry or an index.
Gut Vagal Afferents Differentially Modulate Innate Anxiety and Learned Fear
Open accessAbstract
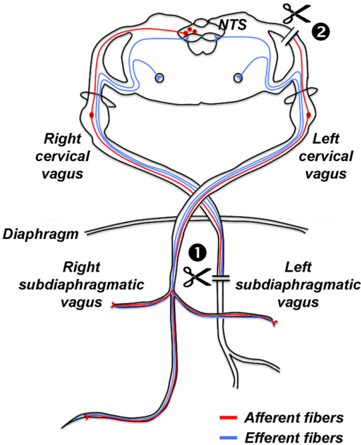
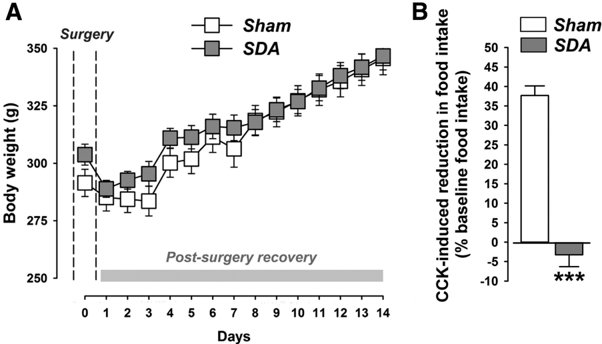
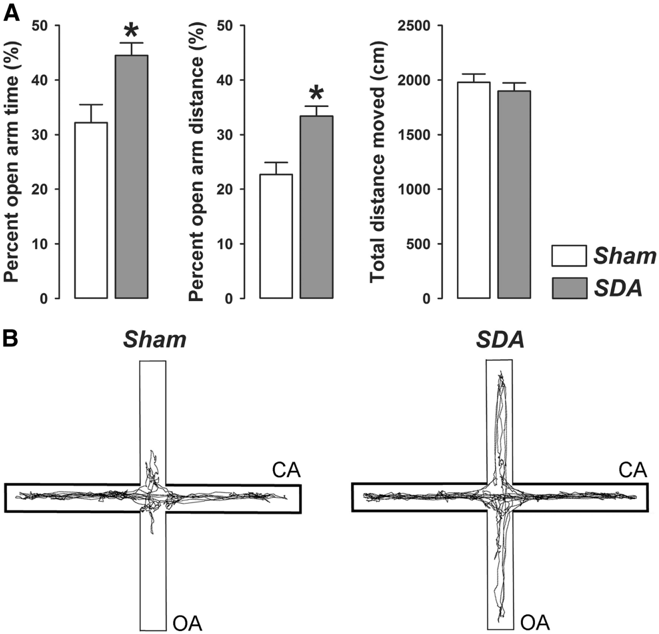
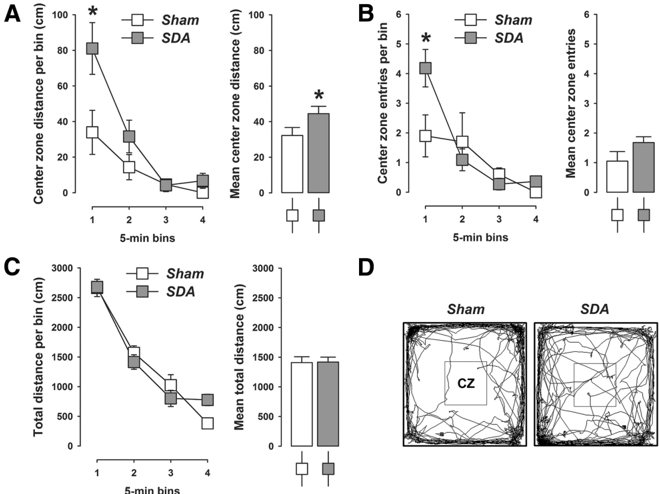
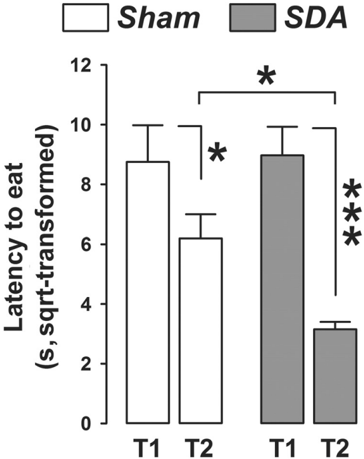
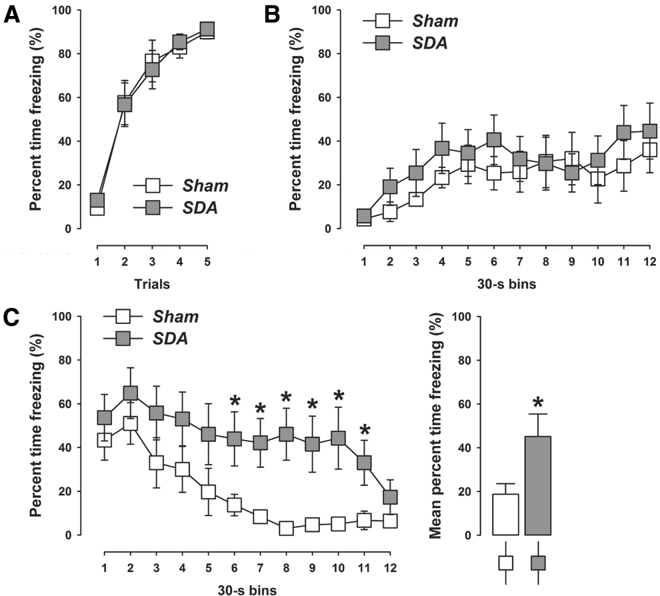
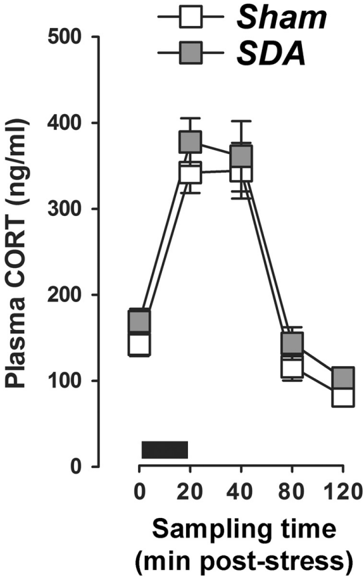
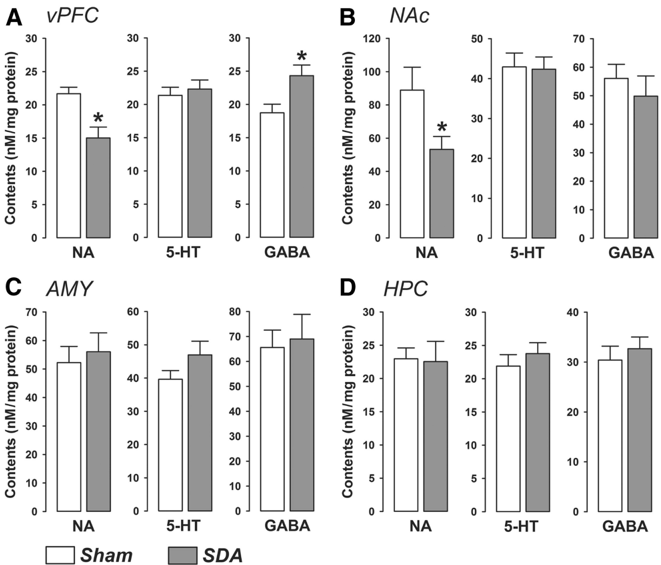
Vagal afferents are an important neuronal component of the gut–brain axis allowing bottom-up information flow from the viscera to the CNS. In addition to its role in ingestive behavior, vagal afferent signaling has been implicated modulating mood and affect, including distinct forms of anxiety and fear. Here, we used a rat model of subdiaphragmatic vagal deafferentation (SDA), the most complete and selective vagal deafferentation method existing to date, to study the consequences of complete disconnection of abdominal vagal afferents on innate anxiety, conditioned fear, and neurochemical parameters in the limbic system. We found that compared with Sham controls, SDA rats consistently displayed reduced innate anxiety-like behavior in three procedures commonly used in preclinical rodent models of anxiety, namely the elevated plus maze test, open field test, and food neophobia test. On the other hand, SDA rats exhibited increased expression of auditory-cued fear conditioning, which specifically emerged as attenuated extinction of conditioned fear during the tone re-exposure test. The behavioral manifestations in SDA rats were associated with region-dependent changes in noradrenaline and GABA levels in key areas of the limbic system, but not with functional alterations in the hypothalamus-pituitary-adrenal grand stress. Our study demonstrates that innate anxiety and learned fear are both subjected to visceral modulation through abdominal vagal afferents, possibly via changing limbic neurotransmitter systems. These data add further weight to theories emphasizing an important role of afferent visceral signals in the regulation of emotional behavior.
Overview
The claims and statistics of this paper haven’t been checked yet.
Run the check — free, no account needed. It reads the open-access text and checks the sources it cites.
Integrity signals
Registry
Cites
Statistics
Figures
Verification
Claims the paper makes
The claims and statistics of this paper haven’t been checked yet.
Run the check — free, no account needed. It reads the open-access text and checks the sources it cites.
Claims other papers make about this one
Each is checked against this paper’s own text: does it say what the citing paper says it does?
The cited source says what the claim attributes to it.
In the citing paper
“Recently, it has been shown that gut vagal afferents also influence anxiety and learned fear (Klarer et al. 2014).”
From Motion sickness: more than nausea and vomiting (2014) · cites this paper as Klarer et al. 2014
The cited source says what the claim attributes to it.
In the citing paper
“In addition, subdiaphragmatic vagal deafferentation (Vazquez et al., 2016) a method that eliminates abdominal vagal afferents, but keeps most efferents intact (Norgren and Smith, 1994) highlights the involvement of vagal afferents in anxiety-like (elevated plus maze, open-field test, food neophobia) and fear-related behavior (auditory-cued fear conditioning) (Klarer et al.,”
From The Microbiota-Gut-Brain Axis (2019) · cites this paper as Klarer et al., 2014
Self-check
Percentages, sums and reported differences re-computed from the paper’s own numbers.
The self-check needs the paper’s full text.
Citations
Cites
The Rat Brain in Stereotaxic Coordinates
Paxinos, G., & Watson, C. (1983) · Elsevier eBooks · doi:10.1016/c2009-0-63235-9 · Cited by 28,585
Mind-altering microorganisms: the impact of the gut microbiota on brain and behaviour
Cryan, J. F., & Dinan, T. G. (2012) · Nature Reviews Neuroscience · doi:10.1038/nrn3346 · Cited by 4,572
AChE-stained horizontal sections of the rat brain in stereotaxic coordinates
Paxinos, G., WATSON, C. R. R., & Emson, P. C. (1980) · Journal of Neuroscience Methods · doi:10.1016/0165-0270(80)90021-7 · Cited by 4,514
Bravo, J. A., Forsythe, P., Chew, M. V., Escaravage, E., Savignac, H. M., Dinan, T. G., Bienenstock, J., & Cryan, J. F. (2011) · Proceedings of the National Academy of Sciences · doi:10.1073/pnas.1102999108 · Cited by 3,888
Normal gut microbiota modulates brain development and behavior
Heijtz, R. D., Wang, S., Anuar, F., Qian, Y., Björkholm, B., Samuelsson, A., Hibberd, M. L., Forssberg, H., & Pettersson, S. (2011) · Proceedings of the National Academy of Sciences · doi:10.1073/pnas.1010529108 · Cited by 3,228
Contributions of the Amygdala to Emotion Processing: From Animal Models to Human Behavior
Phelps, E. A., & LeDoux, J. E. (2005) · Neuron · doi:10.1016/j.neuron.2005.09.025 · Cited by 3,203 · cited 1×
“First, while the AMY and HPC play prominent roles in the acquisition and expression of auditory-cued and contextual fear responses, respectively (Phelps and LeDoux, 2005; Maren et al., 2013), the vPFC strongly regulates the extinction of conditioned fear (SotresBayon et al., 2006).”
BackgroundThe somatic marker hypothesis and the possible functions of the prefrontal cortex
Damasio, A. R. (1996) · Philosophical Transactions of the Royal Society of London. Series B: Biological Sciences · doi:10.1098/rstb.1996.0125 · Cited by 2,847 · cited 1×
“Such feelings are typically conceptualized as somatic signals that influence de- cision making and behavioral responses without explicit awareness of the provoking cues (Damasio, 1996; Kahneman and Klein, 2009; Mayer, 2011).”
BackgroundConditions for intuitive expertise: A failure to disagree.
Kahneman, D., & Klein, G. (2009) · American Psychologist · doi:10.1037/a0016755 · Cited by 2,443
The Neurocircuitry of Fear, Stress, and Anxiety Disorders
Shin, L. M., & Liberzon, I. (2010) · Neuropsychopharmacology · doi:10.1038/npp.2009.83 · Cited by 2,083 · cited 2×
“Based on the behavioral changes identified in SDA rats, we predicted neurochemical abnormalities in key areas of the limbic system (Bannerman et al., 2004; Sotres-Bayon et al., 2006; Shin and Liberzon, 2010; Maren et al., 2013).”
BackgroundGut feelings: the emerging biology of gut-brain communication
Mayer, E. A. (2011) · Nature Reviews Neuroscience · doi:10.1038/nrn3071 · Cited by 1,726
Cited by
Sorted by citations
Cryan, J. F., O'Riordan, K. J., Cowan, C. S. M., Sandhu, K. V., Bastiaanssen, T. F. S., Boehme, M., Codagnone, M. G., Cussotto, S., Fulling, C., Golubeva, A. V., et al. (2019) · Physiological Reviews · doi:10.1152/physrev.00018.2018 · Cited by 5,286
Izquierdo, I., Furini, C. R. G., & Myskiw, J. C. (2016) · Physiological Reviews · doi:10.1152/physrev.00018.2015 · Cited by 453
The neuroendocrinology of the microbiota-gut-brain axis: a behavioural perspective
Cussotto, S., Sandhu, K. V., Dinan, T. G., & Cryan, J. F. (2018) · Frontiers in Neuroendocrinology · doi:10.1016/j.yfrne.2018.04.002 · Cited by 326
“was associated with region-dependent changes in noradrenaline and ɣ-aminobutyric acid (GABA) levels in key areas of the limbic system, but not with functional alterations in the HPA axis (Klarer et al., 2014).”
BackgroundMotion sickness: more than nausea and vomiting
Lackner, J. R. (2014) · Experimental Brain Research · doi:10.1007/s00221-014-4008-8 · Cited by 314
“Recently, it has been shown that gut vagal afferents also influence anxiety and learned fear (Klarer et al. 2014).”
BackgroundSherwin, E., Sandhu, K. V., Dinan, T. G., & Cryan, J. F. (2016) · CNS Drugs · doi:10.1007/s40263-016-0370-3 · Cited by 309
Relaxation techniques for pain management in labour
Smith, C. A., Levett, K. M., Collins, C. T., Armour, M., Dahlen, H. G., & Suganuma, M. (2018) · Cochrane Database of Systematic Reviews · doi:10.1002/14651858.cd009514.pub2 · Cited by 307
Knockdown of GLP-1 Receptors in Vagal Afferents Affects Normal Food Intake and Glycemia
Krieger, J.-P., Arnold, M., Pettersen, K. G., Lossel, P., Langhans, W., & Lee, S. J. (2016) · Diabetes · doi:10.2337/db15-0973 · Cited by 269
Self-citationStilling, R. M., Ryan, F. J., Hoban, A. E., Shanahan, F., Clarke, G., Claesson, M. J., Dinan, T. G., & Cryan, J. F. (2015) · Brain Behavior and Immunity · doi:10.1016/j.bbi.2015.07.009 · Cited by 233
Neuropod Cells: The Emerging Biology of Gut-Brain Sensory Transduction
Kaelberer, M. M., Rupprecht, L. E., Liu, W. W., Weng, P., & Bohórquez, D. V. (2020) · Annual Review of Neuroscience · doi:10.1146/annurev-neuro-091619-022657 · Cited by 236
“Vagal afferents arising in the intestine also transsynaptically project to the dorsal hippocampus (Suarez et al. 2018) and prefrontal cortex (Klarer et al. 2014).”
BackgroundGut vagal sensory signaling regulates hippocampus function through multi-order pathways
Suarez, A. N., Hsu, T. M., Liu, C. M., Noble, E. E., Cortella, A. M., Nakamoto, E. M., Hahn, J. D., de Lartigue, G., & Kanoski, S. E. (2018) · Nature Communications · doi:10.1038/s41467-018-04639-1 · Cited by 212
Harnessing Gut Microbes for Mental Health: Getting From Here to There
Bruce‐Keller, A. J., Salbaum, J. M., & Berthoud, H. (2017) · Biological Psychiatry · doi:10.1016/j.biopsych.2017.08.014 · Cited by 192
The physiological control of eating: signals, neurons, and networks
Watts, A. G., Kanoski, S. E., Sanchez-Watts, G., & Langhans, W. (2022) · Physiological Reviews · doi:10.1152/physrev.00028.2020 · Cited by 168
Self-citationThe vagus nerve modulates BDNF expression and neurogenesis in the hippocampus
O’Leary, O. F., Ogbonnaya, E. S., Felice, D., Levone, B. R., C. Conroy, L., Fitzgerald, P., Bravo, J. A., Forsythe, P., Bienenstock, J., Dinan, T. G., et al. (2018) · European Neuropsychopharmacology · doi:10.1016/j.euroneuro.2017.12.004 · Cited by 151
Homeostatic and non-homeostatic controls of feeding behavior: Distinct vs. common neural systems
Liu, C. M., & Kanoski, S. E. (2018) · Physiology & Behavior · doi:10.1016/j.physbeh.2018.02.011 · Cited by 131
Malézieux, M., Klein, A. S., & Gogolla, N. (2023) · Annual Review of Neuroscience · doi:10.1146/annurev-neuro-111020-103314 · Cited by 144
The effects of transcutaneous vagus nerve stimulation on conditioned fear extinction in humans.
Burger, A., Verkuil, B., Diest, I. V., van der Does, W., Thayer, J., & Brosschot, J. (2016) · Neurobiology of Learning and Memory · doi:10.1016/j.nlm.2016.05.007 · Cited by 123
Jandackova, V. K., Britton, A. R., Malík, M., & Steptoe, A. (2016) · Psychological Medicine · doi:10.1017/s003329171600060x · Cited by 138
Tette, F.-M., Kwofie, S. K., & Wilson, M. D. (2022) · Current Issues in Molecular Biology · doi:10.3390/cimb44040096 · Cited by 119
Gutsy Moves: The Amygdala as a Critical Node in Microbiota to Brain Signaling
Cowan, C. S. M., Hoban, A. E., Ventura‐Silva, A. P., Dinan, T. G., Clarke, G. A., & Cryan, J. F. (2017) · BioEssays · doi:10.1002/bies.201700172 · Cited by 110
Zinc in Gut-Brain Interaction in Autism and Neurological Disorders
Vela, G., Stark, P., Socha, M. T., Sauer, A. K., Hagmeyer, S., & Grabrucker, A. M. (2015) · Neural Plasticity · doi:10.1155/2015/972791 · Cited by 105
Livneh, Y., & Andermann, M. L. (2021) · Neuron · doi:10.1016/j.neuron.2021.08.036 · Cited by 105
The gut-brain axis and cognitive control: A role for the vagus nerve
Décarie-Spain, L., Hayes, A., Lauer, L. T., & Kanoski, S. E. (2023) · Seminars in Cell and Developmental Biology · doi:10.1016/j.semcdb.2023.02.004 · Cited by 97
Sensory Nutrition and Bitterness and Astringency of Polyphenols
Osakabe, N., Shimizu, T., Fujii, Y., Fushimi, T., & Calabrese, V. (2024) · Biomolecules · doi:10.3390/biom14020234 · Cited by 102
Cicco, V. D., Fantozzi, M. P. T., Cataldo, E., Barresi, M., Bruschini, L., Faraguna, U., & Manzoni, D. (2018) · Frontiers in Neuroanatomy · doi:10.3389/fnana.2017.00130 · Cited by 95
Holtmann, G., & Talley, N. J. (2014) · Best Practice & Research Clinical Gastroenterology · doi:10.1016/j.bpg.2014.10.001 · Cited by 96
Modulation of Fear Extinction by Stress, Stress Hormones and Estradiol: A Review
Stockhorst, U., & Antov, M. I. (2016) · Frontiers in Behavioral Neuroscience · doi:10.3389/fnbeh.2015.00359 · Cited by 96
Vagal Interoceptive Modulation of Motivated Behavior
Maniscalco, J. W., & Rinaman, L. (2018) · Physiology · doi:10.1152/physiol.00036.2017 · Cited by 83
Olanzapine-induced lipid disturbances: A potential mechanism through the gut microbiota-brain axis
Zhu, Z., Gu, Y., Zeng, C., Yang, M., Yu, H., Chen, H., Zhang, B., & Cai, H. (2022) · Frontiers in Pharmacology · doi:10.3389/fphar.2022.897926 · Cited by 79
The role of the gut–brain axis in alcohol use disorders
Gorky, J. M., & Schwaber, J. S. (2015) · Progress in Neuro-Psychopharmacology and Biological Psychiatry · doi:10.1016/j.pnpbp.2015.06.013 · Cited by 82
Burger, A. M., Verkuil, B., Fenlon, H., Thijs, L., Cools, L., Miller, H. C., Vervliet, B., & Diest, I. V. (2017) · Behaviour Research and Therapy · doi:10.1016/j.brat.2017.07.005 · Cited by 74
Welch, M. G. (2016) · Acta Paediatrica · doi:10.1111/apa.13547 · Cited by 64
The Role of the Gut-Brain Axis in Attention-Deficit/Hyperactivity Disorder
Dam, S. A., Mostert, J. C., Szopinska-Tokov, J., Bloemendaal, M., Amato, M. P., & Vásquez, A. A. (2019) · Gastroenterology Clinics of North America · doi:10.1016/j.gtc.2019.05.001 · Cited by 66
Stress increases hepatic release of lipocalin 2 which contributes to anxiety-like behavior in mice
Yan, L., Yang, F., Wang, Y., Shi, L., Wang, M., Yang, D., Wang, W., Jia, Y., So, K.-F., & Zhang, L. (2024) · Nature Communications · doi:10.1038/s41467-024-47266-9 · Cited by 63
Glucagon-like peptide-1 regulates brown adipose tissue thermogenesis via the gut-brain axis in rats
Krieger, J.-P., da Conceição, E. P. S., Sanchez‐Watts, G., Arnold, M., Pettersen, K. G., Mohammed, M., Modica, S., Lossel, P., Morrison, S. F., Madden, C. J., et al. (2018) · American Journal of Physiology-Regulatory, Integrative and Comparative Physiology · doi:10.1152/ajpregu.00068.2018 · Cited by 66
Self-citationZhao, Z., Wang, B., Mu, L., Wang, H., Luo, J., Yang, Y., Yang, H., Li, M., Zhou, L., & Tao, C. (2020) · Frontiers in Cellular and Infection Microbiology · doi:10.3389/fcimb.2020.00258 · Cited by 57
The contribution of age-related changes in the gut-brain axis to neurological disorders
Khan, R., Gesù, C. M. D., Lee, J., & McCullough, L. D. (2024) · Gut Microbes · doi:10.1080/19490976.2024.2302801 · Cited by 62
Burger, A. M., Diest, I. V., van der Does, W. A. J., Korbee, J. N., Waziri, N., BROSSCHOT, J. F., & Verkuil, B. (2019) · Neurobiology of Learning and Memory · doi:10.1016/j.nlm.2019.04.006 · Cited by 58
Rathour, D., Shah, S., Khan, S., Singh, P. K., Srivastava, S., Singh, S. B., & Khatri, D. K. (2022) · Behavioural Brain Research · doi:10.1016/j.bbr.2022.114081 · Cited by 58
Enduring neurobehavioral effects induced by microbiota depletion during the adolescent period
Lach, G., Fülling, C., Bastiaanssen, T. F. S., Fouhy, F., Donovan, A. N. O., Ventura‐Silva, A. P., Stanton, C., Dinan, T. G., & Cryan, J. F. (2020) · Translational Psychiatry · doi:10.1038/s41398-020-01073-0 · Cited by 57
Zou, Q., Han, S., Liang, J., Yan, G., Wang, Q., Wang, Y., Zhang, Z., Hu, J., Li, J., Tian, Y., et al. (2024) · Brain Behavior and Immunity · doi:10.1016/j.bbi.2024.04.034 · Cited by 54
Novel developments in vagal afferent nutrient sensing and its role in energy homeostasis
de Lartigue, G., & Diepenbroek, C. (2016) · Current Opinion in Pharmacology · doi:10.1016/j.coph.2016.08.007 · Cited by 54
Suarez, A. N., Noble, E. E., & Kanoski, S. E. (2019) · Frontiers in Molecular Neuroscience · doi:10.3389/fnmol.2019.00101 · Cited by 55
Potential gut–brain mechanisms behind adverse mental health outcomes of bariatric surgery
Brown, R. M., Guerrero-Hreins, E., Brown, W. A., le Roux, C. W., & Sumithran, P. (2021) · Nature Reviews Endocrinology · doi:10.1038/s41574-021-00520-2 · Cited by 49
Krieger, J.-P., Asker, M., van der Velden, P., Börchers, S., Richard, J. E., Marić, I., Longo, F., Singh, A., de Lartigue, G., & Skibicka, K. P. (2022) · Biological Psychiatry · doi:10.1016/j.biopsych.2022.04.020 · Cited by 49
Calming Cycle Theory and the Co-Regulation of Oxytocin
Welch, M. G., & Ludwig, R. J. (2017) · Psychodynamic Psychiatry · doi:10.1521/pdps.2017.45.4.519 · Cited by 49
A review of analgesic and emotive breathing: a multidisciplinary approach
Bordoni, B., Marelli, F., & Bordoni, G. (2016) · Journal of Multidisciplinary Healthcare · doi:10.2147/jmdh.s101208 · Cited by 46
Stimulation of the vagus nerve reduces learning in a go/no-go reinforcement learning task
Kühnel, A., Teckentrup, V., Neuser, M. P., Huys, Q. J. M., Burrasch, C., Walter, M., & Kroemer, N. B. (2020) · European Neuropsychopharmacology · doi:10.1016/j.euroneuro.2020.03.023 · Cited by 43
Cordner, Z. A., Li, Q., Liu, L., Tamashiro, K. L., Bhargava, A., Moran, T. H., & Pasricha, P. J. (2021) · JCI Insight · doi:10.1172/jci.insight.144046 · Cited by 45
Mechanisms of microbiota-gut-brain axis communication in anxiety disorders
Jiang, M., Li, K., Wang, Y., Zhou, B., Li, H.-Y., Yan, Q., & Liu, Z.-G. (2024) · Frontiers in Neuroscience · doi:10.3389/fnins.2024.1501134 · Cited by 52
Hou, X., Rong, C., Wang, F., Liu, X., Sun, Y., & Zhang, H. (2020) · Neural Plasticity · doi:10.1155/2020/8858415 · Cited by 42
Abdominal Vagal Afferents Modulate the Brain Transcriptome and Behaviors Relevant to Schizophrenia
Klarer, M., Krieger, J.-P., Richetto, J., Weber-Stadlbauer, U., Günther, L., Winter, C., Arnold, M., Langhans, W., & Meyer, U. (2018) · The Journal of Neuroscience · doi:10.1523/jneurosci.0813-17.2017 · Cited by 38
Self-citationHead, Heart, and Gut in Decision Making: Development of a Multiple Brain Preference Questionnaire
Soosalu, G., Henwood, S. M., & Deo, A. (2019) · SAGE Open · doi:10.1177/2158244019837439 · Cited by 52
Darwin’s Other Dilemmas and the Theoretical Roots of Emotional Connection
Ludwig, R. J., & Welch, M. G. (2019) · Frontiers in Psychology · doi:10.3389/fpsyg.2019.00683 · Cited by 42
Gesù, C. M. D., Matz, L. M., & Buffington, S. A. (2021) · Neuroscience Research · doi:10.1016/j.neures.2021.05.003 · Cited by 47
Altered Vagal Signaling and Its Pathophysiological Roles in Functional Dyspepsia
Li, H., & Page, A. J. (2022) · Frontiers in Neuroscience · doi:10.3389/fnins.2022.858612 · Cited by 37
The gut microbiota modulate locomotion via vagus-dependent glucagon-like peptide-1 signaling
Lai, T.-T., Tsai, Y.-H., Liou, C.-W., Fan, C., Hou, Y.-T., Yao, T.-H., Chuang, H.-L., & Wu, W. (2024) · npj Biofilms and Microbiomes · doi:10.1038/s41522-024-00477-w · Cited by 40
Lyte, J. M. (2019) · Frontiers in Endocrinology · doi:10.3389/fendo.2018.00796 · Cited by 35
Gut microbiome in neuroendocrine and neuroimmune interactions: The case of genistein
Guo, T. L., Chen, Y., Xu, H. S., McDonough, C. M., & Huang, G. (2020) · Toxicology and Applied Pharmacology · doi:10.1016/j.taap.2020.115130 · Cited by 35
Ota, A., Yamamoto, A., Kimura, S., Mori, Y., Mizushige, T., Nagashima, Y., Satô, M., Suzuki, H., Odagiri, S., Yamada, D., et al. (2017) · Neurochemistry International · doi:10.1016/j.neuint.2016.12.020 · Cited by 34
Brain signaling dynamics after vagus nerve stimulation
Teckentrup, V., Krylova, M., Jamalabadi, H., Neubert, S., Neuser, M. P., Hartig, R., Fallgatter, A. J., Walter, M., & Kroemer, N. B. (2021) · NeuroImage · doi:10.1016/j.neuroimage.2021.118679 · Cited by 30
Maeng, L. Y., & Beumer, A. (2023) · International Journal of Psychophysiology · doi:10.1016/j.ijpsycho.2023.05.350 · Cited by 31
Zhong, S., Liu, F., Giniatullin, R. A., Jolkkonen, J., Li, Y., Zhou, Z., Lin, X., Liu, C., Zhang, X., Liu, Z., et al. (2023) · Cell Reports · doi:10.1016/j.celrep.2023.113386 · Cited by 30
Mechanistic insights into the liver–brain axis during chronic liver disease
Siddle, M. R., Durán, R. G., Goel, D., Renquist, B. J., Holt, M. K., & Hadjihambi, A. (2025) · Nature Reviews Gastroenterology & Hepatology · doi:10.1038/s41575-025-01142-z · Cited by 36
Gargus, M., Ben‐Azu, B., Landwehr, A., Dunn, J., Errico, J. P., & Tremblay, M. (2025) · Frontiers in Neuroscience · doi:10.3389/fnins.2024.1527842 · Cited by 32
A Brain-Melanocortin-Vagus Axis Mediates Adipose Tissue Expansion Independently of Energy Intake
Holland, J., Sorrell, J. E., Yates, E., Smith, K., Arbabi, S., Arnold, M., Rivir, M., Morano, R. L., Chen, J., Zhang, X., et al. (2019) · Cell Reports · doi:10.1016/j.celrep.2019.04.089 · Cited by 28
Self-citationThe Potential Effects of Radiation on the Gut-Brain Axis
Jones, C. B., Davis, C. M., & Sfanos, K. S. (2020) · Radiation Research · doi:10.1667/rr15493.1 · Cited by 27
The vagus nerve mediates the stomach-brain coherence in rats
Cao, J., Wang, X., Chen, J., Zhang, N., & Liu, Z. (2022) · NeuroImage · doi:10.1016/j.neuroimage.2022.119628 · Cited by 25
Riehl, L., Fürst, J., Kress, M., & Rykalo, N. A. (2024) · Frontiers in Neuroscience · doi:10.3389/fnins.2023.1302957 · Cited by 30
Cognitive effects of subdiaphragmatic vagal deafferentation in rats
Klarer, M., Weber-Stadlbauer, U., Arnold, M., Langhans, W., & Meyer, U. (2017) · Neurobiology of Learning and Memory · doi:10.1016/j.nlm.2017.05.006 · Cited by 25
Self-citationEffect of estrogen on vagal afferent projections to the brainstem in the female
Ciriello, J., & Caverson, M. M. (2016) · Brain Research · doi:10.1016/j.brainres.2016.01.041 · Cited by 23
Bruch, J. D. (2016) · Brain Behavior and Immunity · doi:10.1016/j.bbi.2016.05.014 · Cited by 23
Dedicated C‐fibre viscerosensory pathways to central nucleus of the amygdala
McDougall, S. J., Guo, H., & Andresen, M. C. (2016) · The Journal of Physiology · doi:10.1113/jp272898 · Cited by 23
James, D. M., Davidson, E. A., Yanes, J. A., Moshiree, B., & Dallman, J. E. (2021) · Frontiers in Cell and Developmental Biology · doi:10.3389/fcell.2021.662916 · Cited by 25
Rioux, C. (2019) · Springer eBooks · doi:10.1007/978-3-032-03228-7_159 · Cited by 22
Rodríguez, M., Cerić, F., Murgas, P., Harland, B. C., Torrealba, F., & Contreras, M. (2020) · Frontiers in Behavioral Neuroscience · doi:10.3389/fnbeh.2019.00283 · Cited by 22
Donovan, H. S., Thomas, T. H., Campbell, G. B., Boisen, M. M., Rosenblum, L., Edwards, R. P., Bovbjerg, D. H., & Horn, C. C. (2016) · Supportive Care in Cancer · doi:10.1007/s00520-015-3071-4 · Cited by 23
Wang, X., Zhang, Y., Chang, Y., Zhu, Y., Xiang, G., Chen, K., Feng, C., Hang, Z., Li, X., & Zhang, D. (2025) · Journal of Nanobiotechnology · doi:10.1186/s12951-025-03551-3 · Cited by 23
Chen, C., Tsai, T.-C., Wu, Y., & Hsu, K. (2023) · JCI Insight · doi:10.1172/jci.insight.161874 · Cited by 22
A review of the auditory-gut-brain axis
Graham, A. S., Ben‐Azu, B., Tremblay, M., Torre, P., Senekal, M., Laughton, B., van der Kouwe, A. J. W., Jankiewicz, M., Kaba, M., & Holmes, M. (2023) · Frontiers in Neuroscience · doi:10.3389/fnins.2023.1183694 · Cited by 22
Nishigaki, R., Yokoyama, Y., Shimizu, Y., Marumoto, R., Misumi, S., Ueda, Y., Ishida, A., Shibuya, Y., & Hida, H. (2018) · Brain Research · doi:10.1016/j.brainres.2018.04.006 · Cited by 18
Physiological Needs: Sensations and Predictions in the Insular Cortex
Prilutski, Y., & Livneh, Y. (2022) · Physiology · doi:10.1152/physiol.00019.2022 · Cited by 18
The gut-brain vagal axis scales hippocampal memory processes and plasticity
Onimus, O., Arrivet, F., Souza, I. N. D. O., Bertrand, B., Castel, J., Luquet, S. H., Mothet, J., Heck, N., & Gangarossa, G. (2024) · Neurobiology of Disease · doi:10.1016/j.nbd.2024.106569 · Cited by 17
Leng, H., Zhang, X., Wang, Q., Luan, X., Sun, X., Guo, F., Gao, S., Liu, X., & Xu, L. (2019) · Neurogastroenterology & Motility · doi:10.1111/nmo.13655 · Cited by 16
Benoit, S., Chaumontet, C., Violle, N., Boulier, A., Hafeez, Z., Cakir‐Kiefer, C., Tomé, D., Schwarz, J., & Miclo, L. (2022) · Nutrients · doi:10.3390/nu14112212 · Cited by 16
What goes around comes around: novel pharmacological targets in the gut–brain axis
González‐Arancibia, C., Escobar-Luna, J., Barrera-Bugueño, C., Díaz-Zepeda, C., González-Toro, M. P., Olavarría‐Ramírez, L., Zanelli-Massai, F., Gotteland, M., Bravo, J. A., & Julio‐Pieper, M. (2016) · Therapeutic Advances in Gastroenterology · doi:10.1177/1756283x16630718 · Cited by 17
Gut–brain communication: types of sensory nerves and mechanisms of activation
Spencer, N. J., Hibberd, T. J., & Hu, H. (2025) · Nature Reviews Gastroenterology & Hepatology · doi:10.1038/s41575-025-01132-1 · Cited by 20
Mental Disorders Linked to Crosstalk between The Gut Microbiome and The Brain
Choi, T.-Y., Choi, Y. P., & Koo, J. W. (2020) · Experimental Neurobiology · doi:10.5607/en20047 · Cited by 18
Abdominal vagal deafferentation alters affective behaviors in rats
Klarer, M., Weber‐Stadlbauer, U., Arnold, M., Langhans, W., & Meyer, U. (2019) · Journal of Affective Disorders · doi:10.1016/j.jad.2019.04.015 · Cited by 17
Self-citationOsteopathic Treatment Approach to Psychoemotional Trauma by Means of Bifocal Integration
Liem, T., & Neuhuber, W. (2020) · Journal of Osteopathic Medicine · doi:10.7556/jaoa.2020.021 · Cited by 15
Sodium oligomannate activates the enteroendocrine-vagal afferent pathways in APP/PS1 mice
Gong, H., Pan, J.-P., Guo, F., Wu, M., Li, D., Li, Y., & Rong, W. (2024) · Acta Pharmacologica Sinica · doi:10.1038/s41401-024-01293-w · Cited by 15
The gut microbiome and the brain
Rykalo, N. A., Riehl, L., & Kress, M. (2024) · Current Opinion in Supportive and Palliative Care · doi:10.1097/spc.0000000000000717 · Cited by 16
Robison, W. T., Myers, M. M., Hofer, M. A., Shair, H. N., & Welch, M. G. (2016) · Developmental Psychobiology · doi:10.1002/dev.21408 · Cited by 14
Mother/Infant Emotional Communication Through the Lens of Visceral/Autonomic Learning
Welch, M. G., & Ludwig, R. J. (2017) · Springer eBooks · doi:10.1007/978-3-319-65077-7_15 · Cited by 12
Wang, Q., Zhang, X., Leng, H., Luan, X., Guo, F., Sun, X., Gao, S., Liu, X., Qin, H., & Xu, L. (2020) · Neuropeptides · doi:10.1016/j.npep.2020.102018 · Cited by 11
Vagotomy and the risk of mental disorders: A nationwide population‐based study
Bunyoz, A. H., Christensen, R. H. B., Orlovska‐Waast, S., Nordentoft, M., Mortensen, P. B., Petersen, L. V., & Benros, M. E. (2021) · Acta Psychiatrica Scandinavica · doi:10.1111/acps.13343 · Cited by 11
Zhang, S.-Q., Xia, Z., Deng, Q., Yang, P., Long, L., Wang, F., & Chen, J. (2022) · Neurobiology of Stress · doi:10.1016/j.ynstr.2022.100453 · Cited by 10
Keller, B. N., Snyder, A. E., Coker, C. R., Aguilar, E. A., O’Brien, M. K., Lookfong, N. A., Bingaman, S. S., Arnold, A. C., Hajnal, A. S., & Silberman, Y. (2024) · Alcoholism Clinical and Experimental Research · doi:10.1111/acer.15264 · Cited by 12
Emotional Intelligence and Mindfulness
Ninivaggi, F. J. (2019) · Elsevier eBooks · doi:10.1016/b978-0-12-816484-6.00003-8 · Cited by 11
Does cribbing behavior in horses vary with dietary taste or direct gastric stimuli?
Albright, J. D., Sun, X., & Houpt, K. A. (2017) · Applied Animal Behaviour Science · doi:10.1016/j.applanim.2017.01.015 · Cited by 9
GABA, epigallocatechin gallate, tea, and the gut-brain axis
Hinton, T., & Johnston, G. A. R. (2024) · Neurochemistry International · doi:10.1016/j.neuint.2024.105860 · Cited by 8
Metadata
- Authors
- Klarer, M., Arnold, M., Günther, L., Winter, C., Langhans, W., & Meyer, U.
- Affiliations
- ETH Zurich (CH)
- University Hospital Carl Gustav Carus (DE)
- Venue
- The Journal of Neuroscience
- Publisher
- Society for Neuroscience
- Published
- 2014-05-21
- Volume
- 34
- Issue
- 21
- Pages
- 7067-7076
- ISSN
- 0270-6474 (ISSN-L)
- 1529-2401
- PMC
- PMC6608191
- OpenAlex
- W2028119064
- Cited by
- 159
- References
- 56
- Citations by year
- 2026: 6 · 2025: 15 · 2024: 18 · 2023: 11 · 2022: 14 · 2021: 12 · 2020: 17 · 2019: 16 · 2018: 12 · 2017: 12 · 2016: 16 · 2015: 7 · 2014: 3
- FWCI
- 6.60
- Type
- journal article
- Language
- en
- Open access
- hybrid
- doi.org
- Licence
- Locations
- Journal of Neuroscience (publishedVersion, cc-by-nc-sa)
- PubMed Central (publishedVersion)
- PubMed (publishedVersion)
- Repository for Publications and Research Data (ETH Zurich) (publishedVersion, cc-by-nc-sa)
- ETH Zürich Research Collection
- Funders
- European Commission (259679)
- Eidgenössische Technische Hochschule Zürich (ETH-25_13-2, 25_13-2)
- Topics
- Life Sciences › Neuroscience › Neurology › Vagus Nerve Stimulation Research
- Life Sciences › Neuroscience › Cognitive Neuroscience › Memory and Neural Mechanisms
- Health Sciences › Medicine › Gastroenterology › Gastrointestinal motility and disorders
- Keywords
- vagal afferents, gut-brain axis, learned fear, fear extinction, norepinephrine, GABA, limbic system, hypothalamic-pituitary-adrenal axis, emotional behavior, food neophobia
- MeSH terms
- Animals, Anxiety, Conditioning, Classical, Eating, Exploratory Behavior, Extinction, Psychological, Fear, Functional Laterality, Male, Sincalide, Vagus Nerve, Rats, Sprague-Dawley, Neurotransmitter Agents, Maze Learning, Gastrointestinal Tract, Rats
About these checks
Registry, retraction, Cites and statistics results are computed, not judged, with one exception: a printed reference that no index lists is read once by a model before it counts as a citation error. Claims are extracted by a model and kept only when their quote appears verbatim in the text; each cited source is then checked, with a model’s help, for whether it says what the claim relies on. Those verdicts can be wrong — read the claim’s quote and the cited source before relying on one.
Statistics and arithmetic are recomputed, not judged.
Confidence bands are shown only for fields calibrated on our annotated test set. None is calibrated yet, so no band is shown.
What counts as a claim ›How we measure confidence ›How we check this ›
Are you an author, or do you see a problem with this page? Request a review
