Cited by 290

The DOI matches its Crossref record; 4 of the 4 references it cites were found in a registry or an index.

The Translation Repressor 4E-BP2 Is Critical for eIF4F Complex Formation, Synaptic Plasticity, and Memory in the Hippocampus

Banko, Jessica L., Poulin, Francis, Hou, Lingfei, DeMaria, Christine T., Sonenberg, Nahum, Klann, Eric·2005·The Journal of Neuroscience

Abstract

Long-lasting synaptic plasticity and memory requires mRNA translation, yet little is known as to how this process is regulated. To explore the role that the translation repressor 4E-BP2 plays in hippocampal long-term potentiation (LTP) and learning and memory, we examined 4E-BP2 knock-out mice. Interestingly, genetic elimination of 4E-BP2 converted early-phase LTP to late-phase LTP (L-LTP) in the Schaffer collateral pathway, likely as a result of increased eIF4F complex formation and translation initiation. A critical limit for activity-induced translation was revealed in the 4E-BP2 knock-out mice because L-LTP elicited by traditional stimulation paradigms was obstructed. Moreover, the 4E-BP2 knock-out mice also exhibited impaired spatial learning and memory and conditioned fear-associative memory deficits. These results suggest a crucial role for proper regulation of the eIF4F complex by 4E-BP2 during LTP and learning and memory in the mouse hippocampus.

Overview

The claims and statistics of this paper haven’t been checked yet.

Run the check — free, no account needed. It reads the open-access text and checks the sources it cites.

A few free checks a day · papers already verified open instantly · results are public

Integrity signals

Registry

Crossref · 10.1523/jneurosci.2423-05.2005

Cites

4 of 4 references verified0 citation errors · 0 not checkable

Statistics

Figures

Image 1
CC-BY-NC-SA · From the PDF
Image 2
CC-BY-NC-SA · From the PDF
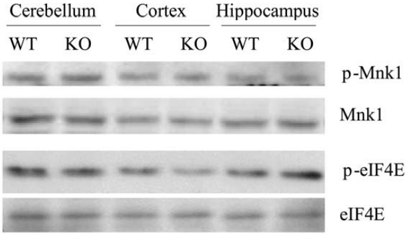
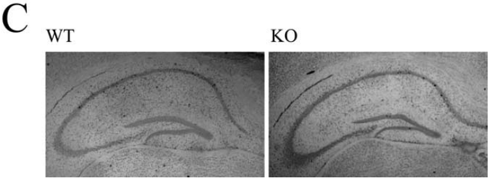
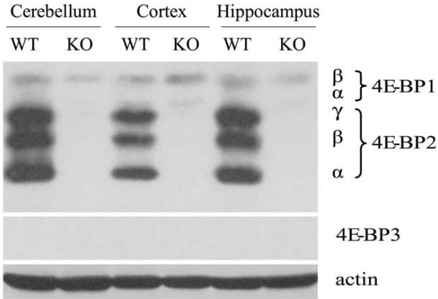
Figure 2 General characterization of 4E-BP2 knock-out mice. A , Representative Western blot analysis of 4E-BP1, 4E-BP2, 4E-BP3, and actin in different brain regions obtained from wild-type or knock-out mice. 𝛂 , 𝛃 , and 𝛄 identify 4E-BP1 and 4E-BP2 phosphorylation isoforms that exhibit different electrophoretic mobilities in SDS-PAGE. B , Representative Western blot analysis of phosphorylated and total protein levels of eIF4E and Mnk1 in different brain regions show no difference. C , Representative cresyl violet staining of hippocampal cell bodies in slices obtained from wild-type (left) and knock-out (right) mice show no difference. WT, Wild type; KO, knock-out.
Figure 2 General characterization of 4E-BP2 knock-out mice. A , Representative Western blot analysis of 4E-BP1, 4E-BP2, 4E-BP3, and actin in different brain regions obtained from wild-type or knock-out mice. 𝛂 , 𝛃 , and 𝛄 identify 4E-BP1 and 4E-BP2 phosphorylation isoforms that exhibit different electrophoretic mobilities in SDS-PAGE. B , Representative Western blot analysis of phosphorylated and total protein levels of eIF4E and Mnk1 in different brain regions show no difference. C , Representative cresyl violet staining of hippocampal cell bodies in slices obtained from wild-type (left) and knock-out (right) mice show no difference. WT, Wild type; KO, knock-out.CC-BY-NC-SA · From the PDF
Image 4
CC-BY-NC-SA · From the PDF
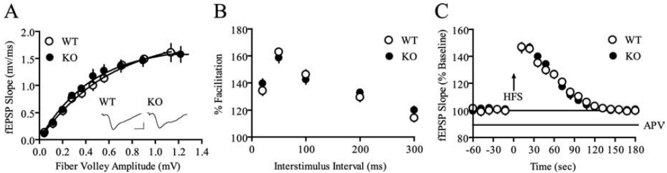
Figure 3 Basal synaptic transmission and short-term plasticity are normal in 4E-BP2 knock-out mice. A , Input- output relationships of wild-type (WT) and knock-out (KO) mice show no difference with nonlinear regression (zero to top) analysis of the fEPSP slopes evoked with increasing stimulation versus their companion fiber volley amplitude ( n = 39 slices; 22 mice per genotype; p > 0.05). Representative fEPSP traces evoked at 40% maximum stimulation are shown. Calibration: 1 mV, 10 ms. B , PPFis unaltered in knock-out mice. The percent of facilitation, calculated from the ratio of the second fEPSP slope to the first fEPSP slope, is shown at interpulse intervals ranging from 20 to 300 ms ( n = 39 slices; 22 mice per genotype; p > 0.05). C , PTP after a single 100 Hz train (1 s) delivered in the presence of APV (50 𝛍 M) was unaltered in knock-out slices ( n = 6 slices; 4 mice per genotype; p > 0.05).
Figure 3 Basal synaptic transmission and short-term plasticity are normal in 4E-BP2 knock-out mice. A , Input- output relationships of wild-type (WT) and knock-out (KO) mice show no difference with nonlinear regression (zero to top) analysis of the fEPSP slopes evoked with increasing stimulation versus their companion fiber volley amplitude ( n = 39 slices; 22 mice per genotype; p > 0.05). Representative fEPSP traces evoked at 40% maximum stimulation are shown. Calibration: 1 mV, 10 ms. B , PPFis unaltered in knock-out mice. The percent of facilitation, calculated from the ratio of the second fEPSP slope to the first fEPSP slope, is shown at interpulse intervals ranging from 20 to 300 ms ( n = 39 slices; 22 mice per genotype; p > 0.05). C , PTP after a single 100 Hz train (1 s) delivered in the presence of APV (50 𝛍 M) was unaltered in knock-out slices ( n = 6 slices; 4 mice per genotype; p > 0.05).CC-BY-NC-SA · From the PDF
Image 6
CC-BY-NC-SA · From the PDF
Image 7
CC-BY-NC-SA · From the PDF
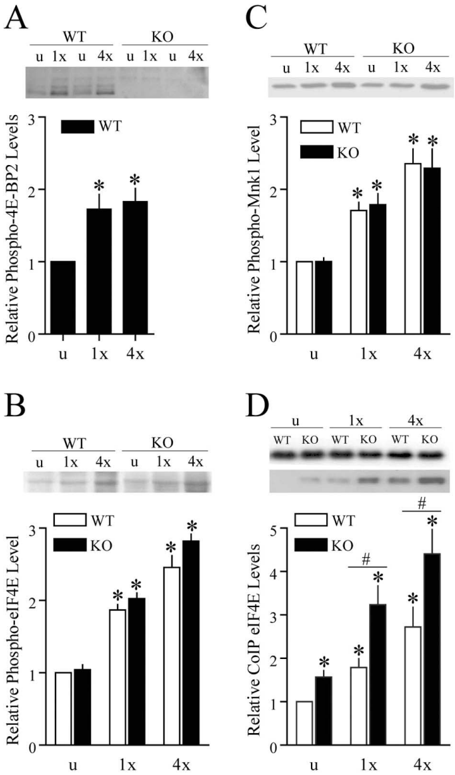
Figure 6 Regulation of translation initiation factors during LTP. A , HFS-induced 4E-BP2 phosphoryation (Thr36/47) in area CA1 homogenates obtained from wild-type and knock-out slices ( n = 4 slices per genotype). * p < 0.05 ( t test) compared with wild type unstimulated. Total protein loading was normalized by Ponceau S membrane staining. B , HFS-induced eIF4E phosphorylation (Ser 209) in area CA1 homogenates obtained from wild-type and knock-out slices ( n = 6 slices per genotype). * p < 0.05 ( t test) compared with wild type unstimulated. Total protein loading was normalized by Ponceau S membrane staining. C , HFS-induced Mnk1 phosphorylation (Thr100/220) in area CA1 homogenates obtained from wild-type and knockoutslices ( n = 6slices per genotype). * p < 0.05( t test) comparedwithwildtypeunstimulated. Total protein loading was normalized by Ponceau S membrane staining. D , HFS-induced eIF4EeIF4G coimmunoprecipitation in area CA1 homogenates obtained from wild-type and knockoutslices ( n = 6slices per genotype). * p < 0.05( t test) comparedwithwildtypeunstimulated; # p < 0.05 ( t test) between samples indicated by the bar. WT, Wild-type; KO, knock-out.
Figure 6 Regulation of translation initiation factors during LTP. A , HFS-induced 4E-BP2 phosphoryation (Thr36/47) in area CA1 homogenates obtained from wild-type and knock-out slices ( n = 4 slices per genotype). * p < 0.05 ( t test) compared with wild type unstimulated. Total protein loading was normalized by Ponceau S membrane staining. B , HFS-induced eIF4E phosphorylation (Ser 209) in area CA1 homogenates obtained from wild-type and knock-out slices ( n = 6 slices per genotype). * p < 0.05 ( t test) compared with wild type unstimulated. Total protein loading was normalized by Ponceau S membrane staining. C , HFS-induced Mnk1 phosphorylation (Thr100/220) in area CA1 homogenates obtained from wild-type and knockoutslices ( n = 6slices per genotype). * p < 0.05( t test) comparedwithwildtypeunstimulated. Total protein loading was normalized by Ponceau S membrane staining. D , HFS-induced eIF4EeIF4G coimmunoprecipitation in area CA1 homogenates obtained from wild-type and knockoutslices ( n = 6slices per genotype). * p < 0.05( t test) comparedwithwildtypeunstimulated; # p < 0.05 ( t test) between samples indicated by the bar. WT, Wild-type; KO, knock-out.CC-BY-NC-SA · From the PDF
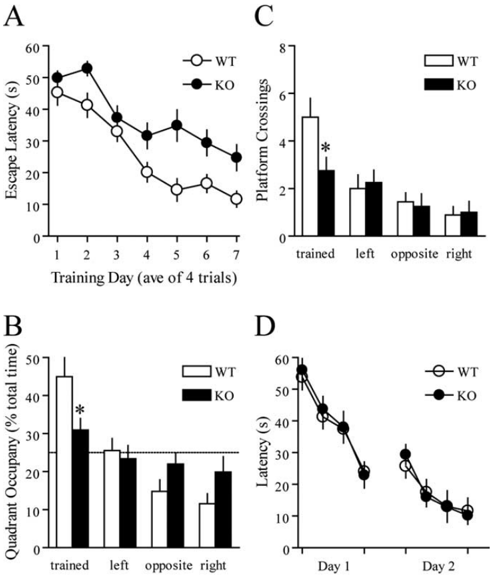
Figure 7 Impaired spatial learning and memory in 4E-BP2 knock-out mice. A , Escape latencies in the hidden platform Morris water maze plotted as a function of training day ( n = 12mice per genotype; p < 0.0001; ANOVA). B , The mean proportion of time spent in each of the quadrants during the probe test represented for both groups. C , The mean number of platform location crossings during the probe trial shown for the training quadrant and the corresponding locations in other quadrants. D , Cued-platform control task ( n = 8 mice per genotype; p > 0.05; ANOVA). WT, Wild-type; KO, knock-out.
Figure 7 Impaired spatial learning and memory in 4E-BP2 knock-out mice. A , Escape latencies in the hidden platform Morris water maze plotted as a function of training day ( n = 12mice per genotype; p < 0.0001; ANOVA). B , The mean proportion of time spent in each of the quadrants during the probe test represented for both groups. C , The mean number of platform location crossings during the probe trial shown for the training quadrant and the corresponding locations in other quadrants. D , Cued-platform control task ( n = 8 mice per genotype; p > 0.05; ANOVA). WT, Wild-type; KO, knock-out.CC-BY-NC-SA · From the PDF
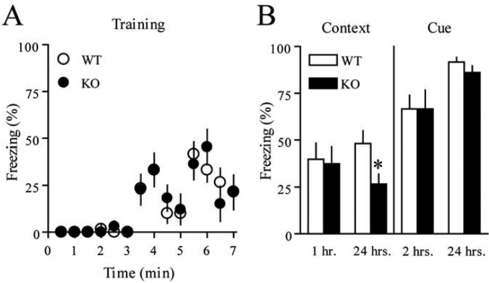
Figure 8 Impaired conditioned fear memory in 4E-BP2 knock-out mice. A , Wild-type ( n = 22) and knock-out ( n = 20) mice responded comparably during training with a paradigm of a tone paired with a footshock between 3- 4 and 5- 6 min. B , Mean freezing behavior is shown from the contextual fear response test performed 1 h (wild-type, n = 10; knock-out, n = 8) or 24 h (wild-type, n = 12; knock-out, n = 10) after training (* p < 0.05; Student's t test). Mean freezing behavior is shown from the cued fear response test performed 2 h (wild-type, n = 10; knock-out, n = 8) or 24 h (wild-type, n = 12; knock-out, n = 10)after training. WT, Wild-type; KO, knock-out.
Figure 8 Impaired conditioned fear memory in 4E-BP2 knock-out mice. A , Wild-type ( n = 22) and knock-out ( n = 20) mice responded comparably during training with a paradigm of a tone paired with a footshock between 3- 4 and 5- 6 min. B , Mean freezing behavior is shown from the contextual fear response test performed 1 h (wild-type, n = 10; knock-out, n = 8) or 24 h (wild-type, n = 12; knock-out, n = 10) after training (* p < 0.05; Student's t test). Mean freezing behavior is shown from the cued fear response test performed 2 h (wild-type, n = 10; knock-out, n = 8) or 24 h (wild-type, n = 12; knock-out, n = 10)after training. WT, Wild-type; KO, knock-out.CC-BY-NC-SA · From the PDF
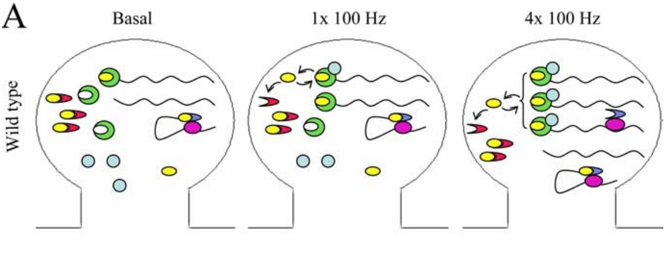
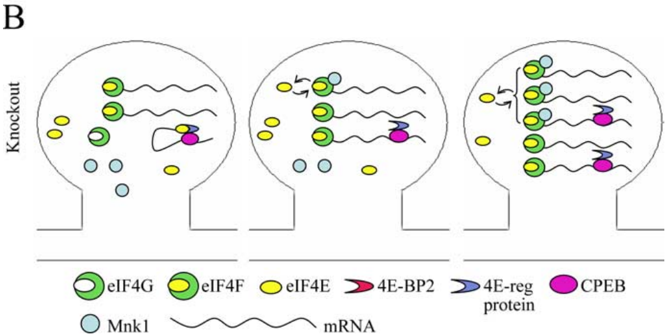
Figure 9 A molecular model for activity-induced translation initiation. A , One 100 Hz train stimulation elicits E-LTP in wildtype mice, a process that does not require protein synthesis but engages translation initiation factors. eIF4E availability for eIF4G binding and eIF4F complex formation increases as a result of 4E-BP2 phosphorylation. eIF4G-bound eIF4E is phosphorylated by Mnk1 and can be reused for initiation or recovered by 4E-BP2. Four 100 Hz trains elicit L-LTP in wild-type mice, a process that requires mRNA production and protein synthesis. L-LTP results in more robust activation of the translation initiation factors, including release of eIF4E from additional 3 ′ cisacting eIF4E-regulatory proteins. B , In 4E-BP2 knock-out mice, the basal levels of the eIF4F complex are elevated, lowering the threshold for elicitation of L-LTP. L-LTP elicited by four 100 Hz trains is obstructed by excessive formation of the eIF4F complex.
Figure 9 A molecular model for activity-induced translation initiation. A , One 100 Hz train stimulation elicits E-LTP in wildtype mice, a process that does not require protein synthesis but engages translation initiation factors. eIF4E availability for eIF4G binding and eIF4F complex formation increases as a result of 4E-BP2 phosphorylation. eIF4G-bound eIF4E is phosphorylated by Mnk1 and can be reused for initiation or recovered by 4E-BP2. Four 100 Hz trains elicit L-LTP in wild-type mice, a process that requires mRNA production and protein synthesis. L-LTP results in more robust activation of the translation initiation factors, including release of eIF4E from additional 3 ′ cisacting eIF4E-regulatory proteins. B , In 4E-BP2 knock-out mice, the basal levels of the eIF4F complex are elevated, lowering the threshold for elicitation of L-LTP. L-LTP elicited by four 100 Hz trains is obstructed by excessive formation of the eIF4F complex.CC-BY-NC-SA · From the PDF
Image 12
CC-BY-NC-SA · From the PDF

Verification

Claims the paper makes

The claims and statistics of this paper haven’t been checked yet.

Run the check — free, no account needed. It reads the open-access text and checks the sources it cites.

A few free checks a day · papers already verified open instantly · results are public

Claims other papers make about this one

Each is checked against this paper’s own text: does it say what the citing paper says it does?

Self-check

Percentages, sums and reported differences re-computed from the paper’s own numbers.

The self-check needs the paper’s full text.

Citations

Cites

Research works printed but not linked: 47

  1. 10.1016/S0092-8674(00)81904-2 · DOI · Paper page
  2. 10.1101/lm.72704 · DOI
  3. 10.1523/JNEUROSCI.0854-04.2004 · DOI
  4. 10.1111/j.1471-4159.2004.02734.x · DOI
  5. 10.1016/S0092-8674(02)00657-8 · DOI
  6. 10.1016/S0896-6273(01)00483-4 · DOI
  7. 1996, EMBO J, 15, 658, 10.1002/j.1460-2075.1996.tb00398.x · DOI
  8. 10.1093/emboj/cdf353 · DOI
  9. 10.1016/S0092-8674(00)81653-0 · DOI · Paper page
  10. 10.1016/S0896-6273(03)00501-4 · DOI
  11. 10.1016/S0092-8674(02)00642-6 · DOI
  12. 10.1037/0735-7044.98.1.79 · DOI
  13. 10.1016/0006-8993(88)90008-X · DOI
  14. 1996, J Physiol (Lond), 490, 703, 10.1113/jphysiol.1996.sp021179 · DOI
  15. 10.1006/viro.1997.8757 · DOI
  16. 10.1101/gad.12.4.502 · DOI
  17. 10.1146/annurev.biochem.68.1.913 · DOI
  18. 1995, EMBO J, 14, 5701, 10.1002/j.1460-2075.1995.tb00257.x · DOI
  19. 10.1101/lm.1.1.74 · DOI
  20. 1968, J Physiol (Lond), 195, 481, 10.1113/jphysiol.1968.sp008469 · DOI
  21. 10.1016/S0092-8674(04)00115-1 · DOI · Paper page
  22. 10.1074/jbc.271.47.30199 · DOI
  23. 1995, Mol Cell Biol, 15, 4990, 10.1128/MCB.15.9.4990 · DOI
  24. 10.1038/ng1197-280 · DOI
  25. 10.1038/nrn942 · DOI
  26. 10.1016/S0092-8674(00)80484-5 · DOI
  27. 10.1016/0165-0270(84)90007-4 · DOI · Paper page
  28. 10.1126/science.8066450 · DOI · Paper page
  29. 10.1016/S0022-2836(02)00328-5 · DOI
  30. 10.1038/371762a0 · DOI
  31. 10.1016/S0896-6273(03)00813-4 · DOI
  32. 10.1074/jbc.273.22.14002 · DOI
  33. 10.1074/jbc.M310761200 · DOI
  34. 1985, Exp Brain Res, 58, 11
  35. 10.1074/jbc.M103607200 · DOI
  36. 10.1016/S0092-8674(03)01021-3 · DOI
  37. 10.1002/neu.10169 · DOI
  38. 1984, J Neurosci, 4, 3080, 10.1523/JNEUROSCI.04-12-03080.1984 · DOI
  39. 10.1016/S1097-2765(00)80230-0 · DOI
  40. 10.1073/pnas.012605299 · DOI · Paper page
  41. 10.1006/geno.1996.0638 · DOI
  42. 10.1038/nm1001-1128 · DOI
  43. 10.1074/jbc.273.16.9373 · DOI
  44. 1999, Mol Cell Biol, 19, 1871, 10.1128/MCB.19.3.1871 · DOI
  45. 10.1084/jem.186.5.683 · DOI
  46. 10.1261/rna.2133403 · DOI
  47. 10.1021/bi030266t · DOI

Cited by

Sorted by citations

See all 290

Metadata

Authors
Banko, J. L., Poulin, F., Hou, L., DeMaria, C. T., Sonenberg, N., & Klann, E.
Venue
The Journal of Neuroscience
Published
2005-10-19
Volume
25
Issue
42
Pages
9581-9590
ISSN
  • 0270-6474
  • 1529-2401
Cited by
290
References
4
Language
en

About these checks

Registry, retraction, Cites and statistics results are computed, not judged, with one exception: a printed reference that no index lists is read once by a model before it counts as a citation error. Claims are extracted by a model and kept only when their quote appears verbatim in the text; each cited source is then checked, with a model’s help, for whether it says what the claim relies on. Those verdicts can be wrong — read the claim’s quote and the cited source before relying on one.

Statistics and arithmetic are recomputed, not judged.

Confidence bands are shown only for fields calibrated on our annotated test set. None is calibrated yet, so no band is shown.

What counts as a claim ›How we measure confidence ›How we check this ›

Are you an author, or do you see a problem with this page? Request a review