Cited by 163

The DOI matches its Crossref record; 5 of the 5 references it cites were found in a registry or an index.

Regulation of Postnatal Forebrain Amoeboid Microglial Cell Proliferation and Development by the Transcription Factor Runx1

Zusso, Morena, Methot, Laurent, Lo, Rita, Greenhalgh, Andrew D., David, Samuel, Stifani, Stefano·2012·The Journal of Neuroscience

Abstract

Microglia are the immune cells of the nervous system, where they act as resident macrophages during inflammatory events underlying many neuropathological conditions. Microglia derive from primitive myeloid precursors that colonize the nervous system during embryonic development. In the postnatal brain, microglia are initially mitotic, rounded in shape (amoeboid), and phagocytically active. As brain development proceeds, they gradually undergo a transition to a surveillant nonphagocytic state characterized by a highly branched (ramified) morphology. This ramification process is almost recapitulated in reverse during the process of microglia activation in the adult brain, when surveillant microglia undergo a ramified-to-amoeboid morphological transformation and become phagocytic in response to injury or disease. Little is known about the mechanisms controlling amoeboid microglial cell proliferation, activation, and ramification during brain development, despite the critical role of these processes in the establishment of the adult microglia pool and their relevance to microglia activation in the adult brain. Here we show that the mouse transcription factor Runx1, a key regulator of myeloid cell proliferation and differentiation, is expressed in forebrain amoeboid microglia during the first two postnatal weeks. Runx1 expression is then downregulated in ramified microglia. Runx1 inhibits mouse amoeboid microglia proliferation and promotes progression to the ramified state. We show further that Runx1 expression is upregulated in microglia following nerve injury in the adult mouse nervous system. These findings provide insight into the regulation of postnatal microglia activation and maturation to the ramified state and have implications for microglia biology in the developing and injured brain.

Overview

The claims and statistics of this paper haven’t been checked yet.

Run the check — free, no account needed. It reads the open-access text and checks the sources it cites.

A few free checks a day · papers already verified open instantly · results are public

Integrity signals

Registry

Crossref · 10.1523/jneurosci.6182-11.2012

Cites

5 of 5 references verified0 citation errors · 0 not checkable

Statistics

Figures

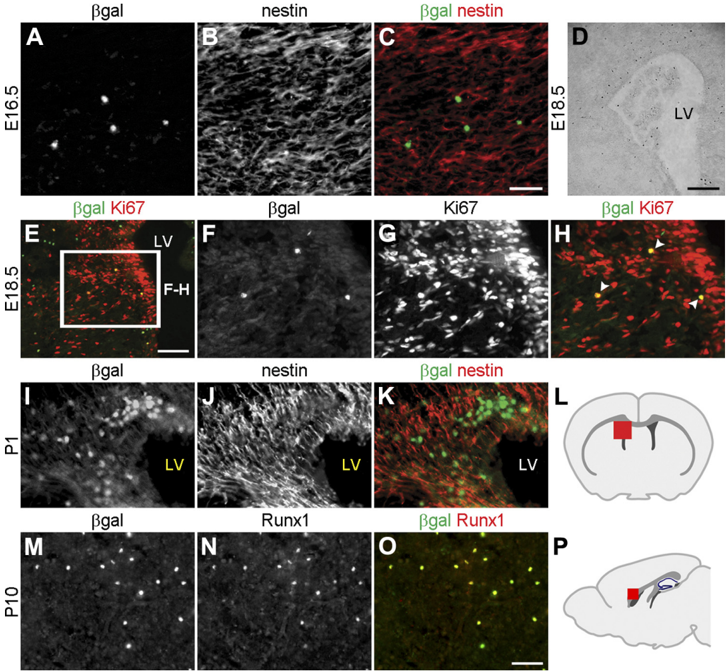
Figure1 Runx1 is expressed in a restricted group of cells in the developing forebrain. A-H , Coronal sections through the telencephalon of either E16.5 ( A-C ) or E18.5 ( D-H ) Runx1 LacZ/ + embryos were subjected to double-labeling immunofluorescence analysis of 𝛃 -gal and nestin expression ( A-C ), determination of 𝛃 -gal activity using X-gal staining ( D ), or double-labeling immunofluorescence analysis of 𝛃 -gal and Ki67 expression ( E-H ). E , Box indicates area shown at higher magnification in F-H . H , Arrowheads indicate cells coexpressing 𝛃 -gal and Ki67. I-K , Coronal sections through the telencephalon of P1 Runx1 LacZ/ + pups were subjected to double-labeling immunofluorescence analysis of 𝛃 -gal and nestin expression. 𝛃 -gal + cells do not express nestin but are located adjacent to nestin + cells. L , Schematic of the forebrain in the coronal plane indicating the location (red square) of the area examined in panels E-K . M-O , Sagittal sections of P10 Runx1 LacZ/ + brains were subjected to double-labeling analysis of 𝛃 -gal and Runx1 expression. All 𝛃 -gal + cells express the Runx1 protein, indicating that 𝛃 -gal expression faithfully recapitulates Runx1expressed in the postnatal forebrain. P , Schematic of the forebrain in the sagittal plane demonstrating the location (red square) of the area examined in M-O . LV, lateral ventricle. Scale bars: (in C , O ) A-C , F-K , M-O , 50 𝛍 m; E , 100 𝛍 m; D , 250 𝛍 m.
Figure1 Runx1 is expressed in a restricted group of cells in the developing forebrain. A-H , Coronal sections through the telencephalon of either E16.5 ( A-C ) or E18.5 ( D-H ) Runx1 LacZ/ + embryos were subjected to double-labeling immunofluorescence analysis of 𝛃 -gal and nestin expression ( A-C ), determination of 𝛃 -gal activity using X-gal staining ( D ), or double-labeling immunofluorescence analysis of 𝛃 -gal and Ki67 expression ( E-H ). E , Box indicates area shown at higher magnification in F-H . H , Arrowheads indicate cells coexpressing 𝛃 -gal and Ki67. I-K , Coronal sections through the telencephalon of P1 Runx1 LacZ/ + pups were subjected to double-labeling immunofluorescence analysis of 𝛃 -gal and nestin expression. 𝛃 -gal + cells do not express nestin but are located adjacent to nestin + cells. L , Schematic of the forebrain in the coronal plane indicating the location (red square) of the area examined in panels E-K . M-O , Sagittal sections of P10 Runx1 LacZ/ + brains were subjected to double-labeling analysis of 𝛃 -gal and Runx1 expression. All 𝛃 -gal + cells express the Runx1 protein, indicating that 𝛃 -gal expression faithfully recapitulates Runx1expressed in the postnatal forebrain. P , Schematic of the forebrain in the sagittal plane demonstrating the location (red square) of the area examined in M-O . LV, lateral ventricle. Scale bars: (in C , O ) A-C , F-K , M-O , 50 𝛍 m; E , 100 𝛍 m; D , 250 𝛍 m.CC-BY-NC-SA · From the PDF
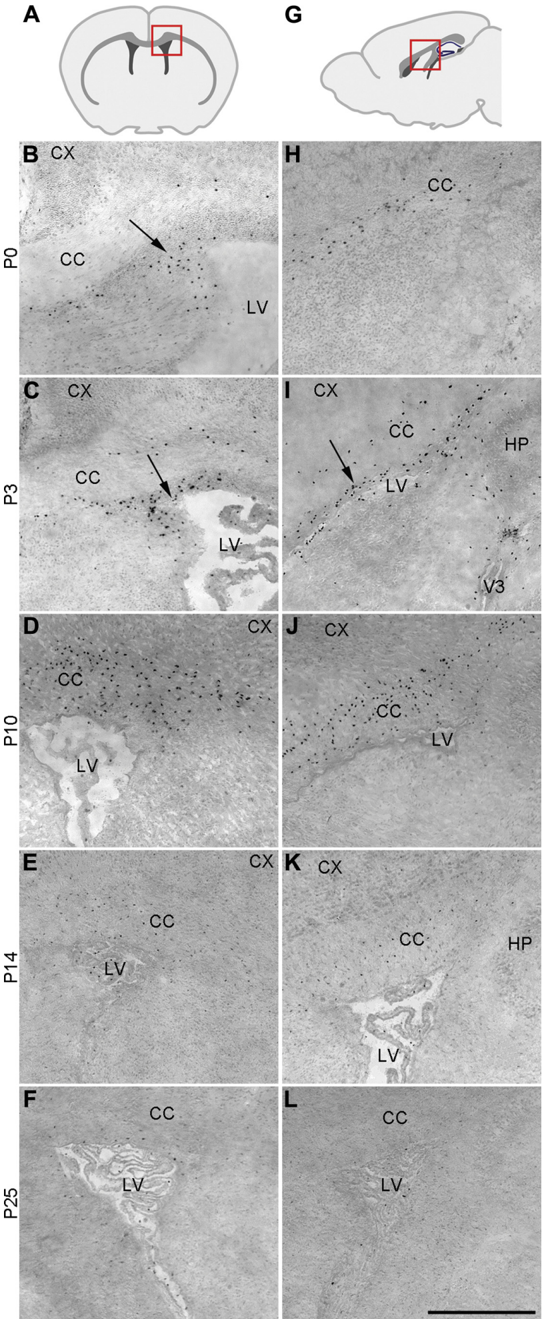
Figure2 Runx1 is expressed in a restricted group of cells in the postnatal forebrain. Coronal ( B-F , left column) or sagittal ( H-L , right column) sections through the telencephalon of Runx1 LacZ/ + mice at the indicated postnatal (P) stages were subjected
Figure2 Runx1 is expressed in a restricted group of cells in the postnatal forebrain. Coronal ( B-F , left column) or sagittal ( H-L , right column) sections through the telencephalon of Runx1 LacZ/ + mice at the indicated postnatal (P) stages were subjectedCC-BY-NC-SA · From the PDF
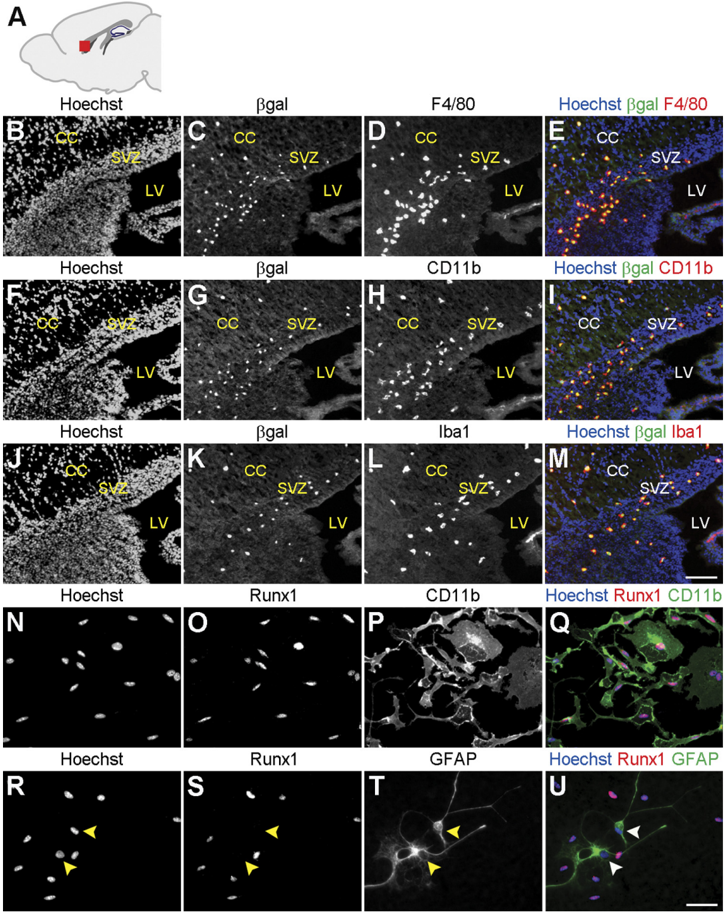
Figure 3 Runx1 is expressed in microglia in the postnatal forebrain. A , Schematic of the forebrain in the sagittal plane demonstrating the location (red square) of the anatomical area examined in B-M . B-M , Sagittal sections of P3 Runx1 LacZ/ + brains were subjected to double-labeling analysis of 𝛃 -gal and F4/80, CD11b, or Iba1 immunoreactivity, as indicated. Hoechst counterstaining is shown in the images in the left column and in the merged images in the right column. All 𝛃 -gal + cells in the ventricular zone and corpus callosum are positive for the expression of the microglial cell markers, F4/80, CD11b, and Iba1. CC, corpus callosum; LV, lateral ventricle; SVZ, subventricular zone. Scale bar, 100 𝛍 m. N-U , Primary microglial cell cultures from P3 mouse brain were subjected to double-labeling analysis of the expression of Runx1 and either the microglia marker CD11b ( N-Q ) or the astrocyte marker GFAP ( R-U ). Hoechst counterstaining is shown in N and Q and R and U . All Runx1 + cells express CD11b and do not express GFAP ( R -U , arrowheads). Scale bar, 50 𝛍 m.
Figure 3 Runx1 is expressed in microglia in the postnatal forebrain. A , Schematic of the forebrain in the sagittal plane demonstrating the location (red square) of the anatomical area examined in B-M . B-M , Sagittal sections of P3 Runx1 LacZ/ + brains were subjected to double-labeling analysis of 𝛃 -gal and F4/80, CD11b, or Iba1 immunoreactivity, as indicated. Hoechst counterstaining is shown in the images in the left column and in the merged images in the right column. All 𝛃 -gal + cells in the ventricular zone and corpus callosum are positive for the expression of the microglial cell markers, F4/80, CD11b, and Iba1. CC, corpus callosum; LV, lateral ventricle; SVZ, subventricular zone. Scale bar, 100 𝛍 m. N-U , Primary microglial cell cultures from P3 mouse brain were subjected to double-labeling analysis of the expression of Runx1 and either the microglia marker CD11b ( N-Q ) or the astrocyte marker GFAP ( R-U ). Hoechst counterstaining is shown in N and Q and R and U . All Runx1 + cells express CD11b and do not express GFAP ( R -U , arrowheads). Scale bar, 50 𝛍 m.CC-BY-NC-SA · From the PDF
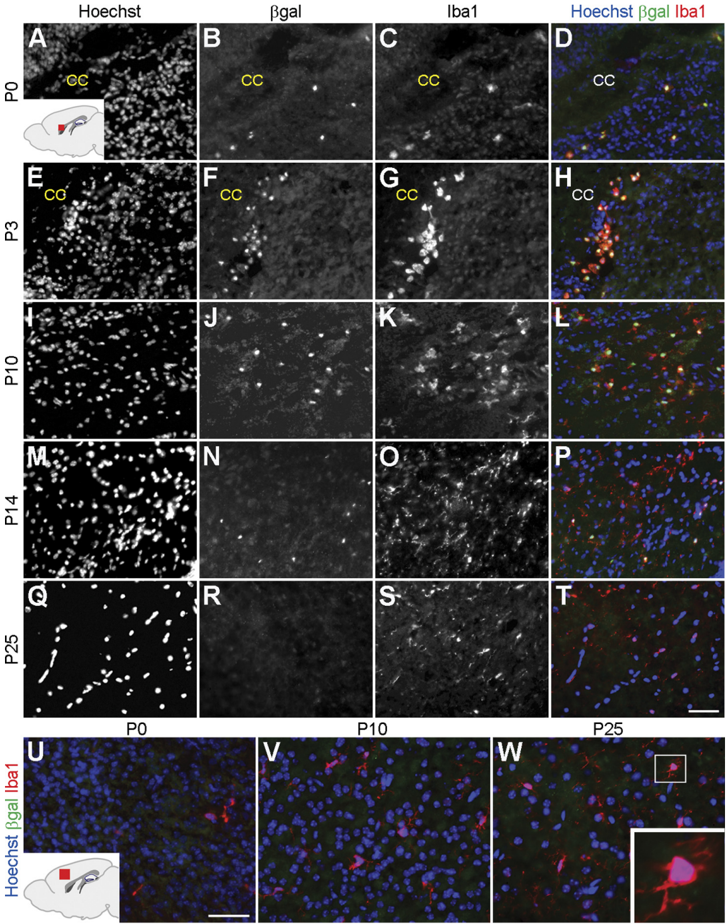
Figure 4 Runx1 is expressed in amoeboid microglia. Sagittal sections of the brain of Runx1 LacZ/ + mice at the indicated postnatal stages were subjected to double-labeling analysis of 𝛃 -gal and Iba1 expression. A-T , Analysis of the forebrain periventricular area. Inset in A shows a schematic of the forebrain in the sagittal plane demonstrating the location (red) of the area examined in A-T . Hoechst counterstaining is shown in the images in the left column and in the merged images in the right column. All Iba1 + cells express 𝛃 -gal and exhibit a rounded morphology the first few days after birth ( A-H ). A gradual increase in the number of Iba1 + cells displaying a ramified morphology is observed during the first two postnatal weeks, just as the number of 𝛃 -gal + cells decreases ( I-P ). 𝛃 -gal expression becomes undetectable by P25, when Iba1 expression is still observed ( M-T ). U-W , Analysis of the cerebral cortex parenchyma. Inset in U showsaschematicoftheforebrain in the sagittal plane demonstrating the location (red) of the area examined in U-W . No 𝛃 -gal expression is detected at any stage in Iba1 + cells located within the cerebral cortex. W , Inset shows higher magnification view of an Iba1 + cell with a ramified morphology. CC, corpus callosum. Scale bar, 50 𝛍 m.
Figure 4 Runx1 is expressed in amoeboid microglia. Sagittal sections of the brain of Runx1 LacZ/ + mice at the indicated postnatal stages were subjected to double-labeling analysis of 𝛃 -gal and Iba1 expression. A-T , Analysis of the forebrain periventricular area. Inset in A shows a schematic of the forebrain in the sagittal plane demonstrating the location (red) of the area examined in A-T . Hoechst counterstaining is shown in the images in the left column and in the merged images in the right column. All Iba1 + cells express 𝛃 -gal and exhibit a rounded morphology the first few days after birth ( A-H ). A gradual increase in the number of Iba1 + cells displaying a ramified morphology is observed during the first two postnatal weeks, just as the number of 𝛃 -gal + cells decreases ( I-P ). 𝛃 -gal expression becomes undetectable by P25, when Iba1 expression is still observed ( M-T ). U-W , Analysis of the cerebral cortex parenchyma. Inset in U showsaschematicoftheforebrain in the sagittal plane demonstrating the location (red) of the area examined in U-W . No 𝛃 -gal expression is detected at any stage in Iba1 + cells located within the cerebral cortex. W , Inset shows higher magnification view of an Iba1 + cell with a ramified morphology. CC, corpus callosum. Scale bar, 50 𝛍 m.CC-BY-NC-SA · From the PDF
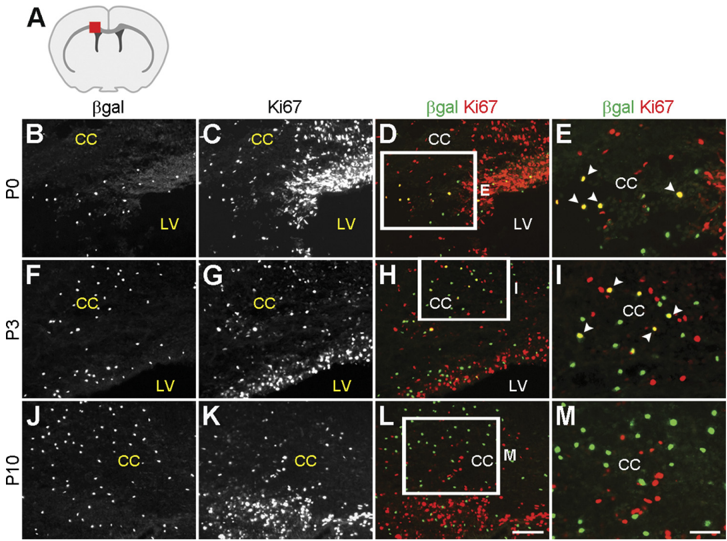
Figure 5 Correlation between Runx1 expression and postnatal microglia proliferation. A , Schematic of the forebrain in the coronal plane demonstrating the location (red square) of the area examined in B-M . B-M , Coronal sections of Runx1 LacZ/ + brains collected at the indicated postnatal stages were subjected to double-labeling analysis of 𝛃 -gal and Ki67 expression. Boxes in D , H , and L indicate areas shown at higher magnification in E , I , and M . Arrowheads indicate cells coexpressing 𝛃 -gal and Ki67. Numerous 𝛃 -gal + cells express Ki67 at P0, but this correlation is lost in older animals. CC, corpus callosum; LV, lateral ventricle. Scale bars: (in L ) B-D , F-H , J-L , 100 𝛍 m; (in M ) E , I , M , 50 𝛍 m.
Figure 5 Correlation between Runx1 expression and postnatal microglia proliferation. A , Schematic of the forebrain in the coronal plane demonstrating the location (red square) of the area examined in B-M . B-M , Coronal sections of Runx1 LacZ/ + brains collected at the indicated postnatal stages were subjected to double-labeling analysis of 𝛃 -gal and Ki67 expression. Boxes in D , H , and L indicate areas shown at higher magnification in E , I , and M . Arrowheads indicate cells coexpressing 𝛃 -gal and Ki67. Numerous 𝛃 -gal + cells express Ki67 at P0, but this correlation is lost in older animals. CC, corpus callosum; LV, lateral ventricle. Scale bars: (in L ) B-D , F-H , J-L , 100 𝛍 m; (in M ) E , I , M , 50 𝛍 m.CC-BY-NC-SA · From the PDF
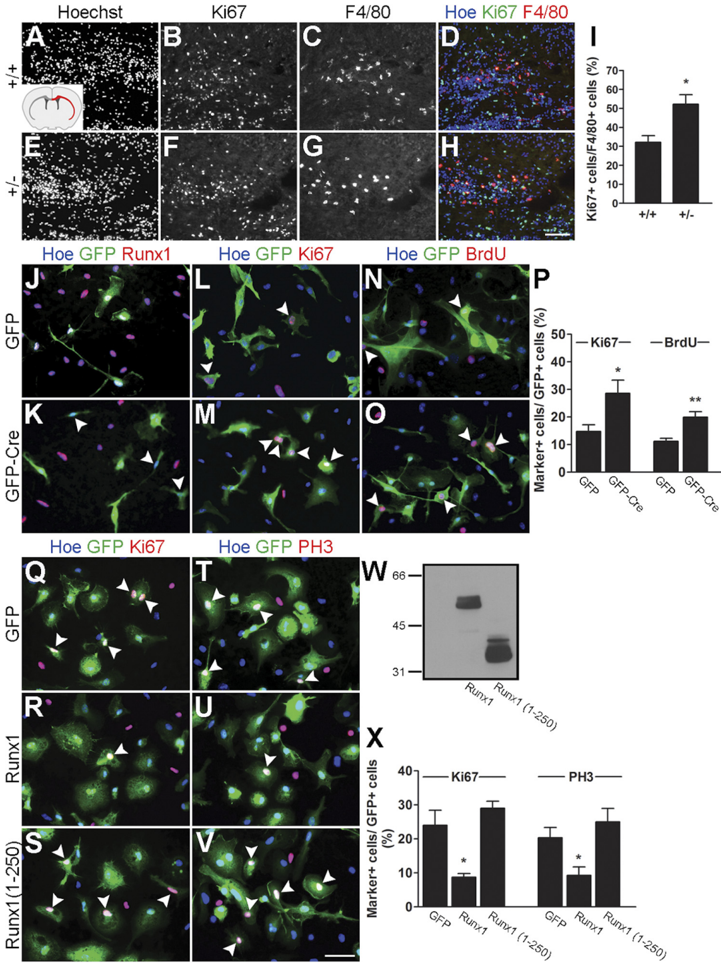
Figure 6 Runx1 promotes microglial cell cycle exit. A-I , Double-labeling immunofluorescence analysis of Ki67 and F4/80 expression in coronal sections of P3 Runx1 + / + and Runx1 LacZ/ + brains. Inset in A shows a schematic of the forebrain in the coronal plane demonstrating the location (red) of the corpus callosum and external capsule, where cell counts were performed. I , Quantification of the percentage of microglial cells (F4/80 + ) expressing Ki67 in the corpus callosum and external capsule of P3 wild-type (32.13 ± 3.49%) versus Runx1 Lacz + (52.18 ± 5.08%) pups. Data are presented as mean ± SEMof 15 sections from three different pups for each genotype ( n = 3). * p < 0.05, t test. Increased numbers of Ki67 + microglia are observed in Runx1 LacZ/ + pups compared with control littermates. J-P , Primary cultures of mouse forebrain microglia were obtained from P3 Runx1 Flox/Flox mice and transduced with lentivirus expressing GFP alone or together with the Cre recombinase, as indicated. J , K , Transduced cells were subjected to double-labeling analysis of GFP and endogenous Runx1 expression. All GFP + cells express Runx1 in the absence of Cre ( J ); in contrast, Runx1 expression is not detectable in transduced cells in the presence of Cre ( K , arrowheads). L-P , Transduced cells were subjected to double-labeling analysis of GFP and Ki67 ( L , M ) or BrdU incorporation followed by double-labeling analysis of GFP and BrdU immunoreactivity ( N , O ) (arrowheads, double-labeled cells). P , Quantification of the percentage of Ki67 + and BrdU + microglia following transduction with lentivirus expressing GFP alone (14.76 ± 2.49% and 11.23 ± 1.05%, respectively) or in combination with Cre recombinase (28.60 ± 4.79% and 19.97 ± 1.96%, respectively). Data are presented as mean ± SEM from five separate experiments ( n = 5). * p < 0.05 and ** p < 0.005, t test. Increased numbers of Ki67 + and BrdU + microglia are observed following expression of Cre, compared with GFP alone. Q-X , Primary cultures of mouse forebrain microglia were obtained from wild-type P3 CD1 mice and transduced with adenovirus expressing GFP alone or together with FLAG epitope-tagged forms of either full-length Runx1 or a truncated form of Runx1 containing only the first 250 aa [Runx1(1-250)], as indicated. Transduced cells were subjected to double-labeling analysis of GFP and Ki67 ( Q-S ) or GFP and PH3 ( T-V ) expression (arrowheads, examples of double-labeled cells). W , Western blotting analysis of the expression of Runx1 and Runx1(1-250) in transduced microglia using anti-FLAG antibody. X , Quantification of the percentage of Ki67 + and PH3 + microglia following transduction with adenovirus expressing GFP alone (24.05 ± 4.38%and20.35 ± 3.04%, respectively) or in combination with either Runx1 (8.75 ± 1.05%and9.28 ± 2.49%, respectively) or Runx1(1-250) (29.00 ± 2.12% and 25.06 ± 3.90%, respectively). Data are presented as mean ± SEM from four separated infection experiments ( n = 4). * p < 0.05, t test. Decreased numbers of Ki67 + and PH3 + microglia are observed following expression of Runx1 ( R , U ), but not Runx1(1-250) ( S , V ), compared with GFP alone ( Q , T ). Scale bars: (in H ) A-H , 100 𝛍 m; (in V ) J-O and Q-V , 50 𝛍 m.
Figure 6 Runx1 promotes microglial cell cycle exit. A-I , Double-labeling immunofluorescence analysis of Ki67 and F4/80 expression in coronal sections of P3 Runx1 + / + and Runx1 LacZ/ + brains. Inset in A shows a schematic of the forebrain in the coronal plane demonstrating the location (red) of the corpus callosum and external capsule, where cell counts were performed. I , Quantification of the percentage of microglial cells (F4/80 + ) expressing Ki67 in the corpus callosum and external capsule of P3 wild-type (32.13 ± 3.49%) versus Runx1 Lacz + (52.18 ± 5.08%) pups. Data are presented as mean ± SEMof 15 sections from three different pups for each genotype ( n = 3). * p < 0.05, t test. Increased numbers of Ki67 + microglia are observed in Runx1 LacZ/ + pups compared with control littermates. J-P , Primary cultures of mouse forebrain microglia were obtained from P3 Runx1 Flox/Flox mice and transduced with lentivirus expressing GFP alone or together with the Cre recombinase, as indicated. J , K , Transduced cells were subjected to double-labeling analysis of GFP and endogenous Runx1 expression. All GFP + cells express Runx1 in the absence of Cre ( J ); in contrast, Runx1 expression is not detectable in transduced cells in the presence of Cre ( K , arrowheads). L-P , Transduced cells were subjected to double-labeling analysis of GFP and Ki67 ( L , M ) or BrdU incorporation followed by double-labeling analysis of GFP and BrdU immunoreactivity ( N , O ) (arrowheads, double-labeled cells). P , Quantification of the percentage of Ki67 + and BrdU + microglia following transduction with lentivirus expressing GFP alone (14.76 ± 2.49% and 11.23 ± 1.05%, respectively) or in combination with Cre recombinase (28.60 ± 4.79% and 19.97 ± 1.96%, respectively). Data are presented as mean ± SEM from five separate experiments ( n = 5). * p < 0.05 and ** p < 0.005, t test. Increased numbers of Ki67 + and BrdU + microglia are observed following expression of Cre, compared with GFP alone. Q-X , Primary cultures of mouse forebrain microglia were obtained from wild-type P3 CD1 mice and transduced with adenovirus expressing GFP alone or together with FLAG epitope-tagged forms of either full-length Runx1 or a truncated form of Runx1 containing only the first 250 aa [Runx1(1-250)], as indicated. Transduced cells were subjected to double-labeling analysis of GFP and Ki67 ( Q-S ) or GFP and PH3 ( T-V ) expression (arrowheads, examples of double-labeled cells). W , Western blotting analysis of the expression of Runx1 and Runx1(1-250) in transduced microglia using anti-FLAG antibody. X , Quantification of the percentage of Ki67 + and PH3 + microglia following transduction with adenovirus expressing GFP alone (24.05 ± 4.38%and20.35 ± 3.04%, respectively) or in combination with either Runx1 (8.75 ± 1.05%and9.28 ± 2.49%, respectively) or Runx1(1-250) (29.00 ± 2.12% and 25.06 ± 3.90%, respectively). Data are presented as mean ± SEM from four separated infection experiments ( n = 4). * p < 0.05, t test. Decreased numbers of Ki67 + and PH3 + microglia are observed following expression of Runx1 ( R , U ), but not Runx1(1-250) ( S , V ), compared with GFP alone ( Q , T ). Scale bars: (in H ) A-H , 100 𝛍 m; (in V ) J-O and Q-V , 50 𝛍 m.CC-BY-NC-SA · From the PDF
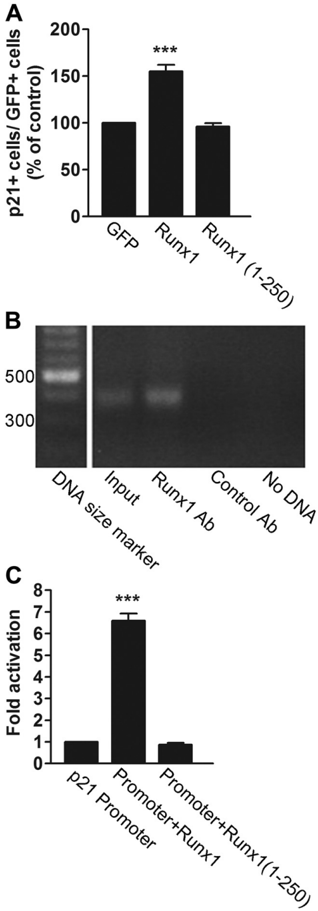
Figure 7 Runx1 promotes p21 Cip1 expression. A , Primary cultures of forebrain microglia were obtained from wild-type P3 CD1 mice and transduced with adenovirus expressing GFP alone or together with FLAG epitope-tagged forms of either full-length Runx1 or Runx1(1-250), followed by double-labelinganalysisofGFPandp21 Cip1 expressionandquantificationofthepercentageoftransduced cells expressing p21 Cip1 . Increased numbers of p21 Cip1 -expressing microglia are observed followingexpression of Runx1 (155.09 ± 7.11%),butnotRunx1(1-250)(96.20 ± 2.94%),compared with GFP alone (designated as 100%). Results are presented as mean ± SEM from five separated infection experiments ( n = 5). *** p < 0.001, t test. B , Chromatin immunoprecipitation. ProteinDNA complexes from primary microglial cell cultures were subjected to immunoprecipitation with rabbit anti-Runx1 antibody or control rabbit antibody as indicated, followed by PCR with primers specific for the proximal region of the p21 Cip1 promoter. Control PCRs were performed using input genomic DNA (input) or oligonucleotide primers alone (No DNA). A specific ChIP product is observed with the anti-Runx1 antibody. C , Transcription assays. HEK293 cells were transfected with a reporter plasmid encoding luciferase under the control of the p21 Cip1 promoter in the absence (luciferase activity designated as one fold) or presence of plasmids encoding full-length Runx1 or Runx1(1-250). Runx1 (luciferase activity 6.60 ± 0.32) but not Runx1(1-250) (luciferase activity 0.87 ± 0.09) activates transcription from the p21 Cip1 promoter ( n = 4; *** p < 0.001, t test).
Figure 7 Runx1 promotes p21 Cip1 expression. A , Primary cultures of forebrain microglia were obtained from wild-type P3 CD1 mice and transduced with adenovirus expressing GFP alone or together with FLAG epitope-tagged forms of either full-length Runx1 or Runx1(1-250), followed by double-labelinganalysisofGFPandp21 Cip1 expressionandquantificationofthepercentageoftransduced cells expressing p21 Cip1 . Increased numbers of p21 Cip1 -expressing microglia are observed followingexpression of Runx1 (155.09 ± 7.11%),butnotRunx1(1-250)(96.20 ± 2.94%),compared with GFP alone (designated as 100%). Results are presented as mean ± SEM from five separated infection experiments ( n = 5). *** p < 0.001, t test. B , Chromatin immunoprecipitation. ProteinDNA complexes from primary microglial cell cultures were subjected to immunoprecipitation with rabbit anti-Runx1 antibody or control rabbit antibody as indicated, followed by PCR with primers specific for the proximal region of the p21 Cip1 promoter. Control PCRs were performed using input genomic DNA (input) or oligonucleotide primers alone (No DNA). A specific ChIP product is observed with the anti-Runx1 antibody. C , Transcription assays. HEK293 cells were transfected with a reporter plasmid encoding luciferase under the control of the p21 Cip1 promoter in the absence (luciferase activity designated as one fold) or presence of plasmids encoding full-length Runx1 or Runx1(1-250). Runx1 (luciferase activity 6.60 ± 0.32) but not Runx1(1-250) (luciferase activity 0.87 ± 0.09) activates transcription from the p21 Cip1 promoter ( n = 4; *** p < 0.001, t test).CC-BY-NC-SA · From the PDF
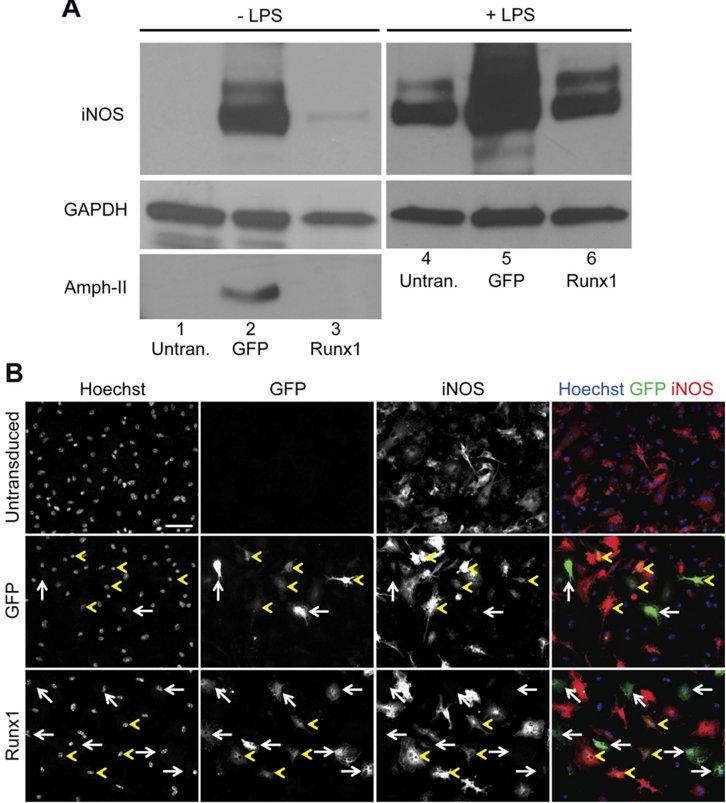
Figure 8 Effect of exogenous Runx1 expression on microglia activation. A , Western blot analysis of iNOS, amphiphysin II, and GAPDH expression in primary cultures of P3 mouse forebrain microglia, as indicated. Cells were not transduced (untran.) or transduced with adenovirus expressing GFP alone (GFP) or together with Runx1 (Runx1), followed by incubation in the absence or presence of LPS, as indicated. Cell lysates were collected and subjected to sequential Western blot analysis with anti-iNOS, anti-amphiphysin II (Amph-II), and anti-GAPDH antibodies. B , Double-label immunofluorescence analysis of GFP and iNOS expression in primary microglial cells that were either not transduced or transduced with adenovirus expressing GFP alone or together with Runx1, as indicated, followed by treatment with LPS. Where present, white arrows point to examples of cells expressing GFP but little or no iNOS, whereas yellow arrowheads point to examples of cells coexpressing GFP and iNOS. Notice how most cells transduced with GFP alone express iNOS, while most cells transduced with GFP + Runx1 express little or no iNOS. Scale bar, 50 𝛍 m.
Figure 8 Effect of exogenous Runx1 expression on microglia activation. A , Western blot analysis of iNOS, amphiphysin II, and GAPDH expression in primary cultures of P3 mouse forebrain microglia, as indicated. Cells were not transduced (untran.) or transduced with adenovirus expressing GFP alone (GFP) or together with Runx1 (Runx1), followed by incubation in the absence or presence of LPS, as indicated. Cell lysates were collected and subjected to sequential Western blot analysis with anti-iNOS, anti-amphiphysin II (Amph-II), and anti-GAPDH antibodies. B , Double-label immunofluorescence analysis of GFP and iNOS expression in primary microglial cells that were either not transduced or transduced with adenovirus expressing GFP alone or together with Runx1, as indicated, followed by treatment with LPS. Where present, white arrows point to examples of cells expressing GFP but little or no iNOS, whereas yellow arrowheads point to examples of cells coexpressing GFP and iNOS. Notice how most cells transduced with GFP alone express iNOS, while most cells transduced with GFP + Runx1 express little or no iNOS. Scale bar, 50 𝛍 m.CC-BY-NC-SA · From the PDF
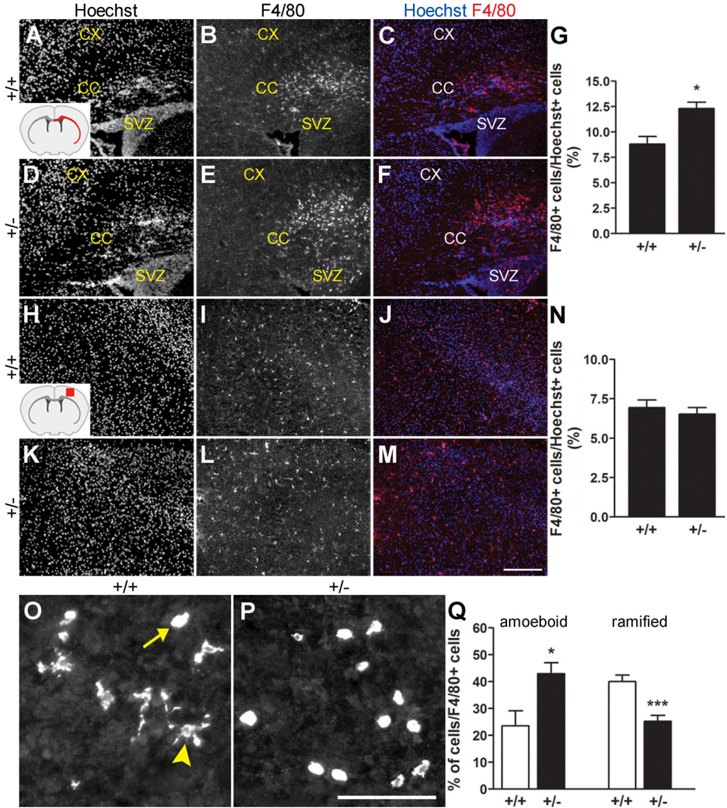
Figure 9 Decreased Runx1 activity impairs the amoeboid-to-ramified microglial cell transition. A-N , Analysis of F4/80 immunoreactivity in either the entire extent of the corpus callosum and external capsule ( A-F ) or a defined area of the cerebral cortex ( H-M ) of P10 Runx1 + / + or Runx1 LacZ/ + mice. Red areas in the schematic of the forebrain in the coronal plane shown in the insets in A and H indicate regions subjected to cell counting analysis in either case. CC, corpus callosum; CX, cortex; SVZ, subventricular zone. G , Quantification of the number of F4/80 + cells (percentage of Hoechst + nuclei) located in the corpus callosum and external capsule of either Runx1 + / + (8.80 ± 0.77%) or Runx1 Lacz + (12.32 ± 0.62%) littermates. Data are presented as mean ± SEMof 15 sections from three different pups for each genotype ( n = 3; * p < 0.05, t test). N , Quantification of the number of F4/80 + cells (percentage of Hoechst + nuclei) located in the cerebral cortex of either Runx1 + / + (6.94 ± 0.49%) or Runx1 Lacz + (6.53 ± 0.41%) littermates. Data are presented as mean ± SEM of 15 sections from three different pups for each genotype ( n = 3). Increased numbersofmicrogliaaredetectedinthesubcorticalwhitematter,butnotcerebralcortex,of Runx1 LacZ/ + pupscomparedwithwild-typelittermates. O-Q , Analysis of F4/80 immunoreactivity in the telencephalon of P3 Runx1 + / + or Runx1 LacZ/ + mice. Arrow points to an example of cell with amoeboid morphology, while arrowhead points to an example of cell with ramified morphology. Q , Quantification of the number of amoeboid and ramified microglial cells located in the corpus callosum of either Runx1 + / + (23.50 ± 5.20% and 40.00 ± 1.44%, respectively) or Runx1 Lacz/ + (42.92 ± 4.62%and25.20 ± 0.92%,respectively) littermates. Data are presented as mean ± SEMof15sectionsfromthreedifferentpupsforeachgenotype( n = 3; * p < 0.05 and *** p < 0.001, t test). Runx1 LacZ/ + pups display increased numbers of amoeboid and decreased numbers of ramified microglia compared with control littermates. Scale bars: 250 𝛍 m( A-F and H-M , 100 𝛍 m( O , P ).
Figure 9 Decreased Runx1 activity impairs the amoeboid-to-ramified microglial cell transition. A-N , Analysis of F4/80 immunoreactivity in either the entire extent of the corpus callosum and external capsule ( A-F ) or a defined area of the cerebral cortex ( H-M ) of P10 Runx1 + / + or Runx1 LacZ/ + mice. Red areas in the schematic of the forebrain in the coronal plane shown in the insets in A and H indicate regions subjected to cell counting analysis in either case. CC, corpus callosum; CX, cortex; SVZ, subventricular zone. G , Quantification of the number of F4/80 + cells (percentage of Hoechst + nuclei) located in the corpus callosum and external capsule of either Runx1 + / + (8.80 ± 0.77%) or Runx1 Lacz + (12.32 ± 0.62%) littermates. Data are presented as mean ± SEMof 15 sections from three different pups for each genotype ( n = 3; * p < 0.05, t test). N , Quantification of the number of F4/80 + cells (percentage of Hoechst + nuclei) located in the cerebral cortex of either Runx1 + / + (6.94 ± 0.49%) or Runx1 Lacz + (6.53 ± 0.41%) littermates. Data are presented as mean ± SEM of 15 sections from three different pups for each genotype ( n = 3). Increased numbersofmicrogliaaredetectedinthesubcorticalwhitematter,butnotcerebralcortex,of Runx1 LacZ/ + pupscomparedwithwild-typelittermates. O-Q , Analysis of F4/80 immunoreactivity in the telencephalon of P3 Runx1 + / + or Runx1 LacZ/ + mice. Arrow points to an example of cell with amoeboid morphology, while arrowhead points to an example of cell with ramified morphology. Q , Quantification of the number of amoeboid and ramified microglial cells located in the corpus callosum of either Runx1 + / + (23.50 ± 5.20% and 40.00 ± 1.44%, respectively) or Runx1 Lacz/ + (42.92 ± 4.62%and25.20 ± 0.92%,respectively) littermates. Data are presented as mean ± SEMof15sectionsfromthreedifferentpupsforeachgenotype( n = 3; * p < 0.05 and *** p < 0.001, t test). Runx1 LacZ/ + pups display increased numbers of amoeboid and decreased numbers of ramified microglia compared with control littermates. Scale bars: 250 𝛍 m( A-F and H-M , 100 𝛍 m( O , P ).CC-BY-NC-SA · From the PDF
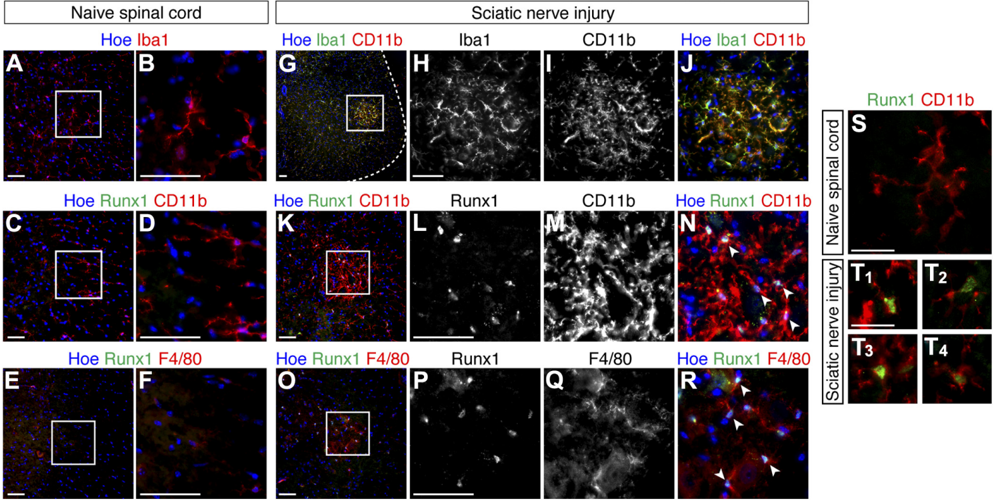
Figure 10 Upregulation of Runx1 expression in adult mouse spinal cord microglia following sciatic nerve injury. A , B , Immunofluorescence analysis of Iba1 expression in the ventral spinal cord (lumbar level) of naive uninjured mice. B Represents a high-magnification view of the boxed area in A . C-F , Double-label immunofluorescence analysis of Runx1 and either CD11b ( C , D ) or F4/80 ( E , F ) expression in the spinal cord of naive uninjured mice. D , F , Represent high-magnification views of the boxed areas in C and E . G-J , Double-label immunofluorescenceanalysis of Iba1 and CD11b expressionintheventralspinalcordofsciaticnerve-injuredmice.Dashedlinein G demarcatesthecontourofthespinalcord. H-J , High-magnificationviewsoftheboxedareain G . K-R , Double-label immunofluorescence analysis of Runx1 and either CD11b ( K-N ) or F4/80 ( O-R ) expression in the ventral spinal cord of sciatic nerve-injured mice. L-N and P-R , High-magnification views of boxed areas in K and O , respectively. Arrowheads in panels N and R point to examples of double-labeled cells. S , T , Double-label immunofluorescence analysis of Runx1 and CD11b expression in either the ventral lumbar spinal cord of control, untreated mice, where Runx1 was not expressed ( S ), or in the CD11b + cell aggregates observed in the ventral spinal cord of sciatic nerve-injured mice ( T ). T 1 -T 4 , Depict four different examples of Runx1 + /CD11b + cells in the ventral aggregates. Scale bars: A-R , 50 𝛍 m; or S , T , 25 𝛍 m.
Figure 10 Upregulation of Runx1 expression in adult mouse spinal cord microglia following sciatic nerve injury. A , B , Immunofluorescence analysis of Iba1 expression in the ventral spinal cord (lumbar level) of naive uninjured mice. B Represents a high-magnification view of the boxed area in A . C-F , Double-label immunofluorescence analysis of Runx1 and either CD11b ( C , D ) or F4/80 ( E , F ) expression in the spinal cord of naive uninjured mice. D , F , Represent high-magnification views of the boxed areas in C and E . G-J , Double-label immunofluorescenceanalysis of Iba1 and CD11b expressionintheventralspinalcordofsciaticnerve-injuredmice.Dashedlinein G demarcatesthecontourofthespinalcord. H-J , High-magnificationviewsoftheboxedareain G . K-R , Double-label immunofluorescence analysis of Runx1 and either CD11b ( K-N ) or F4/80 ( O-R ) expression in the ventral spinal cord of sciatic nerve-injured mice. L-N and P-R , High-magnification views of boxed areas in K and O , respectively. Arrowheads in panels N and R point to examples of double-labeled cells. S , T , Double-label immunofluorescence analysis of Runx1 and CD11b expression in either the ventral lumbar spinal cord of control, untreated mice, where Runx1 was not expressed ( S ), or in the CD11b + cell aggregates observed in the ventral spinal cord of sciatic nerve-injured mice ( T ). T 1 -T 4 , Depict four different examples of Runx1 + /CD11b + cells in the ventral aggregates. Scale bars: A-R , 50 𝛍 m; or S , T , 25 𝛍 m.CC-BY-NC-SA · From the PDF

Verification

Claims the paper makes

The claims and statistics of this paper haven’t been checked yet.

Run the check — free, no account needed. It reads the open-access text and checks the sources it cites.

A few free checks a day · papers already verified open instantly · results are public

Claims other papers make about this one

Each is checked against this paper’s own text: does it say what the citing paper says it does?

Self-check

Percentages, sums and reported differences re-computed from the paper’s own numbers.

The self-check needs the paper’s full text.

Citations

Cites

Show all 5 references

Research works printed but not linked: 37

  1. 10.1038/nn2014 · DOI · Paper page
  2. 10.1016/S0165-3806(99)00113-3 · DOI · Paper page
  3. 10.1002/jcb.22249 · DOI
  4. 10.1002/jcp.22240 · DOI
  5. 10.1186/1742-2094-8-33 · DOI
  6. 10.1074/jbc.M310023200 · DOI
  7. 10.1016/S0006-8993(02)02953-0 · DOI
  8. 10.1016/S1074-7613(00)00042-X · DOI
  9. 10.1128/MCB.25.18.8097-8107.2005 · DOI
  10. 10.1038/nrn3053 · DOI · Paper page
  11. 10.1016/j.it.2008.01.010 · DOI
  12. 10.1002/jcp.21738 · DOI
  13. 10.1016/S1074-7613(00)80181-8 · DOI
  14. 10.1007/s00401-009-0622-0 · DOI
  15. 10.1038/nn1997 · DOI · Paper page
  16. 10.1128/MCB.01308-09 · DOI
  17. 10.1002/glia.20896 · DOI
  18. Ichikawa, 2004, Runx1/AML-1 ranks as a master regulator of adult hematopoiesis, Cell Cycle, 3, 722, 10.4161/cc.3.6.951 · DOI
  19. 10.1002/jcb.21174 · DOI
  20. 10.1532/IJH97.06070 · DOI
  21. 10.1002/jcp.21950 · DOI
  22. 10.1074/jbc.275.1.651 · DOI
  23. Morrissette, 1999, Isolation and characterization of monoclonal antibodies directed against novel components of macrophage phagosomes, J Cell Sci, 112, 4705, 10.1242/jcs.112.24.4705 · DOI
  24. 10.1002/glia.21104 · DOI
  25. 10.1038/nature09615 · DOI · Paper page
  26. Sanagi, 2010, Appearance of phagocytic microglia adjacent to motoneurons in spinal cord tissue from a presymptomatic transgenic rat model of amyotrophic lateral sclerosis, J Neurosci Res, 88, 2736, 10.1002/jnr.22424 · DOI
  27. 10.1016/j.conb.2010.08.004 · DOI
  28. 10.1038/nn1992 · DOI
  29. 10.1186/1742-2094-8-121 · DOI
  30. 10.1002/glia.20379 · DOI
  31. 10.1016/S0171-2985(87)80083-9 · DOI
  32. 10.1038/13793 · DOI · Paper page
  33. 10.1073/pnas.0711299105 · DOI
  34. 10.1016/j.bcmd.2009.03.001 · DOI
  35. 10.1523/JNEUROSCI.5108-04.2005 · DOI
  36. 10.1186/1742-2094-8-38 · DOI
  37. 10.1371/journal.pone.0013944 · DOI

Cited by

Sorted by citations

Metadata

Authors
Zusso, M., Methot, L., Lo, R., Greenhalgh, A. D., David, S., & Stifani, S.
Venue
The Journal of Neuroscience
Published
2012-08-15
Volume
32
Issue
33
Pages
11285-11298
ISSN
  • 0270-6474
  • 1529-2401
Cited by
163
References
5
Language
en

About these checks

Registry, retraction, Cites and statistics results are computed, not judged, with one exception: a printed reference that no index lists is read once by a model before it counts as a citation error. Claims are extracted by a model and kept only when their quote appears verbatim in the text; each cited source is then checked, with a model’s help, for whether it says what the claim relies on. Those verdicts can be wrong — read the claim’s quote and the cited source before relying on one.

Statistics and arithmetic are recomputed, not judged.

Confidence bands are shown only for fields calibrated on our annotated test set. None is calibrated yet, so no band is shown.

What counts as a claim ›How we measure confidence ›How we check this ›

Are you an author, or do you see a problem with this page? Request a review