Cited by 31

The DOI matches its Crossref record; 9 of the 9 references it cites were found in a registry or an index.

Oxidative stress‐induced phosphorylation of JIP4 regulates lysosomal positioning in coordination with TRPML1 and ALG2

Sasazawa, Yukiko, Souma, Sanae, Furuya, Norihiko, Miura, Yoshiki, Kazuno, Saiko, Kakuta, Soichiro, Suzuki, Ayami, Hashimoto, Ryota, Hirawake‐Mogi, Hiroko, Date, Yuki, Imoto, Masaya, Ueno, Takashi, Kataura, Tetsushi, Korolchuk, Viktor I, Tsunemi, Taiji, Hattori, Nobutaka, Saiki, Shinji·2022·The EMBO Journal

Abstract

Retrograde transport of lysosomes is recognised as a critical autophagy regulator. Here, we found that acrolein, an aldehyde that is significantly elevated in Parkinson's disease patient serum, enhances autophagy by promoting lysosomal clustering around the microtubule organising centre via a newly identified JIP4‐TRPML1‐ALG2 pathway. Phosphorylation of JIP4 at T217 by CaMK2G in response to Ca 2+ fluxes tightly regulated this system. Increased vulnerability of JIP4 KO cells to acrolein indicated that lysosomal clustering and subsequent autophagy activation served as defence mechanisms against cytotoxicity of acrolein itself. Furthermore, the JIP4‐TRPML1‐ALG2 pathway was also activated by H 2 O 2 , indicating that this system acts as a broad mechanism of the oxidative stress response. Conversely, starvation‐induced lysosomal retrograde transport involved both the TMEM55B‐JIP4 and TRPML1‐ALG2 pathways in the absence of the JIP4 phosphorylation. Therefore, the phosphorylation status of JIP4 acts as a switch that controls the signalling pathways of lysosoma l distribution depending on the type of autophagy‐inducing signal.

Overview

The claims and statistics of this paper haven’t been checked yet.

Run the check — free, no account needed. It reads the open-access text and checks the sources it cites.

A few free checks a day · papers already verified open instantly · results are public

Integrity signals

Registry

Crossref · 10.15252/embj.2022111476

Cites

9 of 9 references verified0 citation errors · 0 not checkable

Statistics

Figures

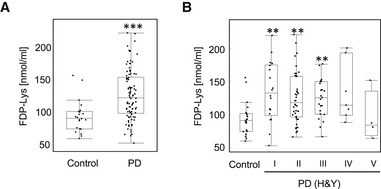
Figure 1 Serum acrolein levels in PD patients A, BThe amount of FDP‐lysine, which was major protein‐bound acrolein, in the sera of healthy controls and PD patients was determined by an ELISA ((A) all patients (control n = 22; PD n = 94)) and (B) staged by the H&Y scale, a five‐steps index of PD severity. A larger number indicates a more severe condition. n = 94; H&Y stage I (n = 18), stage II (n = 42), stage III (n = 23), stage IV (n = 7) and stage V (n = 4). The central mark in the box is the median. Box shows the 25–75 percentile range and the whiskers extend to the most extreme data points not considered outliers. ***P < 0.0001; **P < 0.01. ((A) Wilcoxon test and (B) Steel's test (vs. control)).
Figure 1 Serum acrolein levels in PD patients A, BThe amount of FDP‐lysine, which was major protein‐bound acrolein, in the sera of healthy controls and PD patients was determined by an ELISA ((A) all patients (control n = 22; PD n = 94)) and (B) staged by the H&Y scale, a five‐steps index of PD severity. A larger number indicates a more severe condition. n = 94; H&Y stage I (n = 18), stage II (n = 42), stage III (n = 23), stage IV (n = 7) and stage V (n = 4). The central mark in the box is the median. Box shows the 25–75 percentile range and the whiskers extend to the most extreme data points not considered outliers. ***P < 0.0001; **P < 0.01. ((A) Wilcoxon test and (B) Steel's test (vs. control)).CC BY · PubMed Central
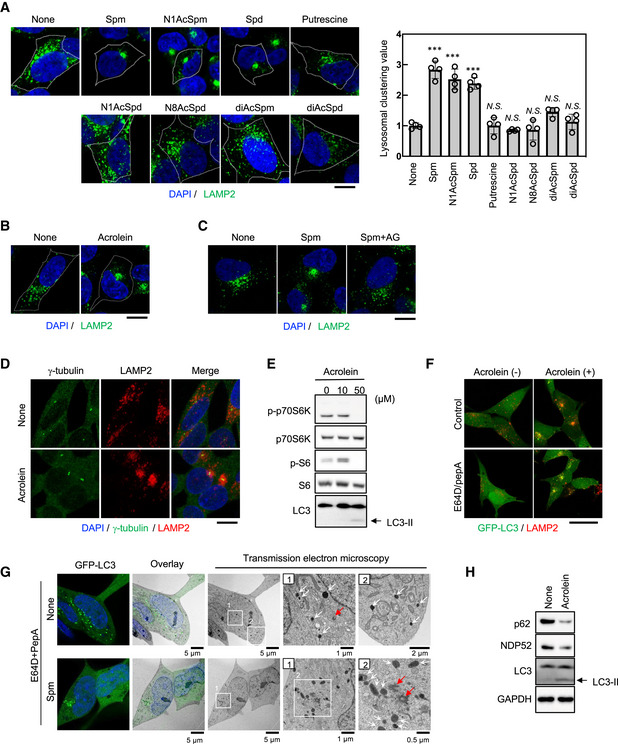
Figure 2 Spermine metabolised to acrolein promotes lysosomal distribution towards MTOC and facilitates autophagy A, BSH‐SY5Y cells were treated with the indicated chemicals at 50 μM for 4 h (A) and 40 μM acrolein for 2 h (B). Cells were fixed and stained with an anti‐LAMP2 (green) antibody as a lysosomal marker. Nuclei were stained with DAPI (blue). The cell membrane is indicated by the white line. Scale bar, 10 μm. Clustered relative to whole lysosomes was quantified as lysosomal clustering value (A, right). ***P < 0.0001; N.S., not statistically different (Dunnett's test, vs. NT). Four images were quantified per each condition. Values are mean ± SD. At least three experiments were replicated.CSH‐SY5Y cells pre‐treated with 1 mM aminoguanidine (AG) for 1 h were treated with spm for 4 h. Cells were fixed and stained with an anti‐LAMP2 antibody. Scale bar, 20 μm.DSH‐SY5Y cells were treated with 40 μM acrolein for 2 h. Cells were fixed and stained with an anti‐γ‐tubulin (green) antibody to detect MTOC and an anti‐LAMP2 (red) antibody. Nuclei were stained with DAPI (blue). Scale bar, 20 μm.ESH‐SY5Y cells were treated with acrolein for 2 h. Cell lysates were immunoblotted with the indicated antibodies.FSH‐SY5Y cells stably expressing GFP‐LC3 were pre‐treated with 10 μg/ml E64D plus pepstatin A for 2 h and then treated with 40 μM acrolein for an additional 2 h. Cells were fixed and stained with an anti‐LAMP2 (red) antibody. Nuclei were stained with DAPI (blue). Scale bar, 20 μm.GSH‐SY5Y cells stably expressing GFP‐LC3 were pre‐treated with 10 μg/ml E64D plus pepstatin A for 2 h and then treated with 50 μM spm for an additional 4 h, followed by CLEM analysis. Structures containing GFP were identified by confocal microscopy in fixed cells and then relocated after Epon embedding and imaged by electron microscopy. Lysosome‐like structures and centrosomes are indicated by white and red arrows respectively. Boxed regions (1, 2) are enlarged on the right.HSH‐SY5Y cells were treated with acrolein for 2 h. Cell lysates were immunoblotted with the indicated antibodies. Source data are available online for this figure.
Figure 2 Spermine metabolised to acrolein promotes lysosomal distribution towards MTOC and facilitates autophagy A, BSH‐SY5Y cells were treated with the indicated chemicals at 50 μM for 4 h (A) and 40 μM acrolein for 2 h (B). Cells were fixed and stained with an anti‐LAMP2 (green) antibody as a lysosomal marker. Nuclei were stained with DAPI (blue). The cell membrane is indicated by the white line. Scale bar, 10 μm. Clustered relative to whole lysosomes was quantified as lysosomal clustering value (A, right). ***P < 0.0001; N.S., not statistically different (Dunnett's test, vs. NT). Four images were quantified per each condition. Values are mean ± SD. At least three experiments were replicated.CSH‐SY5Y cells pre‐treated with 1 mM aminoguanidine (AG) for 1 h were treated with spm for 4 h. Cells were fixed and stained with an anti‐LAMP2 antibody. Scale bar, 20 μm.DSH‐SY5Y cells were treated with 40 μM acrolein for 2 h. Cells were fixed and stained with an anti‐γ‐tubulin (green) antibody to detect MTOC and an anti‐LAMP2 (red) antibody. Nuclei were stained with DAPI (blue). Scale bar, 20 μm.ESH‐SY5Y cells were treated with acrolein for 2 h. Cell lysates were immunoblotted with the indicated antibodies.FSH‐SY5Y cells stably expressing GFP‐LC3 were pre‐treated with 10 μg/ml E64D plus pepstatin A for 2 h and then treated with 40 μM acrolein for an additional 2 h. Cells were fixed and stained with an anti‐LAMP2 (red) antibody. Nuclei were stained with DAPI (blue). Scale bar, 20 μm.GSH‐SY5Y cells stably expressing GFP‐LC3 were pre‐treated with 10 μg/ml E64D plus pepstatin A for 2 h and then treated with 50 μM spm for an additional 4 h, followed by CLEM analysis. Structures containing GFP were identified by confocal microscopy in fixed cells and then relocated after Epon embedding and imaged by electron microscopy. Lysosome‐like structures and centrosomes are indicated by white and red arrows respectively. Boxed regions (1, 2) are enlarged on the right.HSH‐SY5Y cells were treated with acrolein for 2 h. Cell lysates were immunoblotted with the indicated antibodies. Source data are available online for this figure.CC BY · PubMed Central
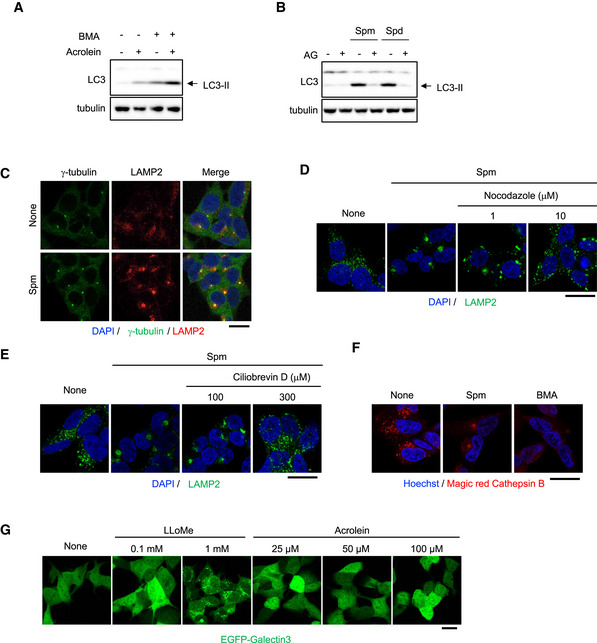
Figure EV1 Spm/acrolein enhances autophagy and lysosomal retrograde transport ASH‐SY5Y cells were treated with 40 μM acrolein and 100 nM bafilomycin A1 (BMA) for 2 h. Cell lysates were immunoblotted with the indicated antibodies.BSH‐SY5Y cells pre‐treated with 1 mM aminoguanidine (AG) for 1 h were treated with 50 μM spm or spd for 4 h. Cell lysates were immunoblotted with the indicated antibodies.CSH‐SY5Y cells were treated with 50 μM spm for 4 h. Cells were fixed and stained with an anti‐γ‐tubulin (green) antibody to detect MTOC and an anti‐LAMP2 (red) antibody. Nuclei were stained with DAPI (blue). Scale bar, 20 μm.D, ESH‐SY5Y cells were pre‐treated with the indicated concentrations of nocodazole (D) or ciliobrevin D (E) for 1 h and then treated with 50 μM spm for an additional 4 h. Cells were fixed and stained with an anti‐LAMP2 (green) antibody. Nuclei were stained with DAPI (blue). Scale bar, 20 μm.FSH‐SY5Y cells were treated with 50 μM spm or 100 nM bafilomycin A1 (BMA) for 4 h. Cathepsin B enzymatic activity was detected using a Magic Red‐Cathepsin B assay kit. Scale bar, 20 μm.GEGFP‐galectin‐3‐expressing SH‐SY5Y cells were treated with the indicated concentrations of acrolein and L‐leucyl‐L‐leucine methyl ester (LLOMe; as a positive control). Lysosomal damage was detected by EGFP‐galectin 3 accumulation. Scale bar, 20 μm. Source data are available online for this figure.
Figure EV1 Spm/acrolein enhances autophagy and lysosomal retrograde transport ASH‐SY5Y cells were treated with 40 μM acrolein and 100 nM bafilomycin A1 (BMA) for 2 h. Cell lysates were immunoblotted with the indicated antibodies.BSH‐SY5Y cells pre‐treated with 1 mM aminoguanidine (AG) for 1 h were treated with 50 μM spm or spd for 4 h. Cell lysates were immunoblotted with the indicated antibodies.CSH‐SY5Y cells were treated with 50 μM spm for 4 h. Cells were fixed and stained with an anti‐γ‐tubulin (green) antibody to detect MTOC and an anti‐LAMP2 (red) antibody. Nuclei were stained with DAPI (blue). Scale bar, 20 μm.D, ESH‐SY5Y cells were pre‐treated with the indicated concentrations of nocodazole (D) or ciliobrevin D (E) for 1 h and then treated with 50 μM spm for an additional 4 h. Cells were fixed and stained with an anti‐LAMP2 (green) antibody. Nuclei were stained with DAPI (blue). Scale bar, 20 μm.FSH‐SY5Y cells were treated with 50 μM spm or 100 nM bafilomycin A1 (BMA) for 4 h. Cathepsin B enzymatic activity was detected using a Magic Red‐Cathepsin B assay kit. Scale bar, 20 μm.GEGFP‐galectin‐3‐expressing SH‐SY5Y cells were treated with the indicated concentrations of acrolein and L‐leucyl‐L‐leucine methyl ester (LLOMe; as a positive control). Lysosomal damage was detected by EGFP‐galectin 3 accumulation. Scale bar, 20 μm. Source data are available online for this figure.CC BY · PubMed Central
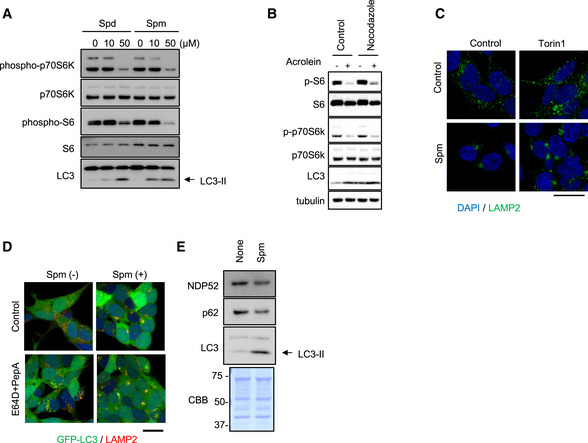
Figure EV2 Spm/acrolein suppresses mTORC1 signalling SH‐SY5Y cells were treated with spd or spm for 4 h. Cell lysates were immunoblotted with the indicated antibodies.SH‐SY5Y pre‐treated with 10 μM nocodazole for 1 h were then treated with 50 μM acrolein for 2 h. Cell lysates were immunoblotted with the indicated antibodies.SH‐SY5Y were treated with 200 nM Torin1 with or without 50 μM spm for 4 h. Cells were fixed and stained with an anti‐LAMP2 (green) antibody. Nuclei were stained with DAPI (blue). Scale bar, 20 μm.SH‐SY5Y cells stably expressing GFP‐LC3 were pre‐treated with 10 μg/ml E64D plus pepstatin A for 2 h and then treated with 50 μM spm for an additional 4 h. Cells were fixed and stained with an anti‐LAMP2 (red) antibody. Nuclei were stained with DAPI (blue). Scale bar, 20 μm.SH‐SY5Y cells were treated with spm for 4 h. Cell lysates were immunoblotted with the indicated antibodies. CBB staining was used as a loading control. Source data are available online for this figure.
Figure EV2 Spm/acrolein suppresses mTORC1 signalling SH‐SY5Y cells were treated with spd or spm for 4 h. Cell lysates were immunoblotted with the indicated antibodies.SH‐SY5Y pre‐treated with 10 μM nocodazole for 1 h were then treated with 50 μM acrolein for 2 h. Cell lysates were immunoblotted with the indicated antibodies.SH‐SY5Y were treated with 200 nM Torin1 with or without 50 μM spm for 4 h. Cells were fixed and stained with an anti‐LAMP2 (green) antibody. Nuclei were stained with DAPI (blue). Scale bar, 20 μm.SH‐SY5Y cells stably expressing GFP‐LC3 were pre‐treated with 10 μg/ml E64D plus pepstatin A for 2 h and then treated with 50 μM spm for an additional 4 h. Cells were fixed and stained with an anti‐LAMP2 (red) antibody. Nuclei were stained with DAPI (blue). Scale bar, 20 μm.SH‐SY5Y cells were treated with spm for 4 h. Cell lysates were immunoblotted with the indicated antibodies. CBB staining was used as a loading control. Source data are available online for this figure.CC BY · PubMed Central
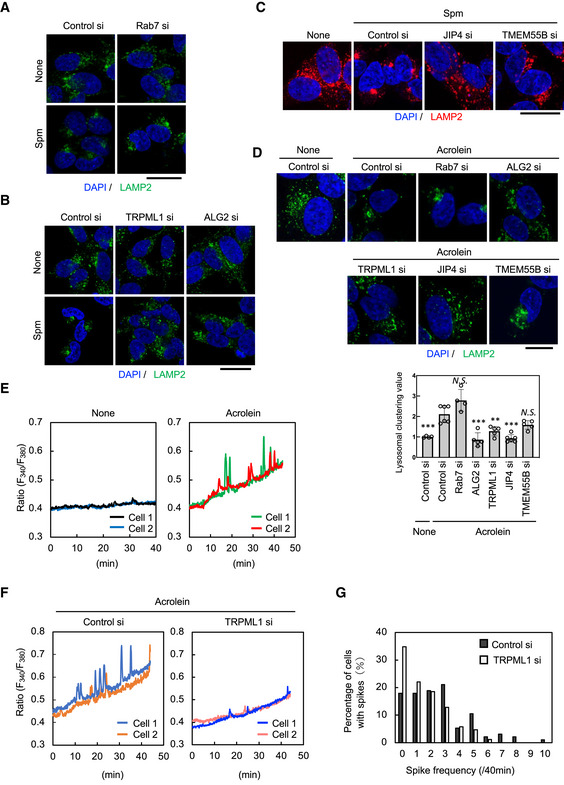
Figure 3 Spm/acrolein induces perinuclear lysosomal clustering through the TRPML1‐ALG2‐dynein pathway A, BSH‐SY5Y cells were transfected with the indicated siRNA for 48 h and then treated with 50 μM spm for 4 h. Cells were fixed and stained with an anti‐LAMP2 antibody (green). Nuclei were stained with DAPI (blue). Scale bar, 20 μm.CSH‐SY5Y cells were transfected with JIP4 siRNA or TMEM55B siRNA for 48 h, and then treated with 50 μM spm for 4 h. Cells were fixed and stained with an anti‐LAMP2 antibody (red). Nuclei were stained with DAPI (blue). Scale bar, 20 μm.DSH‐SY5Y cells were transfected with the indicated siRNAs for 48 h and then treated with 40 μM acrolein for 2 h. (Upper) Cells were fixed and stained with an anti‐LAMP2 antibody (green). Nuclei were stained with DAPI (blue). Scale bar, 10 μm. (Lower) Clustered relative to whole lysosomes was quantified as lysosomal clustering value. ***P < 0.0001; **P < 0.001; *P < 0.01; N.S., not statistically different (Dunnett's test, vs. control si‐acrolein). Four to six images were quantified per each condition. Values are mean ± SD. At least three experiments were replicated.EFura2‐AM‐loaded SH‐SY5Y cells were treated with 40 μM acrolein and observed by time‐lapse fluorescence microscopy at 5 s intervals. The fluorescence ratio (F340/F380) values in two representative cells are shown.FCells transfected with control siRNA (left) and TRPML1 siRNA (right) for 48 h were loaded with Fura2‐AM for 30 min. Cells were treated with 40 μM acrolein and observed by time‐lapse fluorescence microscopy at 5 s intervals. The fluorescence ratio (F340/F380) values in two representative cells are shown.GHistogram of the spike frequency. Spikes with an amplitude of more than 0.05 for 40 min were counted. The value represents the percentage of cells with the indicated number of spikes to the total cells. Spike frequency “0” means no spikes in the cell. Source data are available online for this figure.
Figure 3 Spm/acrolein induces perinuclear lysosomal clustering through the TRPML1‐ALG2‐dynein pathway A, BSH‐SY5Y cells were transfected with the indicated siRNA for 48 h and then treated with 50 μM spm for 4 h. Cells were fixed and stained with an anti‐LAMP2 antibody (green). Nuclei were stained with DAPI (blue). Scale bar, 20 μm.CSH‐SY5Y cells were transfected with JIP4 siRNA or TMEM55B siRNA for 48 h, and then treated with 50 μM spm for 4 h. Cells were fixed and stained with an anti‐LAMP2 antibody (red). Nuclei were stained with DAPI (blue). Scale bar, 20 μm.DSH‐SY5Y cells were transfected with the indicated siRNAs for 48 h and then treated with 40 μM acrolein for 2 h. (Upper) Cells were fixed and stained with an anti‐LAMP2 antibody (green). Nuclei were stained with DAPI (blue). Scale bar, 10 μm. (Lower) Clustered relative to whole lysosomes was quantified as lysosomal clustering value. ***P < 0.0001; **P < 0.001; *P < 0.01; N.S., not statistically different (Dunnett's test, vs. control si‐acrolein). Four to six images were quantified per each condition. Values are mean ± SD. At least three experiments were replicated.EFura2‐AM‐loaded SH‐SY5Y cells were treated with 40 μM acrolein and observed by time‐lapse fluorescence microscopy at 5 s intervals. The fluorescence ratio (F340/F380) values in two representative cells are shown.FCells transfected with control siRNA (left) and TRPML1 siRNA (right) for 48 h were loaded with Fura2‐AM for 30 min. Cells were treated with 40 μM acrolein and observed by time‐lapse fluorescence microscopy at 5 s intervals. The fluorescence ratio (F340/F380) values in two representative cells are shown.GHistogram of the spike frequency. Spikes with an amplitude of more than 0.05 for 40 min were counted. The value represents the percentage of cells with the indicated number of spikes to the total cells. Spike frequency “0” means no spikes in the cell. Source data are available online for this figure.CC BY · PubMed Central
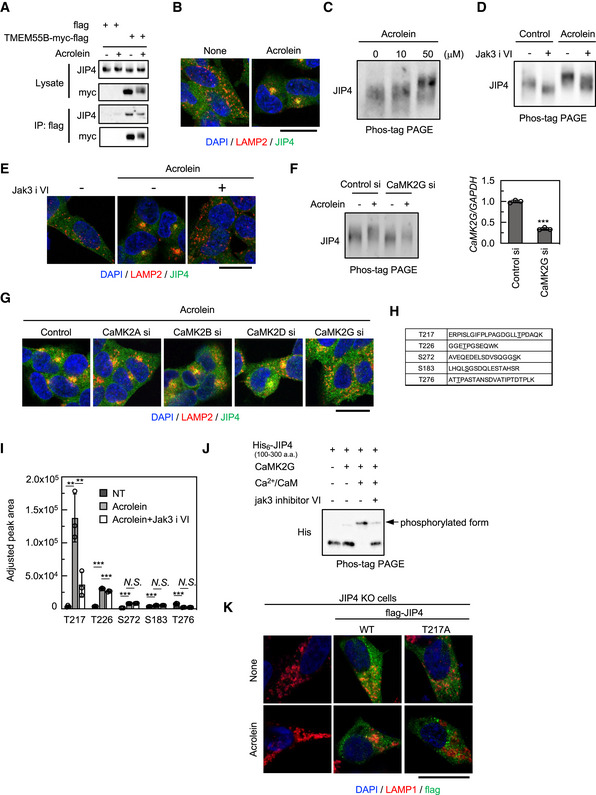
Figure 4 Phospho‐JIP4 mediates acrolein‐induced lysosomal clustering ACells were transfected with the TMEM55B‐myc‐DDK plasmid for 24 h and then treated with 40 μM acrolein for 2 h. Cell lysates were immunoprecipitated with flag magnetic beads and immunoblotted with the indicated antibodies.BSH‐SY5Y cells were treated with 40 μM acrolein for 2 h. Cells were fixed and stained with anti‐JIP4 (green) and anti‐LAMP2 (red) antibodies. Nuclei were stained with DAPI (blue). Scale bar, 20 μm.CSH‐SY5Y cells treated with the indicated concentration of acrolein for 2 h were lysed, subjected to Phos‐tag PAGE and immunoblotted with an anti‐JIP4 antibody.DSH‐SY5Y cells were pre‐treated with 10 μM Jak3 inhibitor VI (Jak3 i VI) for 1 h and then treated with 40 μM acrolein for an additional 2 h. Cell lysates were subjected to Phos‐tag PAGE and immunoblotted with an anti‐JIP4 antibody.ESH‐SY5Y cells were pre‐treated with 10 μM Jak3 inhibitor VI for 1 h and then treated with 40 μM acrolein for an additional 2 h. Cells were fixed and stained with anti‐JIP4 (green) and anti‐LAMP2 (red) antibodies. Nuclei were stained with DAPI (blue). Scale bar, 20 μm.F, GSH‐SY5Y cells transfected with indicated siRNAs for 48 h were treated with 40 μM acrolein for 2 h. Cell lysates were subjected to Phos‐tag PAGE and immunoblotted with anti‐JIP4 antibody (F, left). CaMK2G knockdown efficiency was confirmed by qRT–PCR; ***P < 0.001, n = 3 technical replicates. Values are mean ± SD. At least three experiments were replicated (F, right). Cells were fixed and stained with anti‐LAMP2 and anti‐JIP4 antibodies. Scale bar, 20 μm (G).HPeptide sequence detected by mass spectrometry. The underlined amino acid was modified with phosphoric acid.IThe amount of each phosphorylated peptide when cells were treated with 40 μM acrolein or cotreated with acrolein and JAK3 inhibitor VI compared with the control was determined by SWATH‐MS analysis. ***P < 0.001, **P < 0.01; N.S., not statistically different. (Tukey–Kramer's test); n = 3 technical replicates. Values are mean ± SD.JHis6‐tagged recombinant truncated JIP4 (100–300 aa) was purified from E. coli and incubated with recombinant CaMK2G with/without Ca2+ and calmodulin at 30°C for 1 h. The reactant was subjected to Phos‐tag PAGE and immunoblotted with anti‐His antibody. Jak3 inhibitor VI was pre‐reacted with CaMK2G for 30 min.KJIP4 KO cells were transfected with flag‐tagged JIP4 (WT and T217A) for 24 h and treated with 40 μM acrolein for 2 h. Cells were fixed and stained with the indicated antibodies. Scale bar, 20 μM. Source data are available online for this figure.
Figure 4 Phospho‐JIP4 mediates acrolein‐induced lysosomal clustering ACells were transfected with the TMEM55B‐myc‐DDK plasmid for 24 h and then treated with 40 μM acrolein for 2 h. Cell lysates were immunoprecipitated with flag magnetic beads and immunoblotted with the indicated antibodies.BSH‐SY5Y cells were treated with 40 μM acrolein for 2 h. Cells were fixed and stained with anti‐JIP4 (green) and anti‐LAMP2 (red) antibodies. Nuclei were stained with DAPI (blue). Scale bar, 20 μm.CSH‐SY5Y cells treated with the indicated concentration of acrolein for 2 h were lysed, subjected to Phos‐tag PAGE and immunoblotted with an anti‐JIP4 antibody.DSH‐SY5Y cells were pre‐treated with 10 μM Jak3 inhibitor VI (Jak3 i VI) for 1 h and then treated with 40 μM acrolein for an additional 2 h. Cell lysates were subjected to Phos‐tag PAGE and immunoblotted with an anti‐JIP4 antibody.ESH‐SY5Y cells were pre‐treated with 10 μM Jak3 inhibitor VI for 1 h and then treated with 40 μM acrolein for an additional 2 h. Cells were fixed and stained with anti‐JIP4 (green) and anti‐LAMP2 (red) antibodies. Nuclei were stained with DAPI (blue). Scale bar, 20 μm.F, GSH‐SY5Y cells transfected with indicated siRNAs for 48 h were treated with 40 μM acrolein for 2 h. Cell lysates were subjected to Phos‐tag PAGE and immunoblotted with anti‐JIP4 antibody (F, left). CaMK2G knockdown efficiency was confirmed by qRT–PCR; ***P < 0.001, n = 3 technical replicates. Values are mean ± SD. At least three experiments were replicated (F, right). Cells were fixed and stained with anti‐LAMP2 and anti‐JIP4 antibodies. Scale bar, 20 μm (G).HPeptide sequence detected by mass spectrometry. The underlined amino acid was modified with phosphoric acid.IThe amount of each phosphorylated peptide when cells were treated with 40 μM acrolein or cotreated with acrolein and JAK3 inhibitor VI compared with the control was determined by SWATH‐MS analysis. ***P < 0.001, **P < 0.01; N.S., not statistically different. (Tukey–Kramer's test); n = 3 technical replicates. Values are mean ± SD.JHis6‐tagged recombinant truncated JIP4 (100–300 aa) was purified from E. coli and incubated with recombinant CaMK2G with/without Ca2+ and calmodulin at 30°C for 1 h. The reactant was subjected to Phos‐tag PAGE and immunoblotted with anti‐His antibody. Jak3 inhibitor VI was pre‐reacted with CaMK2G for 30 min.KJIP4 KO cells were transfected with flag‐tagged JIP4 (WT and T217A) for 24 h and treated with 40 μM acrolein for 2 h. Cells were fixed and stained with the indicated antibodies. Scale bar, 20 μM. Source data are available online for this figure.CC BY · PubMed Central
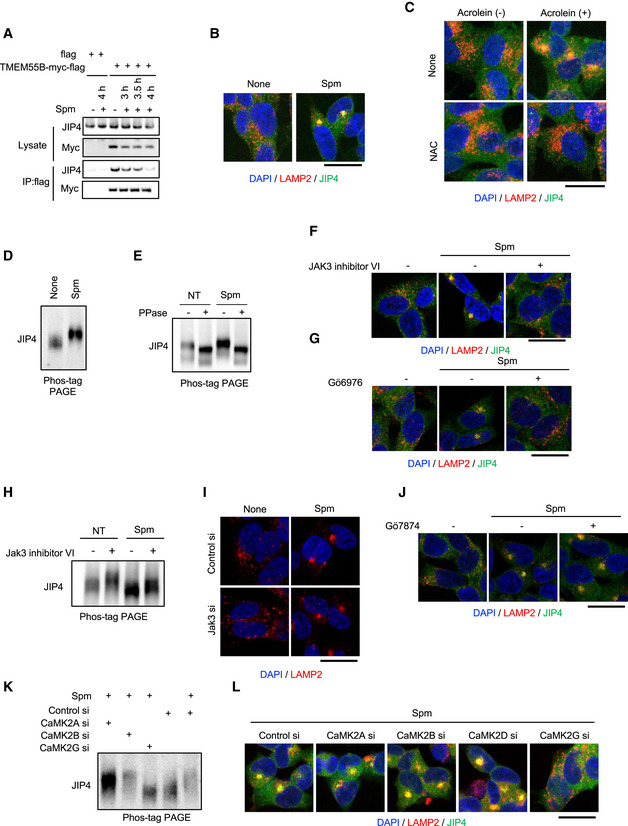
Figure EV3 Spm/acrolein‐induced lysosomal clustering and JIP4 phosphorylation are mediated by CaMK2G ACells were transfected with the TMEM55B‐myc‐DDK plasmid for 24 h and then treated with 50 μM spm for 4 h. Cell lysates were immunoprecipitated with flag magnetic beads and immunoblotted with the indicated antibodies.BSH‐SY5Y cells were treated with 50 μM spm for 4 h. Cells were fixed and stained with anti‐JIP4 (green) and anti‐LAMP2 (red) antibodies. Nuclei were stained with DAPI (blue). Scale bar, 20 μm.CSH‐SY5Y cells were pre‐treated with 0.1 mM N‐acetyl‐L‐cysteine (NAC) for 1 h and then treated with 50 μM acrolein for an additional 2 h. Cells were fixed and stained with anti‐LAMP2 (green) and anti‐JIP4 antibodies. Nuclei were stained with DAPI (blue). Scale bar, 20 μm.DSH‐SY5Y cells treated with 50 μM spm for 4 h were lysed, subjected to Phos‐tag PAGE and immunoblotted with an anti‐JIP4 antibody.ESH‐SY5Y cells treated with 50 μM spm were lysed and treated with lambda phosphatase (PPase) for 60 min. The reactant was subjected to Phos‐tag PAGE and immunoblotted with an anti‐JIP4 antibody.F, GSH‐SY5Y cells pre‐treated with 10 μM JAK3 inhibitor VI (E) and 5 μM Gö6976 (F) for 1 h were treated with 50 μM spm for an additional 4 h. Cells were fixed and stained with anti‐JIP4 (green) and anti‐LAMP2 antibodies (red) (scale bar, 20 μm).HSH‐SY5Y cells were pre‐treated with 10 μM Jak3 inhibitor VI for 1 h and then treated with 50 μM spm for an additional 4 h. Cells lysates were subjected to Phos‐tag PAGE and immunoblotted with an anti‐JIP4 antibody.ISH‐SY5Y cells transfected with Jak3 siRNA for 48 h were treated with 50 μM spm for 4 h. Cells were fixed and stained with an anti‐LAMP2 antibody (red). Scale bar, 20 μm.JSH‐SY5Y cells pre‐treated with 1 μM Gö7874 for 1 h were treated with 50 μM spm for an additional 4 h. Cells were fixed and stained with anti‐JIP4 (green) and anti‐LAMP2 antibodies (red) (scale bar, 20 μm).K, LSH‐SY5Y cells transfected with the indicated siRNAs for 48 h were treated with 50 μM spm for 4 h. (K) Cell lysates were subjected to Phos‐tag PAGE and immunoblotted with an anti‐JIP4 antibody. (L) Cells were fixed and stained with anti‐LAMP2 (red) and anti‐JIP4 (green) antibodies. Scale bar, 20 μm. Source data are available online for this figure.
Figure EV3 Spm/acrolein‐induced lysosomal clustering and JIP4 phosphorylation are mediated by CaMK2G ACells were transfected with the TMEM55B‐myc‐DDK plasmid for 24 h and then treated with 50 μM spm for 4 h. Cell lysates were immunoprecipitated with flag magnetic beads and immunoblotted with the indicated antibodies.BSH‐SY5Y cells were treated with 50 μM spm for 4 h. Cells were fixed and stained with anti‐JIP4 (green) and anti‐LAMP2 (red) antibodies. Nuclei were stained with DAPI (blue). Scale bar, 20 μm.CSH‐SY5Y cells were pre‐treated with 0.1 mM N‐acetyl‐L‐cysteine (NAC) for 1 h and then treated with 50 μM acrolein for an additional 2 h. Cells were fixed and stained with anti‐LAMP2 (green) and anti‐JIP4 antibodies. Nuclei were stained with DAPI (blue). Scale bar, 20 μm.DSH‐SY5Y cells treated with 50 μM spm for 4 h were lysed, subjected to Phos‐tag PAGE and immunoblotted with an anti‐JIP4 antibody.ESH‐SY5Y cells treated with 50 μM spm were lysed and treated with lambda phosphatase (PPase) for 60 min. The reactant was subjected to Phos‐tag PAGE and immunoblotted with an anti‐JIP4 antibody.F, GSH‐SY5Y cells pre‐treated with 10 μM JAK3 inhibitor VI (E) and 5 μM Gö6976 (F) for 1 h were treated with 50 μM spm for an additional 4 h. Cells were fixed and stained with anti‐JIP4 (green) and anti‐LAMP2 antibodies (red) (scale bar, 20 μm).HSH‐SY5Y cells were pre‐treated with 10 μM Jak3 inhibitor VI for 1 h and then treated with 50 μM spm for an additional 4 h. Cells lysates were subjected to Phos‐tag PAGE and immunoblotted with an anti‐JIP4 antibody.ISH‐SY5Y cells transfected with Jak3 siRNA for 48 h were treated with 50 μM spm for 4 h. Cells were fixed and stained with an anti‐LAMP2 antibody (red). Scale bar, 20 μm.JSH‐SY5Y cells pre‐treated with 1 μM Gö7874 for 1 h were treated with 50 μM spm for an additional 4 h. Cells were fixed and stained with anti‐JIP4 (green) and anti‐LAMP2 antibodies (red) (scale bar, 20 μm).K, LSH‐SY5Y cells transfected with the indicated siRNAs for 48 h were treated with 50 μM spm for 4 h. (K) Cell lysates were subjected to Phos‐tag PAGE and immunoblotted with an anti‐JIP4 antibody. (L) Cells were fixed and stained with anti‐LAMP2 (red) and anti‐JIP4 (green) antibodies. Scale bar, 20 μm. Source data are available online for this figure.CC BY · PubMed Central
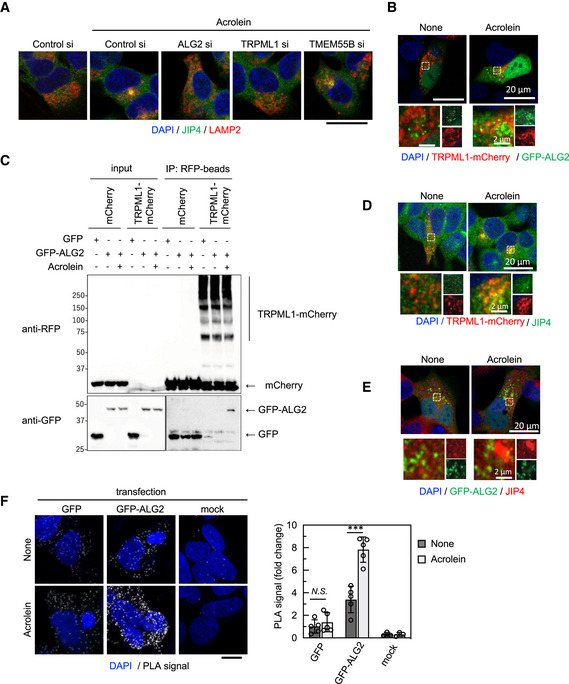
Figure 5 JIP4‐dependent lysosomal retrograde transport requires TRPML1‐ALG2 signalling SH‐SY5Y cells were transfected with the indicated siRNAs for 48 h and then treated with 40 μM acrolein for 2 h. Cells were fixed and stained with anti‐JIP4 (green) and anti‐LAMP2 (red) antibodies. Nuclei were stained with DAPI (blue). Scale bar, 20 μm.TRPML1‐mCherry stably expressing SH‐SY5Y cells were transfected with GFP‐ALG2 for 48 h and then treated with 40 μM acrolein for 2 h. Cells were fixed, and then green and red fluorescence were detected by confocal microscopy.GFP or GFP‐ALG2‐transfected TRPML1‐mCherry stably expressing cells were treated with acrolein for 2 h. Cell lysates were immunoprecipitated with anti‐RFP magnetic beads and immunoblotted with the indicated antibodies.TRPML1‐mCherry stably expressing SH‐SY5Y cells were treated with 40 μM acrolein for 2 h. Cells were fixed and stained with an anti‐JIP4 (green) antibody.SH‐SY5Y cells were transfected with GFP‐ALG2 for 48 h and then treated with 40 μM acrolein for 2 h. Cells were fixed and stained with an anti‐JIP4 (red) antibody.SH‐SY5Y cells transfected with GFP or GFP‐ALG2 for 24 h were treated with acrolein for 2 h and then spatial proximity of JIP4 and GFP was detected by a PLA using JIP4 and GFP antibodies. Scale bar, 10 μm. ***P < 0.001; N.S., not statistically different (Tukey–Kramer's test). Three to five images were quantified per each condition. Values are mean ± SD. At least three experiments were replicated. Source data are available online for this figure.
Figure 5 JIP4‐dependent lysosomal retrograde transport requires TRPML1‐ALG2 signalling SH‐SY5Y cells were transfected with the indicated siRNAs for 48 h and then treated with 40 μM acrolein for 2 h. Cells were fixed and stained with anti‐JIP4 (green) and anti‐LAMP2 (red) antibodies. Nuclei were stained with DAPI (blue). Scale bar, 20 μm.TRPML1‐mCherry stably expressing SH‐SY5Y cells were transfected with GFP‐ALG2 for 48 h and then treated with 40 μM acrolein for 2 h. Cells were fixed, and then green and red fluorescence were detected by confocal microscopy.GFP or GFP‐ALG2‐transfected TRPML1‐mCherry stably expressing cells were treated with acrolein for 2 h. Cell lysates were immunoprecipitated with anti‐RFP magnetic beads and immunoblotted with the indicated antibodies.TRPML1‐mCherry stably expressing SH‐SY5Y cells were treated with 40 μM acrolein for 2 h. Cells were fixed and stained with an anti‐JIP4 (green) antibody.SH‐SY5Y cells were transfected with GFP‐ALG2 for 48 h and then treated with 40 μM acrolein for 2 h. Cells were fixed and stained with an anti‐JIP4 (red) antibody.SH‐SY5Y cells transfected with GFP or GFP‐ALG2 for 24 h were treated with acrolein for 2 h and then spatial proximity of JIP4 and GFP was detected by a PLA using JIP4 and GFP antibodies. Scale bar, 10 μm. ***P < 0.001; N.S., not statistically different (Tukey–Kramer's test). Three to five images were quantified per each condition. Values are mean ± SD. At least three experiments were replicated. Source data are available online for this figure.CC BY · PubMed Central
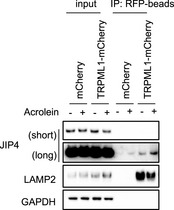
Figure EV4 JIP4 translocates to the lysosome in response to acrolein treatment mCherry and TRPML1‐mCherry stably expressing SH‐SY5Y cells were treated with 50 μM acrolein for 2 h. Lysosomes were isolated by Lyso‐IP using anti‐RFP magnetic beads. Each fraction was immunoblotted with indicated antibodies.Source data are available online for this figure.
Figure EV4 JIP4 translocates to the lysosome in response to acrolein treatment mCherry and TRPML1‐mCherry stably expressing SH‐SY5Y cells were treated with 50 μM acrolein for 2 h. Lysosomes were isolated by Lyso‐IP using anti‐RFP magnetic beads. Each fraction was immunoblotted with indicated antibodies.Source data are available online for this figure.CC BY · PubMed Central
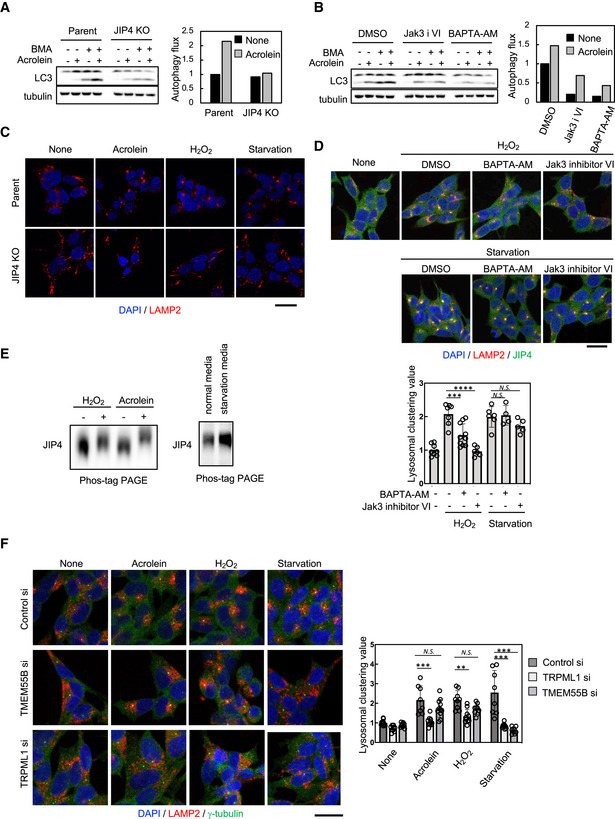
Figure 6 The phosphorylation state of JIP4 acts as the switch that controls lysosomal positioning A, BParental and JIP4 KO SH‐SY5Y cells were treated with 40 μM acrolein with or without 100 nM bafilomycin A1 for 2 h (A). SH‐SY5Y cells were treated with 40 μM acrolein with or without 100 nM bafilomycin A1 in the presence of 10 μM Jak3 inhibitor VI (Jak3 i VI) for 2 h (B). Cell lysates were immunoblotted with the indicated antibodies. Autophagic flux was determined as the LC3‐II production rate calculated as the level of LC3‐II with bafilomycin A1 treatment.CParental and JIP4 KO SH‐SY5Y cells were treated with 40 μM acrolein and 500 μM H2O2 or cultured in the starvation medium for 2 h and then stained with an anti‐LAMP2 antibody (red). Nuclei were stained with DAPI (blue). Scale bar, 20 μm.D(Upper) SH‐SY5Y cells were pre‐treated with 10 μM BAPTA‐AM or 10 μM Jak3 inhibitor VI for 1 h and then treated with 500 μM H2O2 for an additional 2 h or cultured in the starvation medium for an additional 2 h. Cells were fixed and stained with anti‐JIP4 (green) and anti‐LAMP2 (red) antibodies. Nuclei were stained with DAPI (blue). Scale bar, 20 μm. (Lower) Clustered relative to whole lysosomes was quantified as lysosomal clustering value. ****P < 0.0001, ***P < 0.001; N.S., not statistically different (Tukey–Kramer's test). Four to ten images were quantified per each condition. Values are mean ± SD. At least three experiments were replicated.ESH‐SY5Y cells were treated with 40 μM acrolein and 500 μM H2O2 or cultured in the starvation medium for 2 h. Cells were lysed, subjected to Phos‐tag PAGE and immunoblotted with anti‐JIP4 antibody.F(left) SH‐SY5Y cells were transfected with TMEM55B or TRPML1 siRNAs for 48 h and then treated with 40 μM acrolein and 500 μM H2O2 or cultured in the starvation medium for 2 h. Cells were fixed and stained with anti‐γ‐tubulin (green) and anti‐LAMP2 (red) antibodies. Nuclei were stained with DAPI (blue). Scale bar, 20 μm. (Right) Clustered relative to whole lysosomes was quantified as lysosomal clustering value. ***P < 0.001, **P < 0.01; N.S., not statistically different (Tukey–Kramer's test). Eight to 12 images were quantified per each condition. Values are mean ± SD. At least three experiments were replicated. Source data are available online for this figure.
Figure 6 The phosphorylation state of JIP4 acts as the switch that controls lysosomal positioning A, BParental and JIP4 KO SH‐SY5Y cells were treated with 40 μM acrolein with or without 100 nM bafilomycin A1 for 2 h (A). SH‐SY5Y cells were treated with 40 μM acrolein with or without 100 nM bafilomycin A1 in the presence of 10 μM Jak3 inhibitor VI (Jak3 i VI) for 2 h (B). Cell lysates were immunoblotted with the indicated antibodies. Autophagic flux was determined as the LC3‐II production rate calculated as the level of LC3‐II with bafilomycin A1 treatment.CParental and JIP4 KO SH‐SY5Y cells were treated with 40 μM acrolein and 500 μM H2O2 or cultured in the starvation medium for 2 h and then stained with an anti‐LAMP2 antibody (red). Nuclei were stained with DAPI (blue). Scale bar, 20 μm.D(Upper) SH‐SY5Y cells were pre‐treated with 10 μM BAPTA‐AM or 10 μM Jak3 inhibitor VI for 1 h and then treated with 500 μM H2O2 for an additional 2 h or cultured in the starvation medium for an additional 2 h. Cells were fixed and stained with anti‐JIP4 (green) and anti‐LAMP2 (red) antibodies. Nuclei were stained with DAPI (blue). Scale bar, 20 μm. (Lower) Clustered relative to whole lysosomes was quantified as lysosomal clustering value. ****P < 0.0001, ***P < 0.001; N.S., not statistically different (Tukey–Kramer's test). Four to ten images were quantified per each condition. Values are mean ± SD. At least three experiments were replicated.ESH‐SY5Y cells were treated with 40 μM acrolein and 500 μM H2O2 or cultured in the starvation medium for 2 h. Cells were lysed, subjected to Phos‐tag PAGE and immunoblotted with anti‐JIP4 antibody.F(left) SH‐SY5Y cells were transfected with TMEM55B or TRPML1 siRNAs for 48 h and then treated with 40 μM acrolein and 500 μM H2O2 or cultured in the starvation medium for 2 h. Cells were fixed and stained with anti‐γ‐tubulin (green) and anti‐LAMP2 (red) antibodies. Nuclei were stained with DAPI (blue). Scale bar, 20 μm. (Right) Clustered relative to whole lysosomes was quantified as lysosomal clustering value. ***P < 0.001, **P < 0.01; N.S., not statistically different (Tukey–Kramer's test). Eight to 12 images were quantified per each condition. Values are mean ± SD. At least three experiments were replicated. Source data are available online for this figure.CC BY · PubMed Central
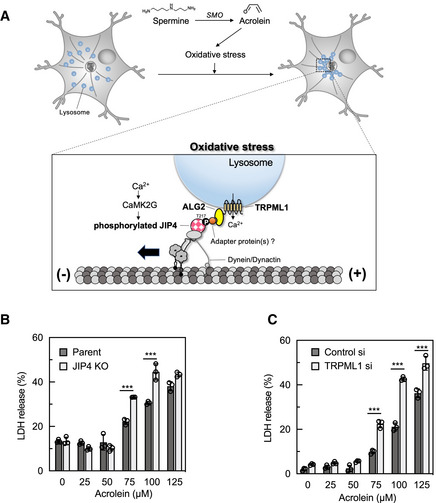
Figure 7 Schematic illustration of the lysosomal retrograde transport in response to oxidative stress Proposed lysosomal retrograde transport signalling in response to oxidative stress. Oxidative stress induces Ca2+ release from TRPML1, resulting in JIP4 T217 phosphorylation by CaMK2G. Phosphorylated JIP4 complexes with ALG2 and TRPML1, thereby promoting lysosomal retrograde transport.Parental and JIP4 KO SH‐SY5Y cells were treated with various concentrations of acrolein for 24 h. Cytotoxicity was measured by an LDH assay. ***P < 0.0001 (Tukey–Kramer's test); n = 3 from independent cultures. Values are mean ± SD. At least three experiments were replicated.SH‐SY5Y cells were transfected with TRPML1 siRNAs for 48 h and then treated with various concentrations of acrolein for 24 h. Cytotoxicity was measured by an LDH assay. ***P < 0.0001 (Tukey–Kramer's test); n = 3 from independent cultures. Values are mean ± SD. At least three experiments were replicated. Source data are available online for this figure.
Figure 7 Schematic illustration of the lysosomal retrograde transport in response to oxidative stress Proposed lysosomal retrograde transport signalling in response to oxidative stress. Oxidative stress induces Ca2+ release from TRPML1, resulting in JIP4 T217 phosphorylation by CaMK2G. Phosphorylated JIP4 complexes with ALG2 and TRPML1, thereby promoting lysosomal retrograde transport.Parental and JIP4 KO SH‐SY5Y cells were treated with various concentrations of acrolein for 24 h. Cytotoxicity was measured by an LDH assay. ***P < 0.0001 (Tukey–Kramer's test); n = 3 from independent cultures. Values are mean ± SD. At least three experiments were replicated.SH‐SY5Y cells were transfected with TRPML1 siRNAs for 48 h and then treated with various concentrations of acrolein for 24 h. Cytotoxicity was measured by an LDH assay. ***P < 0.0001 (Tukey–Kramer's test); n = 3 from independent cultures. Values are mean ± SD. At least three experiments were replicated. Source data are available online for this figure.CC BY · PubMed Central
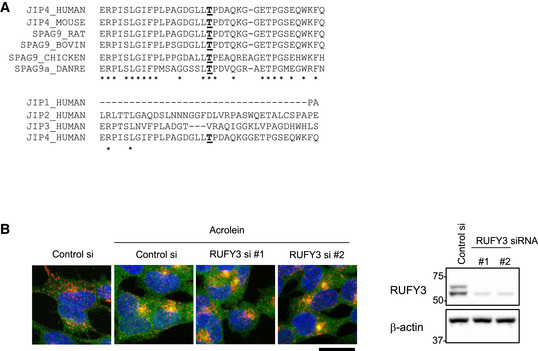
Figure EV5 RUFY3 is not involved in acrolein‐induced lysosomal clustering The sequence alignment analyses of JIP4 or JIP4 homologues among vertebrate species (upper), and human JIP1, JIP2, JIP3 and JIP4 (lower). Common amino acids were indicated by asterisks. T217 in human JIP4 and its homologous amino acids were underlined.SH‐SY5Y cells transfected with the indicated siRNAs for 48 h were treated with 50 μM acrolein for 2 h. (left) Cells were fixed and stained with anti‐LAMP2 (red) and anti‐JIP4 (green) antibodies. Scale bar, 20 μm. (Right) The knockdown efficiency of each siRNA was assessed by immunoblotting with anti‐RUFY3 antibody. Source data are available online for this figure.
Figure EV5 RUFY3 is not involved in acrolein‐induced lysosomal clustering The sequence alignment analyses of JIP4 or JIP4 homologues among vertebrate species (upper), and human JIP1, JIP2, JIP3 and JIP4 (lower). Common amino acids were indicated by asterisks. T217 in human JIP4 and its homologous amino acids were underlined.SH‐SY5Y cells transfected with the indicated siRNAs for 48 h were treated with 50 μM acrolein for 2 h. (left) Cells were fixed and stained with anti‐LAMP2 (red) and anti‐JIP4 (green) antibodies. Scale bar, 20 μm. (Right) The knockdown efficiency of each siRNA was assessed by immunoblotting with anti‐RUFY3 antibody. Source data are available online for this figure.CC BY · PubMed Central

Verification

Claims the paper makes

The claims and statistics of this paper haven’t been checked yet.

Run the check — free, no account needed. It reads the open-access text and checks the sources it cites.

A few free checks a day · papers already verified open instantly · results are public

Claims other papers make about this one

Each is checked against this paper’s own text: does it say what the citing paper says it does?

Self-check

Percentages, sums and reported differences re-computed from the paper’s own numbers.

The self-check needs the paper’s full text.

Citations

Cites

Show all 9 references

Research works printed but not linked: 51

  1. Abu‐Remaileh M, Wyant GA, Kim C, Laqtom NN, Abbasi M, Chan SH, Freinkman E, Sabatini DM (2017) Lysosomal metabolomics reveals V‐ATPase‐ and mTOR‐dependent regulation of amino acid efflux from lysosomes. Science 358: 807–813 · DOI
  2. Acosta G, Race N, Herr S, Fernandez J, Tang J, Rogers E, Shi R (2019) Acrolein‐mediated alpha‐synuclein pathology involvement in the early post‐injury pathogenesis of mild blast‐induced parkinsonian neurodegeneration. Mol Cell Neurosci 98: 140–154 · DOI
  3. Ambaw A, Zheng L, Tambe MA, Strathearn KE, Acosta G, Hubers SA, Liu F, Herr SA, Tang J, Truong A et al (2018) Acrolein‐mediated neuronal cell death and alpha‐synuclein aggregation: implications for Parkinson's disease. Mol Cell Neurosci 88: 70–82 · DOI
  4. Ballabio A, Bonifacino JS (2020) Lysosomes as dynamic regulators of cell and organismal homeostasis. Nat Rev Mol Cell Biol 21: 101–118 · DOI · Paper page
  5. Bautista DM, Jordt SE, Nikai T, Tsuruda PR, Read AJ, Poblete J, Yamoah EN, Basbaum AI, Julius D (2006) TRPA1 mediates the inflammatory actions of environmental irritants and proalgesic agents. Cell 124: 1269–1282 · DOI
  6. Braun AP, Schulman H (1995) The multifunctional calcium/calmodulin‐dependent protein kinase: from form to function. Annu Rev Physiol 57: 417–445 · DOI
  7. Cabukusta B, Neefjes J (2018) Mechanisms of lysosomal positioning and movement. Traffic 19: 761–769 · DOI
  8. Cai Q, Lu L, Tian JH, Zhu YB, Qiao H, Sheng ZH (2010) Snapin‐regulated late endosomal transport is critical for efficient autophagy‐lysosomal function in neurons. Neuron 68: 73–86 · DOI · Paper page
  9. Coultrap SJ, Bayer KU (2012) CaMKII regulation in information processing and storage. Trends Neurosci 35: 607–618 · DOI
  10. Dong XP, Shen D, Wang X, Dawson T, Li X, Zhang Q, Cheng X, Zhang Y, Weisman LS, Delling M et al (2010) PI(3,5)P(2) controls membrane trafficking by direct activation of mucolipin ca(2+) release channels in the endolysosome. Nat Commun 1: 38 · DOI
  11. Gowrishankar S, Wu Y, Ferguson SM (2017) Impaired JIP3‐dependent axonal lysosome transport promotes amyloid plaque pathology. J Cell Biol 216: 3291–3305 · DOI · Paper page
  12. Gupta VK, Scheunemann L, Eisenberg T, Mertel S, Bhukel A, Koemans TS, Kramer JM, Liu KS, Schroeder S, Stunnenberg HG et al (2013) Restoring polyamines protects from age‐induced memory impairment in an autophagy‐dependent manner. Nat Neurosci 16: 1453–1460 · DOI
  13. Hamann K, Shi R (2009) Acrolein scavenging: a potential novel mechanism of attenuating oxidative stress following spinal cord injury. J Neurochem 111: 1348–1356 · DOI
  14. Holbert CE, Dunworth M, Foley JR, Dunston TT, Stewart TM, Casero RA Jr (2020) Autophagy induction by exogenous polyamines is an artifact of bovine serum amine oxidase activity in culture serum. J Biol Chem 295: 9061–9068 · DOI
  15. Igarashi K, Kashiwagi K (2021) Functional roles of polyamines and their metabolite acrolein in eukaryotic cells. Amino Acids 53: 1473–1492 · DOI
  16. Jefferies HB, Cooke FT, Jat P, Boucheron C, Koizumi T, Hayakawa M, Kaizawa H, Ohishi T, Workman P, Waterfield MD et al (2008) A selective PIKfyve inhibitor blocks PtdIns(3,5)P(2) production and disrupts endomembrane transport and retroviral budding. EMBO Rep 9: 164–170 · DOI
  17. Jiang C, Jiang L, Li Q, Liu X, Zhang T, Dong L, Liu T, Liu L, Hu G, Sun X et al (2018) Acrolein induces NLRP3 inflammasome‐mediated pyroptosis and suppresses migration via ROS‐dependent autophagy in vascular endothelial cells. Toxicology 410: 26–40 · DOI
  18. Jiang L, Luo S, Qiu T, Li Q, Jiang C, Sun X, Yang G, Zhang C, Liu X, Jiang L (2021) Bidirectional role of reactive oxygen species during inflammasome activation in acrolein‐induced human EAhy926 cells pyroptosis. Toxicol Mech Methods 31: 680–689 · DOI
  19. Kabeya Y, Mizushima N, Ueno T, Yamamoto A, Kirisako T, Noda T, Kominami E, Ohsumi Y, Yoshimori T (2000) LC3, a mammalian homologue of yeast Apg8p, is localized in autophagosome membranes after processing. EMBO J 19: 5720–5728 · DOI · Paper page
  20. Keren‐Kaplan T, Saric A, Ghosh S, Williamson CD, Jia R, Li Y, Bonifacino JS (2022) RUFY3 and RUFY4 are ARL8 effectors that promote coupling of endolysosomes to dynein‐dynactin. Nat Commun 13: 1506 · DOI · Paper page
  21. Kesisova IA, Robinson BP, Spiliotis ET (2021) A septin GTPase scaffold of dynein‐dynactin motors triggers retrograde lysosome transport. J Cell Biol 220: e202005219 · DOI
  22. Kimura S, Noda T, Yoshimori T (2008) Dynein‐dependent movement of autophagosomes mediates efficient encounters with lysosomes. Cell Struct Funct 33: 109–122 · DOI · Paper page
  23. Klionsky DJ, Petroni G, Amaravadi RK, Baehrecke EH, Ballabio A, Boya P, Bravo‐San Pedro JM, Cadwell K, Cecconi F, Choi AMK et al (2021) Autophagy in major human diseases. EMBO J 40: e108863 · DOI · Paper page
  24. Korolchuk VI, Saiki S, Lichtenberg M, Siddiqi FH, Roberts EA, Imarisio S, Jahreiss L, Sarkar S, Futter M, Menzies FM et al (2011) Lysosomal positioning coordinates cellular nutrient responses. Nat Cell Biol 13: 453–460 · DOI · Paper page
  25. Kumar G, Chawla P, Dhiman N, Chadha S, Sharma S, Sethi K, Sharma M, Tuli A (2022) RUFY3 links Arl8b and JIP4‐dynein complex to regulate lysosome size and positioning. Nat Commun 13: 1540 · DOI · Paper page
  26. Liu‐Snyder P, McNally H, Shi R, Borgens RB (2006) Acrolein‐mediated mechanisms of neuronal death. J Neurosci Res 84: 209–218 · DOI
  27. Luo S, Jiang L, Li Q, Sun X, Liu T, Pei F, Zhang T, Liu T, Dong L, Liu X et al (2018) Acrolein‐induced autophagy‐dependent apoptosis via activation of the lysosomal‐mitochondrial pathway in EAhy926 cells. Toxicol In Vitro 52: 146–153 · DOI
  28. Macpherson IR, Rainero E, Mitchell LE, van den Berghe PV, Speirs C, Dozynkiewicz MA, Chaudhary S, Kalna G, Edwards J, Timpson P et al (2014) CLIC3 controls recycling of late endosomal MT1‐MMP and dictates invasion and metastasis in breast cancer. J Cell Sci 127: 3893–3901
  29. Marchesin V, Castro‐Castro A, Lodillinsky C, Castagnino A, Cyrta J, Bonsang‐Kitzis H, Fuhrmann L, Irondelle M, Infante E, Montagnac G et al (2015) ARF6‐JIP3/4 regulate endosomal tubules for MT1‐MMP exocytosis in cancer invasion. J Cell Biol 211: 339–358 · DOI · Paper page
  30. Martel J, Ojcius DM, Ko YF, Ke PY, Wu CY, Peng HH, Young JD (2019) Hormetic effects of phytochemicals on health and longevity. Trends Endocrinol Metab 30: 335–346 · DOI
  31. Minois N, Rockenfeller P, Smith TK, Carmona‐Gutierrez D (2014) Spermidine feeding decreases age‐related locomotor activity loss and induces changes in lipid composition. PLoS ONE 9: e102435 · DOI
  32. Mizushima N, Levine B (2020) Autophagy in human diseases. N Engl J Med 383: 1564–1576 · DOI · Paper page
  33. Nishimura Y, Itoh K, Yoshioka K, Tokuda K, Himeno M (2003) Overexpression of ROCK in human breast cancer cells: Evidence that ROCK activity mediates intracellular membrane traffic of lysosomes. Pathol Oncol Res 9: 83–95 · DOI · Paper page
  34. Nojima H, Tokunaga C, Eguchi S, Oshiro N, Hidayat S, Yoshino K, Hara K, Tanaka N, Avruch J, Yonezawa K (2003) The mammalian target of rapamycin (mTOR) partner, raptor, binds the mTOR substrates p70 S6 kinase and 4E‐BP1 through their TOR signaling (TOS) motif. J Biol Chem 278: 15461–15464 · DOI
  35. Paik MJ, Ahn YH, Lee PH, Kang H, Park CB, Choi S, Lee G (2010) Polyamine patterns in the cerebrospinal fluid of patients with Parkinson's disease and multiple system atrophy. Clin Chim Acta 411: 1532–1535 · DOI
  36. Park J, Muratori B, Shi R (2014) Acrolein as a novel therapeutic target for motor and sensory deficits in spinal cord injury. Neural Regen Res 9: 677–683 · DOI
  37. Raju SV, Jackson PL, Courville CA, McNicholas CM, Sloane PA, Sabbatini G, Tidwell S, Tang LP, Liu B, Fortenberry JA et al (2013) Cigarette smoke induces systemic defects in cystic fibrosis transmembrane conductance regulator function. Am J Respir Crit Care Med 188: 1321–1330 · DOI
  38. Rocha N, Kuijl C, van der Kant R, Janssen L, Houben D, Janssen H, Zwart W, Neefjes J (2009) Cholesterol sensor ORP1L contacts the ER protein VAP to control Rab7‐RILP‐p150 glued and late endosome positioning. J Cell Biol 185: 1209–1225 · DOI
  39. Roede JR, Uppal K, Park Y, Lee K, Tran V, Walker D, Strobel FH, Rhodes SL, Ritz B, Jones DP (2013) Serum metabolomics of slow vs. rapid motor progression Parkinson's disease: a pilot study. PLoS ONE 8: e77629 · DOI
  40. Saiki S, Hatano T, Fujimaki M, Ishikawa KI, Mori A, Oji Y, Okuzumi A, Fukuhara T, Koinuma T, Imamichi Y et al (2017) Decreased long‐chain acylcarnitines from insufficient beta‐oxidation as potential early diagnostic markers for Parkinson's disease. Sci Rep 7: 7328 · DOI
  41. Saiki S, Sasazawa Y, Fujimaki M, Kamagata K, Kaga N, Taka H, Li Y, Souma S, Hatano T, Imamichi Y et al (2019) A metabolic profile of polyamines in parkinson disease: a promising biomarker. Ann Neurol 86: 251–263 · DOI
  42. Saiki S, Sasazawa Y, Imamichi Y, Kawajiri S, Fujimaki T, Tanida I, Kobayashi H, Sato F, Sato S, Ishikawa K et al (2011) Caffeine induces apoptosis by enhancement of autophagy via PI3K/Akt/mTOR/p70S6K inhibition. Autophagy 7: 176–187 · DOI
  43. Sasazawa Y, Kanagaki S, Tashiro E, Nogawa T, Muroi M, Kondoh Y, Osada H, Imoto M (2012) Xanthohumol impairs autophagosome maturation through direct inhibition of valosin‐containing protein. ACS Chem Biol 7: 892–900 · DOI
  44. Sasazawa Y, Sato N, Umezawa K, Simizu S (2015) Conophylline protects cells in cellular models of neurodegenerative diseases by inducing mammalian target of rapamycin (mTOR)‐independent autophagy. J Biol Chem 290: 6168–6178 · DOI
  45. Schindelin J, Arganda‐Carreras I, Frise E, Kaynig V, Longair M, Pietzsch T, Preibisch S, Rueden C, Saalfeld S, Schmid B et al (2012) Fiji: an open‐source platform for biological‐image analysis. Nat Methods 9: 676–682 · DOI · Paper page
  46. Stevens JF, Maier CS (2008) Acrolein: sources, metabolism, and biomolecular interactions relevant to human health and disease. Mol Nutr Food Res 52: 7–25 · DOI
  47. Uchida K, Kanematsu M, Sakai K, Matsuda T, Hattori N, Mizuno Y, Suzuki D, Miyata T, Noguchi N, Niki E et al (1998) Protein‐bound acrolein: potential markers for oxidative stress. Proc Natl Acad Sci USA 95: 4882–4887 · DOI
  48. Vergarajauregui S, Martina JA, Puertollano R (2009) Identification of the penta‐EF‐hand protein ALG‐2 as a Ca2+−dependent interactor of mucolipin‐1. J Biol Chem 284: 36357–36366 · DOI · Paper page
  49. Wang YT, Lin HC, Zhao WZ, Huang HJ, Lo YL, Wang HT, Lin AM (2017) Acrolein acts as a neurotoxin in the nigrostriatal dopaminergic system of rat: involvement of alpha‐synuclein aggregation and programmed cell death. Sci Rep 7: 45741
  50. Yamasaki A, Tani K, Yamamoto A, Kitamura N, Komada M (2006) The Ca2+−binding protein ALG‐2 is recruited to endoplasmic reticulum exit sites by Sec31A and stabilizes the localization of Sec31A. Mol Biol Cell 17: 4876–4887 · DOI
  51. Yuzaki M (2010) Snapin snaps into the dynein complex for late endosome‐lysosome trafficking and autophagy. Neuron 68: 4–6 · DOI

Cited by

Sorted by citations

Metadata

Authors
Sasazawa, Y., Souma, S., Furuya, N., Miura, Y., Kazuno, S., Kakuta, S., Suzuki, A., Hashimoto, R., Hirawake‐Mogi, H., Date, Y., Imoto, M., Ueno, T., Kataura, T., Korolchuk, V. I., Tsunemi, T., Hattori, N., & Saiki, S.
Venue
The EMBO Journal
Published
2022-10-11
Volume
41
Issue
22
ISSN
  • 0261-4189
  • 1460-2075
Cited by
31
References
9
Language
en
Funders
  • Ministry of Education, Culture, Sports, Science and Technology (MEXT) ¦ Japan Society for the Promotion of Science (18KT0027, 18KK0242, 18H02744, 22H02986, 21K07425, 20H05340, 18K15464, 16H06276)
  • Naito Foundation

About these checks

Registry, retraction, Cites and statistics results are computed, not judged, with one exception: a printed reference that no index lists is read once by a model before it counts as a citation error. Claims are extracted by a model and kept only when their quote appears verbatim in the text; each cited source is then checked, with a model’s help, for whether it says what the claim relies on. Those verdicts can be wrong — read the claim’s quote and the cited source before relying on one.

Statistics and arithmetic are recomputed, not judged.

Confidence bands are shown only for fields calibrated on our annotated test set. None is calibrated yet, so no band is shown.

What counts as a claim ›How we measure confidence ›How we check this ›

Are you an author, or do you see a problem with this page? Request a review