

The DOI matches its Crossref record; 11 of the 11 references it cites were found in a registry or an index.
REST suppression mediates neural conversion of adult human fibroblasts via microRNA‐dependent and ‐independent pathways
Overview
The claims and statistics of this paper haven’t been checked yet.
Run the check — free, no account needed. It reads the open-access text and checks the sources it cites.
Integrity signals
Registry
Cites
Statistics
Figures
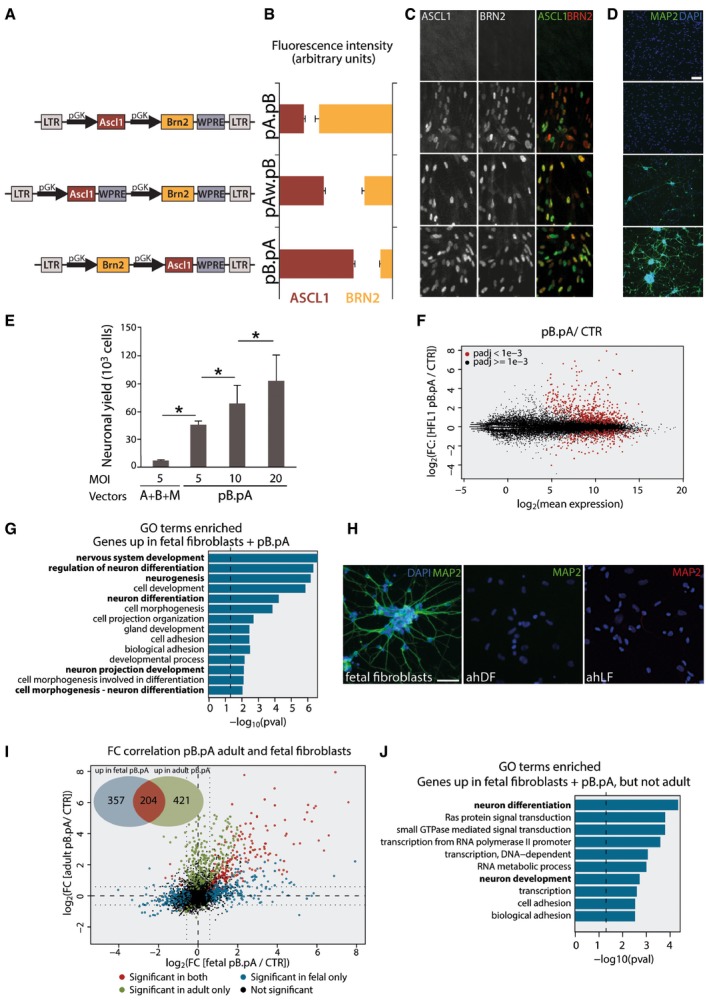
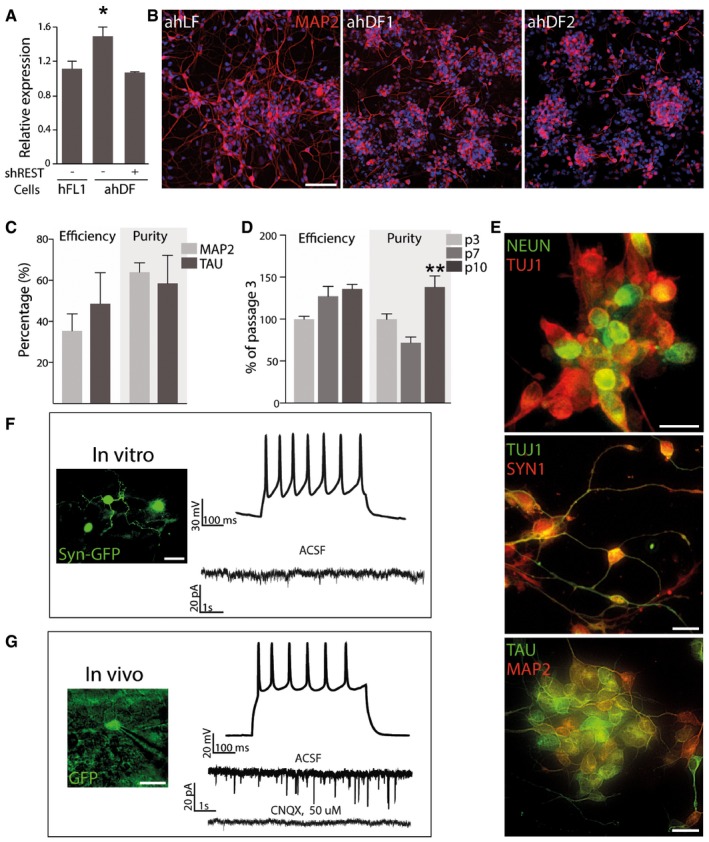
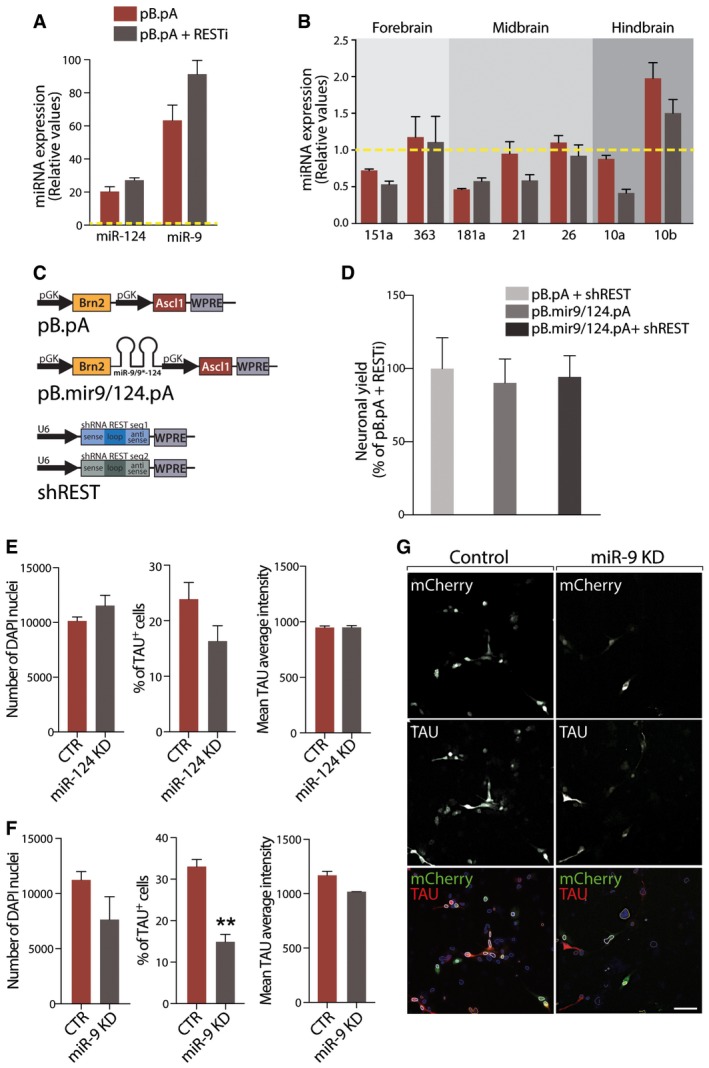
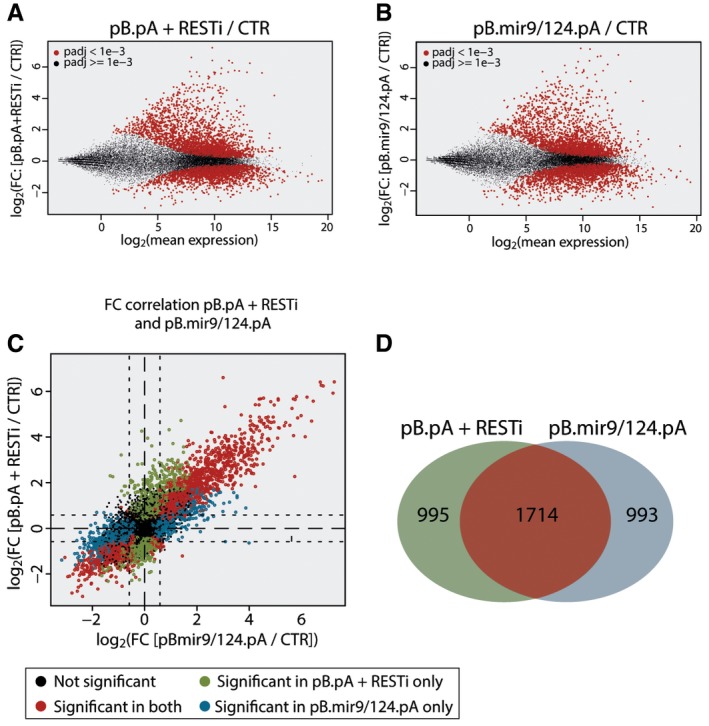
Verification
Claims the paper makes
The claims and statistics of this paper haven’t been checked yet.
Run the check — free, no account needed. It reads the open-access text and checks the sources it cites.
Claims other papers make about this one
Each is checked against this paper’s own text: does it say what the citing paper says it does?
In the citing paper
“Drouin-Ouellet et al. [97] successfully converted human dermal fibroblasts from patients with AD, Parkinson’s disease and Huntington’s disease into neurons by inhibiting RE1-silencing transcription factor expression.”
From MicroRNAs in Extracellular Vesicles of Alzheimer’s Disease (2023) · cites this paper as [97]
In the citing paper
“The conversion was partially regulated by miR-9-5p and miR-124 [97].”
From MicroRNAs in Extracellular Vesicles of Alzheimer’s Disease (2023) · cites this paper as [97]
Self-check
Percentages, sums and reported differences re-computed from the paper’s own numbers.
The self-check needs the paper’s full text.
Citations
Cites
Direct conversion of fibroblasts to functional neurons by defined factors
Vierbuchen, T., Ostermeier, A., Pang, Z. P., Kokubu, Y., Südhof, T. C., & Wernig, M. (2010) · Nature · doi:10.1038/nature08797 · Cited by 3,017
Genome-scale DNA methylation maps of pluripotent and differentiated cells
Meissner, A., Mikkelsen, T. S., Gu, H., Wernig, M., Hanna, J., Sivachenko, A., Zhang, X., Bernstein, B. E., Nusbaum, C., Jaffe, D. B., et al. (2008) · Nature · doi:10.1038/nature07107 · Cited by 2,536
Multiply attenuated lentiviral vector achieves efficient gene delivery in vivo
Zufferey, R., Nagy, D., Mandel, R. J., Naldini, L., & Trono, D. (1997) · Nature Biotechnology · doi:10.1038/nbt0997-871 · Cited by 1,977
Induced pluripotent stem cells from a spinal muscular atrophy patient
Ebert, A. D., Yu, J., Rose, F. F., Mattis, V. B., Lorson, C. L., Thomson, J. A., & Svendsen, C. N. (2009) · Nature · doi:10.1038/nature07677 · Cited by 1,441
Human iPSC-based modeling of late-onset disease via progerin-induced aging
Miller, J. D., Ganat, Y. M., Kishinevsky, S., Bowman, R. L., Liu, B., Tu, E. Y., Mandal, P. K., Vera, E., Shim, J.-W., Kriks, S., et al. (2013) · Cell stem cell · doi:10.1016/j.stem.2013.11.006 · Cited by 777
Mertens, J., Paquola, A. C. M., Ku, M., Hatch, E., Böhnke, L., Ladjevardi, S., McGrath, S., Campbell, B., Lee, H., Herdy, J. R., et al. (2015) · Cell Stem Cell · doi:10.1016/j.stem.2015.09.001 · Cited by 765
Kondo, T., Asai, M., Tsukita, K., Kutoku, Y., Ohsawa, Y., Sunada, Y., Imamura, K., Egawa, N., Yahata, N., Okita, K., et al. (2013) · Cell Stem Cell · doi:10.1016/j.stem.2013.01.009 · Cited by 741
Rejuvenating senescent and centenarian human cells by reprogramming through the pluripotent state
Lapasset, L., Milhavet, O., Prieur, A., Besnard, E., Babled, A., Aït-Hamou, N., Leschik, J., Pellestor, F., Ramirez, J.-M., De Vos, J., et al. (2011) · Genes & Development · doi:10.1101/gad.173922.111 · Cited by 570 · cited 1×
“…2009; Lee et al , 2009; Lafaille et al , 2012), a number of studies show that reprogramming into pluripotency resets the age of the cells such that the resulting neurons are very young (Maherali et al , 2007; Meissner et al , 2008; Lapasset et al , 2011; Miller et al , 2013; Mertens et al , 2015).”
Direct Conversion of Fibroblasts to Neurons by Reprogramming PTB-Regulated MicroRNA Circuits
Xue, Y., Ouyang, K., Huang, J., Zhou, Y., Ouyang, H., Li, H., Wang, G., Wu, Q., Wei, C., Bi, Y., et al. (2013) · Cell · doi:10.1016/j.cell.2012.11.045 · Cited by 562
Generation of Human Striatal Neurons by MicroRNA-Dependent Direct Conversion of Fibroblasts
Victor, M. B., Richner, M., Hermanstyne, T. O., Ransdell, J. L., Sobieski, C., Deng, P.-Y., Klyachko, V. A., Nerbonne, J. M., & Yoo, A. S. (2014) · Neuron · doi:10.1016/j.neuron.2014.10.016 · Cited by 295
Research works printed but not linked: 34
- Adlakha YK, Seth P (2017) The expanding horizon of MicroRNAs in cellular reprogramming. Prog Neurobiol 148: 21–39 · DOI
- Ambasudhan R, Talantova M, Coleman R, Yuan X, Zhu S, Lipton SA, Ding S (2011) Direct reprogramming of adult human fibroblasts to functional neurons under defined conditions. Cell Stem Cell 9: 113–118 · DOI
- Ballas N, Grunseich C, Lu DD, Speh JC, Mandel G (2005) REST and its corepressors mediate plasticity of neuronal gene chromatin throughout neurogenesis. Cell 121: 645–657 · DOI · Paper page
- Brown BD, Gentner B, Cantore A, Colleoni S, Amendola M, Zingale A, Baccarini A, Lazzari G, Galli C, Naldini L (2007) Endogenous microRNA can be broadly exploited to regulate transgene expression according to tissue, lineage and differentiation state. Nat Biotechnol 25: 1457–1467 · DOI
- Caiazzo M, Dell'Anno MT, Dvoretskova E, Lazarevic D, Taverna S, Leo D, Sotnikova TD, Menegon A, Roncaglia P, Colciago G et al (2011) Direct generation of functional dopaminergic neurons from mouse and human fibroblasts. Nature 476: 224–227 · DOI
- Carey BW, Markoulaki S, Hanna JH, Faddah DA, Buganim Y, Kim J, Ganz K, Steine EJ, Cassady JP, Creyghton MP et al (2011) Reprogramming factor stoichiometry influences the epigenetic state and biological properties of induced pluripotent stem cells. Cell Stem Cell 9: 588–598 · DOI
- Conaco C, Otto S, Han JJ, Mandel G (2006) Reciprocal actions of REST and a microRNA promote neuronal identity. Proc Natl Acad Sci USA 103: 2422–2427 · DOI · Paper page
- Dobin A, Davis CA, Schlesinger F, Drenkow J, Zaleski C, Jha S, Batut P, Chaisson M, Gingeras TR (2013) STAR: ultrafast universal RNA‐seq aligner. Bioinformatics 29: 15–21 · DOI · Paper page
- Fishman VS, Shnayder TA, Orishchenko KE, Bader M, Alenina N, Serov OL (2015) Cell divisions are not essential for the direct conversion of fibroblasts into neuronal cells. Cell Cycle 14: 1188–1196 · DOI
- Gentner B, Schira G, Giustacchini A, Amendola M, Brown BD, Ponzoni M, Naldini L (2009) Stable knockdown of microRNA in vivo by lentiviral vectors. Nat Methods 6: 63–66 · DOI
- Georgievska B, Jakobsson J, Persson E, Ericson C, Kirik D, Lundberg C (2004) Regulated delivery of glial cell line‐derived neurotrophic factor into rat striatum, using a tetracycline‐dependent lentiviral vector. Hum Gene Ther 15: 934–944 · DOI
- Hu W, Qiu B, Guan W, Wang Q, Wang M, Li W, Gao L, Shen L, Huang Y, Xie G et al (2015) Direct conversion of normal and Alzheimer's disease human fibroblasts into neuronal cells by small molecules. Cell Stem Cell 17: 204–212 · DOI · Paper page
- Huang DW, Sherman BT, Lempicki RA (2009) Systematic and integrative analysis of large gene lists using DAVID bioinformatics resources. Nat Protoc 4: 44–57 · DOI · Paper page
- Iovino M, Pfisterer U, Holton JL, Lashley T, Swingler RJ, Calo L, Treacy R, Revesz T, Parmar M, Goedert M et al (2014) The novel MAPT mutation K298E: mechanisms of mutant tau toxicity, brain pathology and tau expression in induced fibroblast‐derived neurons. Acta Neuropathol 127: 283–295 · DOI
- Jönsson ME, Nelander Wahlestedt J, Åkerblom M, Kirkeby A, Malmevik J, Brattaas PL, Jakobsson J, Parmar M (2015) Comprehensive analysis of microRNA expression in regionalized human neural progenitor cells reveals microRNA‐10 as a caudalizing factor. Development 142: 3166–3177 · DOI
- Lafaille FG, Pessach IM, Zhang SY, Ciancanelli MJ, Herman M, Abhyankar A, Ying SW, Keros S, Goldstein PA, Mostoslavsky G et al (2012) Impaired intrinsic immunity to HSV‐1 in human iPSC‐derived TLR3‐deficient CNS cells. Nature 491: 769–773 · DOI · Paper page
- Lee G, Papapetrou EP, Kim H, Chambers SM, Tomishima MJ, Fasano CA, Ganat YM, Menon J, Shimizu F, Viale A et al (2009) Modelling pathogenesis and treatment of familial dysautonomia using patient‐specific iPSCs. Nature 461: 402–406 · DOI
- Liao Y, Smyth GK, Shi W (2014) featureCounts: an efficient general purpose program for assigning sequence reads to genomic features. Bioinformatics 30: 923–930 · DOI · Paper page
- Liu ML, Zang T, Zou Y, Chang JC, Gibson JR, Huber KM, Zhang CL (2013) Small molecules enable neurogenin 2 to efficiently convert human fibroblasts into cholinergic neurons. Nat Commun 4: 2183 · DOI · Paper page
- Love MI, Huber W, Anders S (2014) Moderated estimation of fold change and dispersion for RNA‐seq data with DESeq2. Genome Biol 15: 550 · DOI · Paper page
- Maherali N, Sridharan R, Xie W, Utikal J, Eminli S, Arnold K, Stadtfeld M, Yachechko R, Tchieu J, Jaenisch R et al (2007) Directly reprogrammed fibroblasts show global epigenetic remodeling and widespread tissue contribution. Cell Stem Cell 1: 55–70 · DOI · Paper page
- Masserdotti G, Gillotin S, Sutor B, Drechsel D, Irmler M, Jørgensen HF, Sass S, Theis FJ, Beckers J, Berninger B et al (2015) Transcriptional mechanisms of proneural factors and REST in regulating neuronal reprogramming of astrocytes. Cell Stem Cell 17: 74–88 · DOI
- Mertens J, Marchetto MC, Bardy C, Gage FH (2016) Evaluating cell reprogramming, differentiation and conversion technologies in neuroscience. Nat Rev Neurosci 17: 424–437 · DOI
- Nityanandam A, Baldwin KK (2015) Advances in reprogramming‐based study of neurologic disorders. Stem Cells Dev 24: 1265–1283 · DOI
- Pang ZP, Yang N, Vierbuchen T, Ostermeier A, Fuentes DR, Yang TQ, Citri A, Sebastiano V, Marro S, Südhof TC et al (2011) Induction of human neuronal cells by defined transcription factors. Nature 476: 220–223 · DOI
- Pfisterer U, Kirkeby A, Torper O, Wood J, Nelander J, Dufour A, Bjorklund A, Lindvall O, Jakobsson J, Parmar M (2011a) Direct conversion of human fibroblasts to dopaminergic neurons. Proc Natl Acad Sci USA 108: 10343–10348 · DOI
- Pfisterer U, Wood J, Nihlberg K, Hallgren O, Bjermer L, Westergren‐Thorsson G, Lindvall O, Parmar M (2011b) Efficient induction of functional neurons from adult human fibroblasts. Cell Cycle 10: 3311–3316 · DOI
- Price JD, Park KY, Chen J, Salinas RD, Cho MJ, Kriegstein AR, Lim DA (2014) The Ink4a/Arf locus is a barrier to direct neuronal transdifferentiation. J Neurosci 34: 12560–12567 · DOI
- Stadtfeld M, Maherali N, Borkent M, Hochedlinger K (2010) A reprogrammable mouse strain from gene‐targeted embryonic stem cells. Nat Methods 7: 53–55 · DOI
- Tocchini C, Keusch JJ, Miller SB, Finger S, Gut H, Stadler MB, Ciosk R (2014) The TRIM‐NHL protein LIN‐41 controls the onset of developmental plasticity in Caenorhabditis elegans. PLoS Genet 10: e1004533 · DOI
- Xu Z, Jiang H, Zhong P, Yan Z, Chen S, Feng J (2015) Direct conversion of human fibroblasts to induced serotonergic neurons. Mol Psychiatry 21: 62–70 · DOI
- Xue Y, Qian H, Hu J, Zhou B, Zhou Y, Hu X, Karakhanyan A, Pang Z, Fu XD (2016) Sequential regulatory loops as key gatekeepers for neuronal reprogramming in human cells. Nat Neurosci 19: 807–815 · DOI · Paper page
- Yoo AS, Sun AX, Li L, Shcheglovitov A, Portmann T, Li Y, Lee‐Messer C, Dolmetsch RE, Tsien RW, Crabtree GR (2011) MicroRNA‐mediated conversion of human fibroblasts to neurons. Nature 476: 228–231 · DOI · Paper page
- Young JE, Boulanger‐Weill J, Williams DA, Woodruff G, Buen F, Revilla AC, Herrera C, Israel MA, Yuan SH, Edland SD et al (2015) Elucidating molecular phenotypes caused by the SORL1 Alzheimer's disease genetic risk factor using human induced pluripotent stem cells. Cell Stem Cell 16: 373–385 · DOI
Cited by
Sorted by citations
New approaches for brain repair-from rescue to reprogramming
Barker, R. A., Götz, M., & Parmar, M. (2018) · Nature · doi:10.1038/s41586-018-0087-1 · Cited by 214
Self-citationMicroRNA‑124: an emerging therapeutic target in central nervous system disorders
Zhang, W.-H., Jiang, L., Li, M., & Liu, J. (2023) · Experimental Brain Research · doi:10.1007/s00221-022-06524-2 · Cited by 43
MicroRNAs in Extracellular Vesicles of Alzheimer’s Disease
Li, W., & Zheng, Y. (2023) · Cells · doi:10.3390/cells12101378 · Cited by 43
Metadata
- Authors
- Drouin‐Ouellet, J., Lau, S., Brattås, P. L., Rylander Ottosson, D., Pircs, K., Grassi, D. A., Collins, L. M., Vuono, R., Andersson Sjöland, A., Westergren‐Thorsson, G., Graff, C., Minthon, L., Toresson, H., Barker, R. A., Jakobsson, J., & Parmar, M.
- Venue
- EMBO Molecular Medicine
- Published
- 2017-06-23
- Volume
- 9
- Issue
- 8
- Pages
- 1117-1131
- ISSN
- 1757-4676
- 1757-4684
- PMC
- PMC5538296
- Cited by
- 110
- References
- 11
- Language
- en
- Funders
- New York Stem Cell Foundation
- H2020 European Research Council (602278, 30971, FP/2007‐2013)
- Vetenskapsrådet (521‐2012‐5624, 2016‐00873, 70862601)
- Parkinsonfonden (874/16)
- Canadian Institutes of Health Research (358492)
- Lunds Universitet
- Stiftelsen för Strategisk Forskning (FFL12‐0074)
- National Institute for Health Research
About these checks
Registry, retraction, Cites and statistics results are computed, not judged, with one exception: a printed reference that no index lists is read once by a model before it counts as a citation error. Claims are extracted by a model and kept only when their quote appears verbatim in the text; each cited source is then checked, with a model’s help, for whether it says what the claim relies on. Those verdicts can be wrong — read the claim’s quote and the cited source before relying on one.
Statistics and arithmetic are recomputed, not judged.
Confidence bands are shown only for fields calibrated on our annotated test set. None is calibrated yet, so no band is shown.
What counts as a claim ›How we measure confidence ›How we check this ›
Are you an author, or do you see a problem with this page? Request a review
