Cited by 101Genetics and Neurodevelopmental DisordersNeuroscience and Neuropharmacology ResearchNeurogenesis and neuroplasticity mechanisms

The DOI matches its Crossref record; 66 of the 67 references it cites were found in a registry or an index.

Pharmacological reversal of synaptic and network pathology in human MECP2‐KO neurons and cortical organoids

Open access

Abstract

Duplication or deficiency of the X‐linked MECP2 gene reliably produces profound neurodevelopmental impairment. MECP2 mutations are almost universally responsible for Rett syndrome (RTT), and particular mutations and cellular mosaicism of MECP2 may underlie the spectrum of RTT symptomatic severity. No clinically approved treatments for RTT are currently available, but human pluripotent stem cell technology offers a platform to identify neuropathology and test candidate therapeutics. Using a strategic series of increasingly complex human stem cell‐derived technologies, including human neurons, MECP2 ‐mosaic neurospheres to model RTT female brain mosaicism, and cortical organoids, we identified synaptic dysregulation downstream from knockout of MECP2 and screened select pharmacological compounds for their ability to treat this dysfunction. Two lead compounds, Nefiracetam and PHA 543613, specifically reversed MECP2‐ knockout cytologic neuropathology. The capacity of these compounds to reverse neuropathologic phenotypes and networks in human models supports clinical studies for neurodevelopmental disorders in which MeCP2 deficiency is the predominant etiology.

Overview

The claims and statistics of this paper haven’t been checked yet.

Run the check — free, no account needed. It reads the open-access text and checks the sources it cites.

A few free checks a day · papers already verified open instantly · results are public

Integrity signals

Registry

Crossref · 10.15252/emmm.202012523

Cites

66 of 66 references verified0 citation errors · 0 not checkable

Statistics

Figures

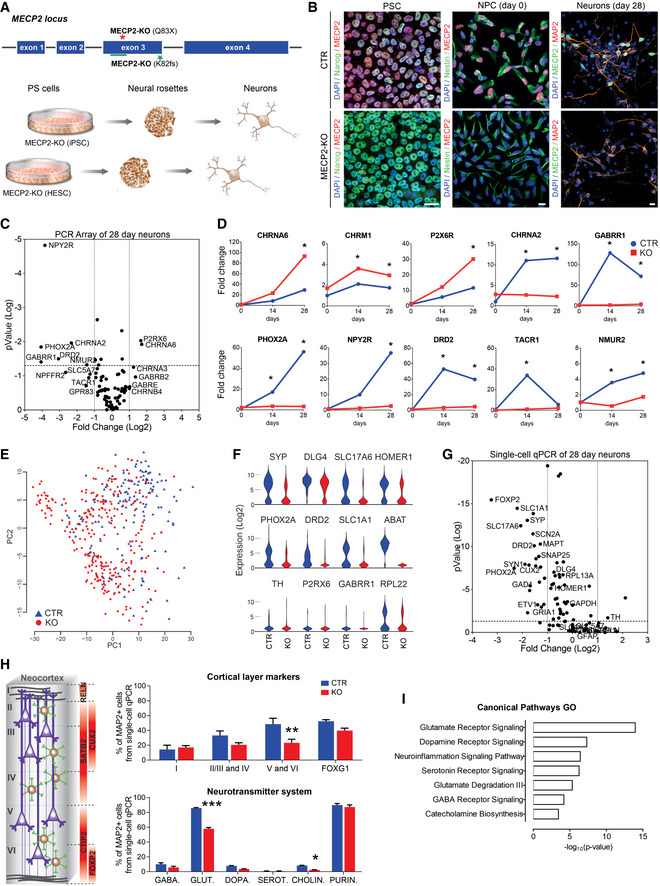
Figure 1 Human MECP2‐KO neurons exhibit alterations in synapse‐relevant genes and pathways Pluripotent stem cells (PSCs) with one of two distinct exonic loss‐of‐function mutations (Q83X nonsense or K82 frameshift (K82fs)) at the MECP2 locus were generated and differentiated into neurons via a neural progenitor cell (NPC) intermediate.Immunofluorescent staining confirmed the absence of MeCP2 in MECP2‐KO PSCs, NPCs, and neurons. Scale bar = 10 µm.RT–qPCR array revealed differential gene expression between control and MECP2‐KO 28‐day neurons. The P values are calculated based on a Student’s t‐test of the replicate 2−ΔΔ C t values for each gene in the control group and KO groups (WT83/Q83X cell lines were used; N = 3 clones from each genotype).Overtime quantitative gene expression profile of many of the involved genes relevant to synaptic function (days 14 and 28 post‐differentiation; normalized by control NPC expression).Single‐cell RT–qPCR analysis distinguished populations of control and KO 28‐day neurons. Principal component analysis (PCA) of 441 cells projected onto the first two components. Overlaid populations of WT83/Q83X and WT82/K82fs neurons are shown.Violin plots of selected genes showing the comparison between control and MECP2‐KO neurons from the single‐cell analyses (log2(expression) values) that overlapped with the results obtained via RT–PCR array.Volcano plot illustrates differences in expression patterns of target genes of neurons from the qPCR single‐cell analyses. The dotted lines represent differentially expressed genes between the groups at P < 0.05 (unpaired Student’s t‐test).Left: Schematic of laminar cortical markers. Right: Top: Quantitation of laminar cell markers based on the single‐cell RT–qPCR analysis (two‐way analysis of variance (ANOVA), N = 3 replicates per genotype, F 3,24 = 3.31, *P = 0.04, with difference in the proportion of cortical layers V and VI, 95% confidence interval (CI) [8.31, 42.41]); Bottom: altered proportions of neurotransmitter markers (two‐way ANOVA, N = 3 replicates per genotype, F 5,24 = 27.33, ***P < 0.0001, with differences in the proportions of glutamatergic, 95% CI [22.33, 33.60], and cholinergic, 95% CI [0.166, 11.43], neurons).Gene ontology (GO) analysis of targeted genes relevant to synaptic function displaying the differences between MECP2‐KO and control neurons. For the full list of markers used see Dataset EV1. Data information: Note that asterisks signify statistically significant difference from MECP2‐KO. Data are presented as mean ± standard error of the mean (s.e.m.).
Figure 1 Human MECP2‐KO neurons exhibit alterations in synapse‐relevant genes and pathways Pluripotent stem cells (PSCs) with one of two distinct exonic loss‐of‐function mutations (Q83X nonsense or K82 frameshift (K82fs)) at the MECP2 locus were generated and differentiated into neurons via a neural progenitor cell (NPC) intermediate.Immunofluorescent staining confirmed the absence of MeCP2 in MECP2‐KO PSCs, NPCs, and neurons. Scale bar = 10 µm.RT–qPCR array revealed differential gene expression between control and MECP2‐KO 28‐day neurons. The P values are calculated based on a Student’s t‐test of the replicate 2−ΔΔ C t values for each gene in the control group and KO groups (WT83/Q83X cell lines were used; N = 3 clones from each genotype).Overtime quantitative gene expression profile of many of the involved genes relevant to synaptic function (days 14 and 28 post‐differentiation; normalized by control NPC expression).Single‐cell RT–qPCR analysis distinguished populations of control and KO 28‐day neurons. Principal component analysis (PCA) of 441 cells projected onto the first two components. Overlaid populations of WT83/Q83X and WT82/K82fs neurons are shown.Violin plots of selected genes showing the comparison between control and MECP2‐KO neurons from the single‐cell analyses (log2(expression) values) that overlapped with the results obtained via RT–PCR array.Volcano plot illustrates differences in expression patterns of target genes of neurons from the qPCR single‐cell analyses. The dotted lines represent differentially expressed genes between the groups at P < 0.05 (unpaired Student’s t‐test).Left: Schematic of laminar cortical markers. Right: Top: Quantitation of laminar cell markers based on the single‐cell RT–qPCR analysis (two‐way analysis of variance (ANOVA), N = 3 replicates per genotype, F 3,24 = 3.31, *P = 0.04, with difference in the proportion of cortical layers V and VI, 95% confidence interval (CI) [8.31, 42.41]); Bottom: altered proportions of neurotransmitter markers (two‐way ANOVA, N = 3 replicates per genotype, F 5,24 = 27.33, ***P < 0.0001, with differences in the proportions of glutamatergic, 95% CI [22.33, 33.60], and cholinergic, 95% CI [0.166, 11.43], neurons).Gene ontology (GO) analysis of targeted genes relevant to synaptic function displaying the differences between MECP2‐KO and control neurons. For the full list of markers used see Dataset EV1. Data information: Note that asterisks signify statistically significant difference from MECP2‐KO. Data are presented as mean ± standard error of the mean (s.e.m.).CC BY · PubMed Central
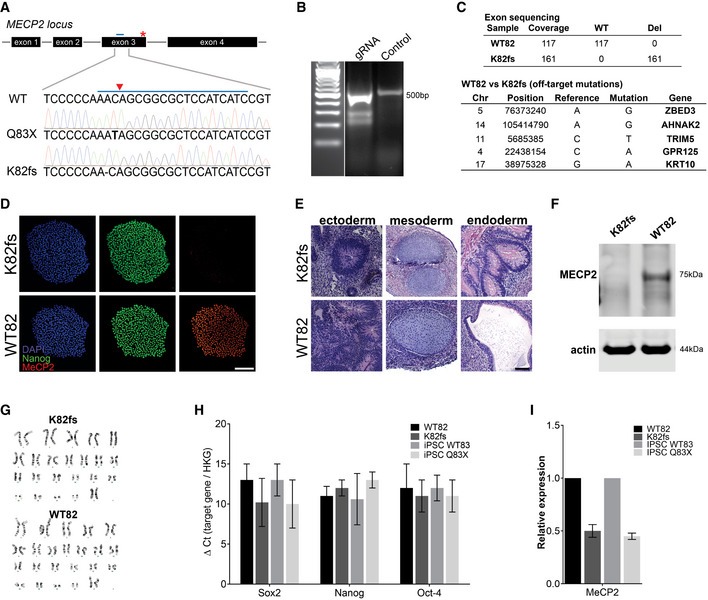
Figure EV1 Generation of MECP2‐KO pluripotent stem cells AMutations resulting in loss of functional MeCP2 protein shown by Sanger sequencing. CRISPR guide RNA is depicted as a blue bar over WT sequence and the cut site as a red triangle.BCRISPR guide RNA to generate K82 frameshift mutation.CIdentification of off‐target mutations by exome sequencing.D–I MECP2‐KO was successfully generated and did not affect pluripotency, as confirmed by immunochemistry (D), teratoma assay (E), Western blot (F), karyotype (G), and RT–qPCR (H, I). Experiments were performed in triplicate; data are presented as mean ± s.e.m. Scale bar = 200 µm.
Figure EV1 Generation of MECP2‐KO pluripotent stem cells AMutations resulting in loss of functional MeCP2 protein shown by Sanger sequencing. CRISPR guide RNA is depicted as a blue bar over WT sequence and the cut site as a red triangle.BCRISPR guide RNA to generate K82 frameshift mutation.CIdentification of off‐target mutations by exome sequencing.D–I MECP2‐KO was successfully generated and did not affect pluripotency, as confirmed by immunochemistry (D), teratoma assay (E), Western blot (F), karyotype (G), and RT–qPCR (H, I). Experiments were performed in triplicate; data are presented as mean ± s.e.m. Scale bar = 200 µm.CC BY · PubMed Central
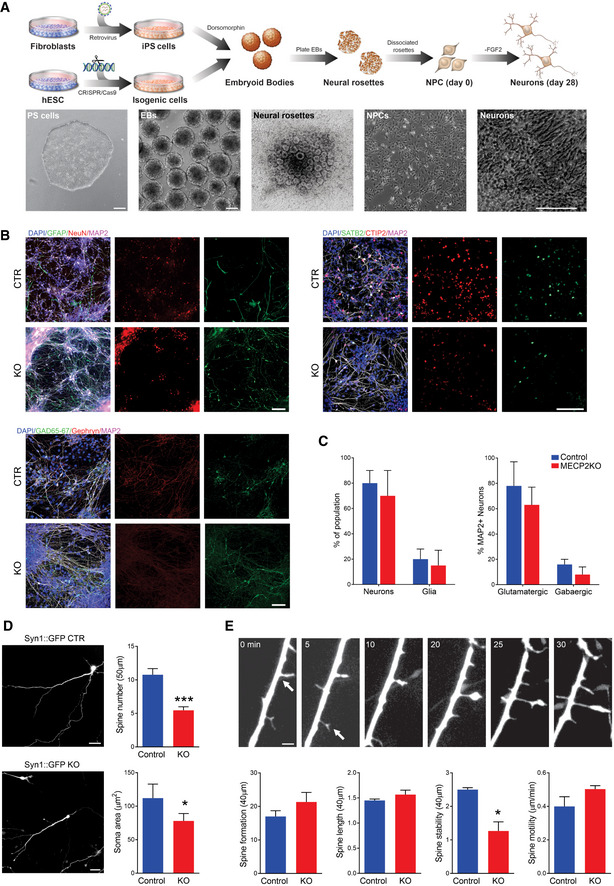
Figure EV2 MECP2‐KO neurons exhibit defects in spine‐like morphology ASchematic showing neuronal differentiation from human PSCs. Scale bar = 200 µm.BNeuronal markers immunostaining of 28‐days MECP2‐KO and control neurons. Scale bar = 50 µm.CNo difference in the resultant proportions of neurons or glia was observed between 28‐days MECP2‐KO and control neural differentiations. Similar results were observed for the proportions of glutamatergic and GABAergic neurons. Experiments were performed in triplicates.D28‐days MECP2‐KO neurons had decreased soma area and spine number (WT83/Q83X cell lines were used; N = 13 neurons per genotype, Student’s t‐test, t 24 = 5.03, ***P < 0.0001). Left: representative images of Syn::GFP + neurons; Right: neuronal feature quantification. Scale bar = 20 µm.EObservation over time showed decreased spine stability (*P < 0.01), but spine motility (P = 0.17), spine formation (P = 0.26), and spine length (P = 0.28) were unchanged in MECP2‐KO neurons. Scale bar = 5 µm. WT83/Q83X cell lines were used, N = 10‐15 neurons/condition. Analyses were two‐sided Student’s t‐tests. Top: representative images of neuronal spine dynamics at 5‐min intervals; arrows denote representative spines. Bottom: quantification of features of neuronal spine dynamics. Data information: Data are presented as mean ± s.e.m.
Figure EV2 MECP2‐KO neurons exhibit defects in spine‐like morphology ASchematic showing neuronal differentiation from human PSCs. Scale bar = 200 µm.BNeuronal markers immunostaining of 28‐days MECP2‐KO and control neurons. Scale bar = 50 µm.CNo difference in the resultant proportions of neurons or glia was observed between 28‐days MECP2‐KO and control neural differentiations. Similar results were observed for the proportions of glutamatergic and GABAergic neurons. Experiments were performed in triplicates.D28‐days MECP2‐KO neurons had decreased soma area and spine number (WT83/Q83X cell lines were used; N = 13 neurons per genotype, Student’s t‐test, t 24 = 5.03, ***P < 0.0001). Left: representative images of Syn::GFP + neurons; Right: neuronal feature quantification. Scale bar = 20 µm.EObservation over time showed decreased spine stability (*P < 0.01), but spine motility (P = 0.17), spine formation (P = 0.26), and spine length (P = 0.28) were unchanged in MECP2‐KO neurons. Scale bar = 5 µm. WT83/Q83X cell lines were used, N = 10‐15 neurons/condition. Analyses were two‐sided Student’s t‐tests. Top: representative images of neuronal spine dynamics at 5‐min intervals; arrows denote representative spines. Bottom: quantification of features of neuronal spine dynamics. Data information: Data are presented as mean ± s.e.m.CC BY · PubMed Central
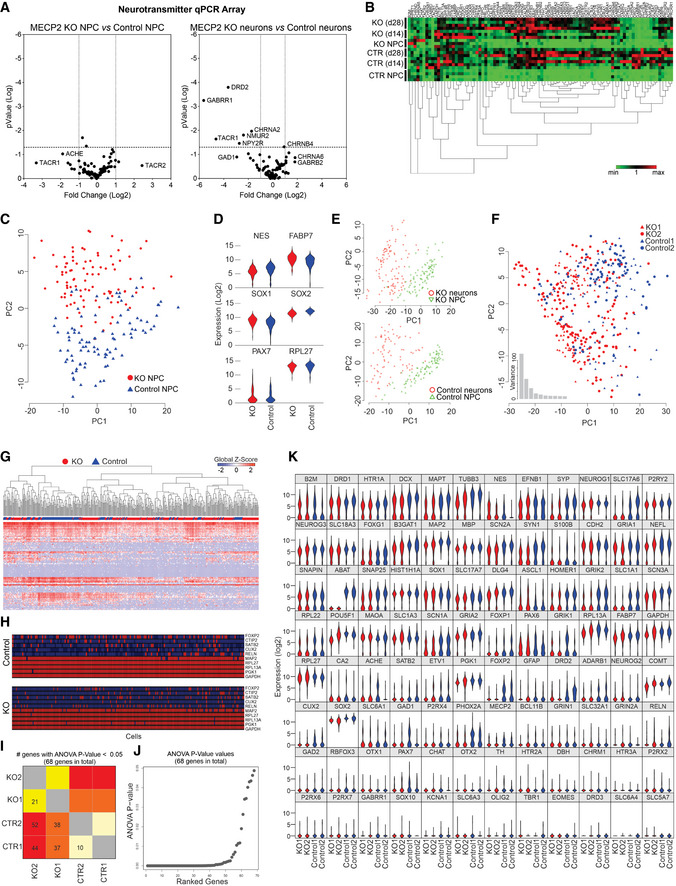
Figure EV3 RT–PCR array and single‐cell RT–qPCR analyses A, BRT–PCR array revealed that differences in genetic expression showed variation between control and MECP2‐KO NPCs and neurons, as depicted on volcano plots (A) and heatmap (B). Each heatmap column is one gene.C–KSingle‐cell RT–qPCR analysis likewise showed differences in gene expression throughout neuronal differentiation due to MECP2‐KO that appear to involve synaptic function. 28‐days WT83/Q83X and WT82/K82fs neurons were used. Principal component analysis (C) of control and MECP2‐KO NPCs (day 0 of same cell lines) and comparative expression of select genes between genotypes (D). Principal component analysis shows differences in expression between NPCs and neurons within each genotype (E) and differences in neuronal gene expression between genotypes (F). Heatmap shows differences in expression of particular genes (columns; G), and schematic denotes single‐cell qPCR of individual markers (H). Number (H) and graphical depiction (J) of differentially expressed genes between genotypes. Table presents differentially expressed genes (K).
Figure EV3 RT–PCR array and single‐cell RT–qPCR analyses A, BRT–PCR array revealed that differences in genetic expression showed variation between control and MECP2‐KO NPCs and neurons, as depicted on volcano plots (A) and heatmap (B). Each heatmap column is one gene.C–KSingle‐cell RT–qPCR analysis likewise showed differences in gene expression throughout neuronal differentiation due to MECP2‐KO that appear to involve synaptic function. 28‐days WT83/Q83X and WT82/K82fs neurons were used. Principal component analysis (C) of control and MECP2‐KO NPCs (day 0 of same cell lines) and comparative expression of select genes between genotypes (D). Principal component analysis shows differences in expression between NPCs and neurons within each genotype (E) and differences in neuronal gene expression between genotypes (F). Heatmap shows differences in expression of particular genes (columns; G), and schematic denotes single‐cell qPCR of individual markers (H). Number (H) and graphical depiction (J) of differentially expressed genes between genotypes. Table presents differentially expressed genes (K).CC BY · PubMed Central
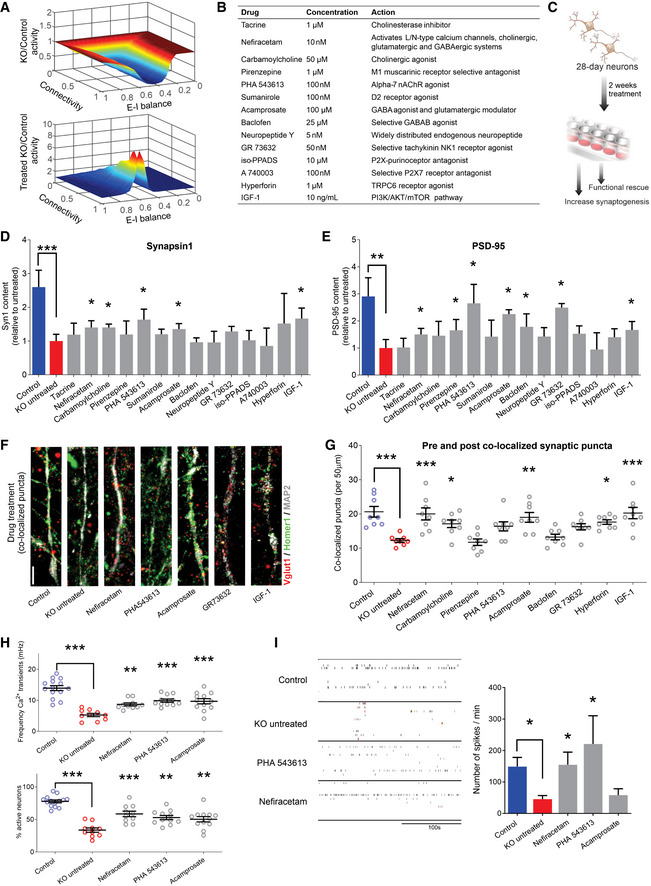
Figure 2 Screening selected drugs with synaptic action in human neurons identifies Nefiracetam and PHA 543613 as top treatment candidates for MeCP2 deficiency A In silico neural network modeling using our previous synaptic puncta values for untreated (top, knockdown (KD) [6/16] = 0.375*control) and treated (bottom, KD [24/16] = 1.5*control) RTT neurons (Marchetto et al, 2010) suggested that isolated increase of synaptic knockdown sufficiently increases neural activity (untreated, mean = 0.665, range = [0.050,1.002]; treated, mean = 1.542, range = [0.997,8.395]). For excitatory‐inhibitory (E–I) balance, “0” is fully excitatory, “1” is fully inhibitory.BList of compounds for the phenotypic screening. The compounds were selected for mechanisms of action that counteracted the neurotransmitter deficiencies observed in Fig 1. The final concentration was determined based on previous studies.CSchematic of drug treatment workflow. Briefly, 28‐day‐old MECP2‐KO neurons were treated for 2 more weeks prior to performing phenotypic reversal experiments.D, EWestern blot quantification showed decreased presynaptic Synapsin1 (D) and postsynaptic PSD‐95 (E) in untreated 6‐week MECP2‐KO neurons that can be increased by drug treatment (Kruskal–Wallis test, *P < 0.05, **P < 0.01, ***P < 0.001; full Western blot, Fig EV4A; WT83/Q83X cell lines were used; N = 3 clones from each genotype).F, G6‐week MECP2‐KO neurons (F) showed a pharmacologically rescuable reduction of co‐localized synaptic puncta (G; one‐way ANOVA, F 16,118 = 9.148, *P < 0.05; Dunnet’s multiple comparisons test vs. untreated KO (WT83/Q83X cell lines were used; N = 7–8 neurons/condition). *P < 0.05, **P < 0.01, ***P < 0.001. Z scores relative to KO untreated: Control = 3.903; Nefiracetam = 3.560; Carbamoylcholine = 2.705; Pirenzepine = 0.0448; PHA543613 = 2.121; Acamprosate = 3.339; Baclofen = 0.5672; GR73632 = 2.237; Hyperforin = 3.016, and IGF‐1 = 3.791. Scale bar = 5 µm.HDrug treatment increased calcium transient frequency in 6‐week neurons. Fluorescence intensity changes reflecting intracellular calcium transients in neurons in different regions of interest (one‐way ANOVA, F 4,52 = 20.28, Dunnett’s multiple comparisons test vs. untreated KO: Nefiracetam, **P < 0.01 and Z = 2.364; PHA 543613, ***P < 0.001 and Z = 3.391; Acamprosate, ***P < 0.001 and Z = 3.153; WT83/Q83X cell lines were used; N = 10–14 neurons/condition) and the percentage of active neurons (one‐way ANOVA, F 4,52 = 23.11; Dunnett’s multiple comparison test vs. untreated KO: Nefiracetam, ***P < 0.001 and Z = 3.144; PHA 543613, **P < 0.01 and Z = 2.567; **Acamprosate, P < 0.01 and Z = 2.285; N = 10–14 neurons/condition).ITreatment with either Nefiracetam or PHA 543613 increased network spiking activity in MECP2‐KO neurons on MEA (two‐sided unpaired Student’s t‐test compared with KO untreated: Nefiracetam, *P = 0.016 and Z = 2.418; PHA 543613, *P = 0.027 and Z = 2.147; Acamprosate, P = 0.39 and Z = 0.477; WT83/Q83X and WT82/K82fs cell lines were used; N = 4–11 MEA wells/condition). Data information: Note that asterisks signify statistically significant difference from MECP2‐KO untreated. Data are presented as mean ± s.e.m.
Figure 2 Screening selected drugs with synaptic action in human neurons identifies Nefiracetam and PHA 543613 as top treatment candidates for MeCP2 deficiency A In silico neural network modeling using our previous synaptic puncta values for untreated (top, knockdown (KD) [6/16] = 0.375*control) and treated (bottom, KD [24/16] = 1.5*control) RTT neurons (Marchetto et al, 2010) suggested that isolated increase of synaptic knockdown sufficiently increases neural activity (untreated, mean = 0.665, range = [0.050,1.002]; treated, mean = 1.542, range = [0.997,8.395]). For excitatory‐inhibitory (E–I) balance, “0” is fully excitatory, “1” is fully inhibitory.BList of compounds for the phenotypic screening. The compounds were selected for mechanisms of action that counteracted the neurotransmitter deficiencies observed in Fig 1. The final concentration was determined based on previous studies.CSchematic of drug treatment workflow. Briefly, 28‐day‐old MECP2‐KO neurons were treated for 2 more weeks prior to performing phenotypic reversal experiments.D, EWestern blot quantification showed decreased presynaptic Synapsin1 (D) and postsynaptic PSD‐95 (E) in untreated 6‐week MECP2‐KO neurons that can be increased by drug treatment (Kruskal–Wallis test, *P < 0.05, **P < 0.01, ***P < 0.001; full Western blot, Fig EV4A; WT83/Q83X cell lines were used; N = 3 clones from each genotype).F, G6‐week MECP2‐KO neurons (F) showed a pharmacologically rescuable reduction of co‐localized synaptic puncta (G; one‐way ANOVA, F 16,118 = 9.148, *P < 0.05; Dunnet’s multiple comparisons test vs. untreated KO (WT83/Q83X cell lines were used; N = 7–8 neurons/condition). *P < 0.05, **P < 0.01, ***P < 0.001. Z scores relative to KO untreated: Control = 3.903; Nefiracetam = 3.560; Carbamoylcholine = 2.705; Pirenzepine = 0.0448; PHA543613 = 2.121; Acamprosate = 3.339; Baclofen = 0.5672; GR73632 = 2.237; Hyperforin = 3.016, and IGF‐1 = 3.791. Scale bar = 5 µm.HDrug treatment increased calcium transient frequency in 6‐week neurons. Fluorescence intensity changes reflecting intracellular calcium transients in neurons in different regions of interest (one‐way ANOVA, F 4,52 = 20.28, Dunnett’s multiple comparisons test vs. untreated KO: Nefiracetam, **P < 0.01 and Z = 2.364; PHA 543613, ***P < 0.001 and Z = 3.391; Acamprosate, ***P < 0.001 and Z = 3.153; WT83/Q83X cell lines were used; N = 10–14 neurons/condition) and the percentage of active neurons (one‐way ANOVA, F 4,52 = 23.11; Dunnett’s multiple comparison test vs. untreated KO: Nefiracetam, ***P < 0.001 and Z = 3.144; PHA 543613, **P < 0.01 and Z = 2.567; **Acamprosate, P < 0.01 and Z = 2.285; N = 10–14 neurons/condition).ITreatment with either Nefiracetam or PHA 543613 increased network spiking activity in MECP2‐KO neurons on MEA (two‐sided unpaired Student’s t‐test compared with KO untreated: Nefiracetam, *P = 0.016 and Z = 2.418; PHA 543613, *P = 0.027 and Z = 2.147; Acamprosate, P = 0.39 and Z = 0.477; WT83/Q83X and WT82/K82fs cell lines were used; N = 4–11 MEA wells/condition). Data information: Note that asterisks signify statistically significant difference from MECP2‐KO untreated. Data are presented as mean ± s.e.m.CC BY · PubMed Central
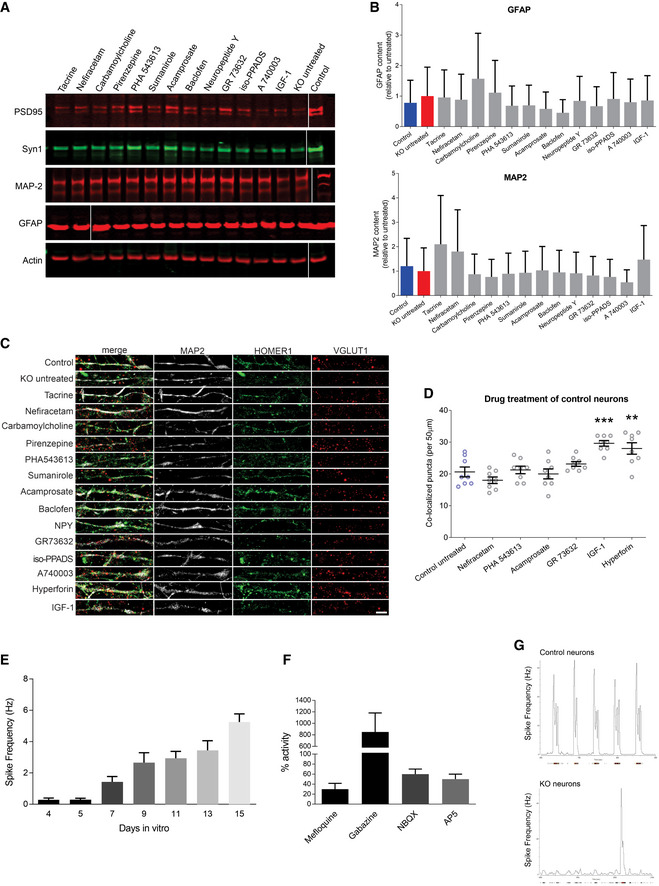
Figure EV4 Drug treatment of MECP2‐KO and control neurons ARepresentative Western blot images after MECP2‐KO drug treatment. Samples run at the same time in different gels.BAnalysis of treatment effect on quantities of the astrocytic marker GFAP and neuronal marker MAP2. Experiments were performed in triplicate.CFull depiction of synaptic puncta following drug treatment. Scale bar = 5 µm.DSynaptic puncta co‐localization following drug treatment of 6‐week control neurons (WT83/Q83X cell lines were used; N = 8 neurons per condition; one‐way ANOVA, F 6,49 = 10.94, *P < 0.05). ** P < 0.01, *** P < 0.001. Z scores of control untreated vs. compound: Nefiracetam = 1.010; PHA 543613 = 0.282; Acamprosate = 0.175; GR73632 = 1.010; IGF‐1 = 3.231; Hyperforin = 2.639).E, FCalcium imaging showed increasing spike frequency with time (E) that was tractable to manipulators of synaptic function (F). Experiments were performed in triplicate.GRepresentative image of MEA activity of control and MECP2‐KO neurons. Data information: Data are presented as mean ± s.e.m.
Figure EV4 Drug treatment of MECP2‐KO and control neurons ARepresentative Western blot images after MECP2‐KO drug treatment. Samples run at the same time in different gels.BAnalysis of treatment effect on quantities of the astrocytic marker GFAP and neuronal marker MAP2. Experiments were performed in triplicate.CFull depiction of synaptic puncta following drug treatment. Scale bar = 5 µm.DSynaptic puncta co‐localization following drug treatment of 6‐week control neurons (WT83/Q83X cell lines were used; N = 8 neurons per condition; one‐way ANOVA, F 6,49 = 10.94, *P < 0.05). ** P < 0.01, *** P < 0.001. Z scores of control untreated vs. compound: Nefiracetam = 1.010; PHA 543613 = 0.282; Acamprosate = 0.175; GR73632 = 1.010; IGF‐1 = 3.231; Hyperforin = 2.639).E, FCalcium imaging showed increasing spike frequency with time (E) that was tractable to manipulators of synaptic function (F). Experiments were performed in triplicate.GRepresentative image of MEA activity of control and MECP2‐KO neurons. Data information: Data are presented as mean ± s.e.m.CC BY · PubMed Central
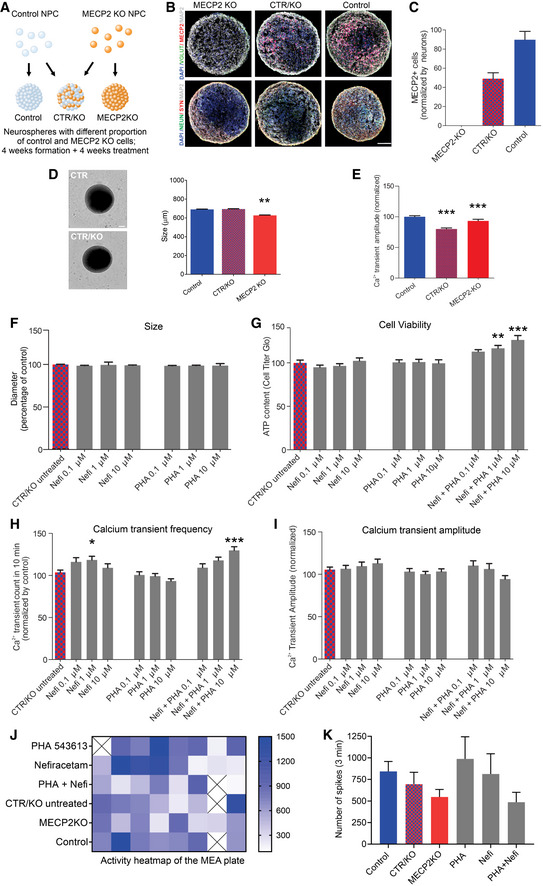
Figure 3 Treatment of MECP2‐mosaic neurospheres with Nefiracetam and PHA 543613 ASchematic showing the formation of control, MECP2‐KO, and mosaic MECP2‐KO/control neurospheres (WT83/Q83X cell lines were used).B, CImmunofluorescent staining (B) and quantitation (C) confirmed the graded decrease in MeCP2 expression from control to 50% MECP2‐mosaic to full MECP2‐KO neurospheres. Scale bar = 50 µm.D8‐week MECP2‐KO neurospheres (N = 44) exhibited decreased size (diameter; **P < 0.01), but 50% MECP2‐mosaic neurospheres (CTR/KO; N = 44) were unchanged from controls (one‐way ANOVA, F 2,150 = 6.03, P = 0.003; Dunnett’s multiple comparisons test; N = 65). Left: representative bright‐field images of neurospheres; Right: neurosphere size quantification. Scale bar = 200 µm.ECalcium imaging analysis showing calcium transients normalized by control (one‐way ANOVA, F 2,72 = 15.62, P < 0.0001; Dunnett’s multiple comparisons test vs. control: MECP2‐mosaic, ***P < 0.001; MECP2‐KO, ***P < 0.001). WT83/Q83X cell lines were used; N = 44 Q83X neurospheres and 65 WT83 neurospheres.F8‐week neurosphere size (diameter) remained unchanged by treatment with either drug (one‐way ANOVA, F 6,344 = 0.52, P = 0.79; N = 44 Q83X neurospheres and 65 WT83 neurospheres).GCell viability was improved or unharmed in treated 8‐week neurospheres (one‐way ANOVA, F 9,104 = 6.81; Dunnett’s multiple comparisons test vs. CTR/KO untreated: Nefi + PHA 1 µM, **P < 0.01 and Z = 2.974; Nefi + PHA 10 µM, ***P < 0.001 and Z = 3.733; N = 8–24 neurospheres per condition).H, ICalcium transient frequency (number of peaks in 10 mins recording) normalized by CTR/KO untreated (H; one‐way ANOVA, F 9,239 = 6.18; Dunnett’s multiple comparisons test vs. CTR/KO untreated: Nefi 1 µM, *P < 0.05 and Z = 0.780; Nefi + PHA 10 µM, ***P < 0.001 and Z = 1.972; N = 15‐61 neurospheres per condition) and calcium transient amplitude normalized by CTR/KO untreated (I; one‐way ANOVA, F 9,241 = 1.27, P = 0.255; N = 16–62 neurospheres per condition).J, KMEA spike frequency heatmap (J) and quantification (K) normalized by CTR/KO untreated (one‐way ANOVA, F 5,38 = 1.21, P = 0.321; Dunnett’s multiple comparisons test vs. CTR/KO untreated: PHA, P = 0.65 and Z = 1.134; Nefi, P = 0.98 and Z = 0.06; PHA + Nefi, P = 0.86 and Z = 0.94; N = 7‐8 wells per condition). ‘X’ on activity heatmap signifies absence of a neurosphere in that position. Data information: Nefi: Nefiracetam; PHA: PHA 543613. Note that asterisks in F–K signify a statistically significant difference in treated MECP2‐mosaic (CTR/KO) neurospheres compared with untreated CTR/KO neurospheres. Data are presented as mean ± s.e.m.
Figure 3 Treatment of MECP2‐mosaic neurospheres with Nefiracetam and PHA 543613 ASchematic showing the formation of control, MECP2‐KO, and mosaic MECP2‐KO/control neurospheres (WT83/Q83X cell lines were used).B, CImmunofluorescent staining (B) and quantitation (C) confirmed the graded decrease in MeCP2 expression from control to 50% MECP2‐mosaic to full MECP2‐KO neurospheres. Scale bar = 50 µm.D8‐week MECP2‐KO neurospheres (N = 44) exhibited decreased size (diameter; **P < 0.01), but 50% MECP2‐mosaic neurospheres (CTR/KO; N = 44) were unchanged from controls (one‐way ANOVA, F 2,150 = 6.03, P = 0.003; Dunnett’s multiple comparisons test; N = 65). Left: representative bright‐field images of neurospheres; Right: neurosphere size quantification. Scale bar = 200 µm.ECalcium imaging analysis showing calcium transients normalized by control (one‐way ANOVA, F 2,72 = 15.62, P < 0.0001; Dunnett’s multiple comparisons test vs. control: MECP2‐mosaic, ***P < 0.001; MECP2‐KO, ***P < 0.001). WT83/Q83X cell lines were used; N = 44 Q83X neurospheres and 65 WT83 neurospheres.F8‐week neurosphere size (diameter) remained unchanged by treatment with either drug (one‐way ANOVA, F 6,344 = 0.52, P = 0.79; N = 44 Q83X neurospheres and 65 WT83 neurospheres).GCell viability was improved or unharmed in treated 8‐week neurospheres (one‐way ANOVA, F 9,104 = 6.81; Dunnett’s multiple comparisons test vs. CTR/KO untreated: Nefi + PHA 1 µM, **P < 0.01 and Z = 2.974; Nefi + PHA 10 µM, ***P < 0.001 and Z = 3.733; N = 8–24 neurospheres per condition).H, ICalcium transient frequency (number of peaks in 10 mins recording) normalized by CTR/KO untreated (H; one‐way ANOVA, F 9,239 = 6.18; Dunnett’s multiple comparisons test vs. CTR/KO untreated: Nefi 1 µM, *P < 0.05 and Z = 0.780; Nefi + PHA 10 µM, ***P < 0.001 and Z = 1.972; N = 15‐61 neurospheres per condition) and calcium transient amplitude normalized by CTR/KO untreated (I; one‐way ANOVA, F 9,241 = 1.27, P = 0.255; N = 16–62 neurospheres per condition).J, KMEA spike frequency heatmap (J) and quantification (K) normalized by CTR/KO untreated (one‐way ANOVA, F 5,38 = 1.21, P = 0.321; Dunnett’s multiple comparisons test vs. CTR/KO untreated: PHA, P = 0.65 and Z = 1.134; Nefi, P = 0.98 and Z = 0.06; PHA + Nefi, P = 0.86 and Z = 0.94; N = 7‐8 wells per condition). ‘X’ on activity heatmap signifies absence of a neurosphere in that position. Data information: Nefi: Nefiracetam; PHA: PHA 543613. Note that asterisks in F–K signify a statistically significant difference in treated MECP2‐mosaic (CTR/KO) neurospheres compared with untreated CTR/KO neurospheres. Data are presented as mean ± s.e.m.CC BY · PubMed Central
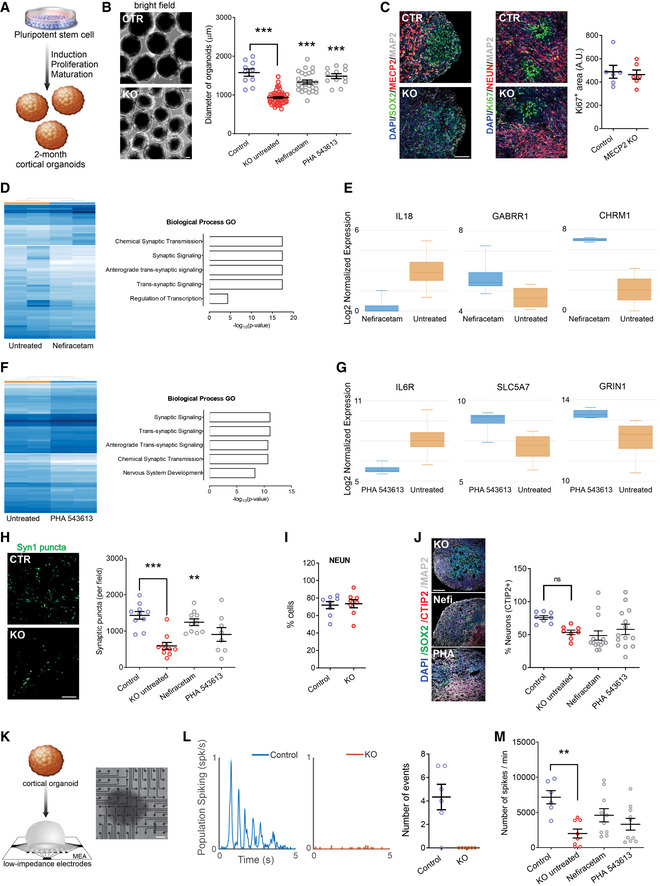
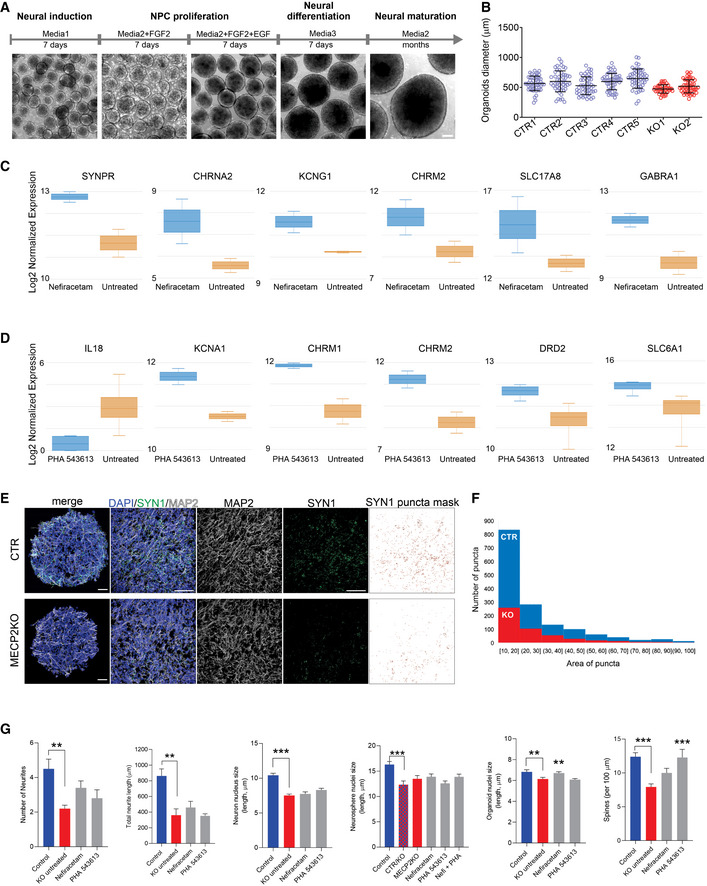
Figure 4 Treatment increases synapse‐related gene expression and network activity in MECP2‐KO cortical organoids ASchematic of PSC aggregation and development into cortical organoids.B2‐month‐old cortical organoid diameter (one‐way ANOVA, F 2,173 = 91.07, P < 0.0001; Dunnett’s multiple comparisons test vs. untreated: Nefiracetam, ***P < 0.001 and Z = 5.414; PHA 543613, ***P < 0.001 and Z = 5.351; WT83/Q83X and WT82/K82fs cell lines were used; N = 28–90 organoids per condition). Left: representative bright‐field images of cortical organoids; Right: cortical organoid size quantification. Scale bar = 200 µm.CKi67 + proliferative area (Student’s t‐test, t 10 = 0.36, P = 0.73, N = 6 each). Left: representative immunofluorescence images of progenitor, proliferative, and neuronal markers in cortical organoids; Right: quantification of Ki67 + proliferation in cortical organoids. Scale bar = 50 µm.D, ERNA sequencing (D, left: heatmap) and GO analysis (D, right) of untreated MECP2‐KO organoids vs. Nefiracetam (N = 4 samples each of ~10–15 pooled organoids) indicated that treatment upregulated genetic expression in synapse‐relevant pathways. E, center band of the box is median log2 normalized expression and edges are 25th and 75th percentiles; whiskers are minimum and maximum log2 normalized expression values.F, GRNA sequencing (F, left: heatmap) and GO analysis (F, right) of untreated MECP2‐KO organoids vs. PHA 543613 (N = 4 samples each of ~10–15 pooled organoids) indicated that treatment upregulated expression of genes in synapse‐relevant pathways. G, center band of the box is median log2 normalized expression and edges are 25th and 75th percentiles; whiskers are minimum and maximum log2 normalized expression values.HSynapsin1 + puncta quantitation (one‐way ANOVA, F 3,34 = 10.07, P < 0.0001; Dunnett’s multiple comparisons test vs. untreated: Nefiracetam, **P < 0.01 and Z = 2.998; PHA 543613, P > 0.05 and Z = 1.266; WT83/Q83X cell lines were used; N = 8–10 each). Left: representative image of Synapsin1 + immunofluorescent staining; Right: Synapsin1 + puncta quantification. Scale bar = 20 µm.I, J MECP2‐KO and control organoids had similar proportions of cells positive for the neuronal marker NeuN (I; Student’s t‐test, t 14 = 0.26, P = 0.80, N = 8 each) and cortical layer V and VI neuronal marker CTIP2 (J; one‐way ANOVA, F 3,40 = 2.489, P = 0.074 and Z < 1, WT83/Q83X and WT82/K82fs cell lines were used; N = 8–14 organoids each). J, left: representative image of CTIP2 + immunofluorescent staining in cortical organoids; J, right: quantification of CTIP2 + neurons. Scale bar = 50 µm.K–M MECP2‐KO cortical organoids plated on MEA (K; left: schematic depicts process of plating organoids on MEA; right: top‐down view of organoid on MEA; scale bar = 200 µm) showed decreased population spiking (L; left and center: representative population spiking traces of control and MECP2‐KO organoids; right: quantification of organoid population spiking activity, N = 6 replicates each). Drug treatment increased spiking network activity of MECP2‐KO cortical organoids to a level not significantly different from that of control organoids (M; one‐way ANOVA, F 3,31 = 3.775, Dunnett’s multiple comparisons test vs. control: untreated KO, **P < 0.01 and Z = 3.192; Nefiracetam, P = 0.98 and Z = 2.117; PHA 543613, P = 0.12 and Z = 1.101, WT83/Q83X cell lines were used; N = 7–10 MEA wells per condition). Data information: Note that asterisks signify a statistically significant difference from untreated MECP2‐KO cortical organoids. Data are presented as mean ± s.e.m.
Figure 4 Treatment increases synapse‐related gene expression and network activity in MECP2‐KO cortical organoids ASchematic of PSC aggregation and development into cortical organoids.B2‐month‐old cortical organoid diameter (one‐way ANOVA, F 2,173 = 91.07, P < 0.0001; Dunnett’s multiple comparisons test vs. untreated: Nefiracetam, ***P < 0.001 and Z = 5.414; PHA 543613, ***P < 0.001 and Z = 5.351; WT83/Q83X and WT82/K82fs cell lines were used; N = 28–90 organoids per condition). Left: representative bright‐field images of cortical organoids; Right: cortical organoid size quantification. Scale bar = 200 µm.CKi67 + proliferative area (Student’s t‐test, t 10 = 0.36, P = 0.73, N = 6 each). Left: representative immunofluorescence images of progenitor, proliferative, and neuronal markers in cortical organoids; Right: quantification of Ki67 + proliferation in cortical organoids. Scale bar = 50 µm.D, ERNA sequencing (D, left: heatmap) and GO analysis (D, right) of untreated MECP2‐KO organoids vs. Nefiracetam (N = 4 samples each of ~10–15 pooled organoids) indicated that treatment upregulated genetic expression in synapse‐relevant pathways. E, center band of the box is median log2 normalized expression and edges are 25th and 75th percentiles; whiskers are minimum and maximum log2 normalized expression values.F, GRNA sequencing (F, left: heatmap) and GO analysis (F, right) of untreated MECP2‐KO organoids vs. PHA 543613 (N = 4 samples each of ~10–15 pooled organoids) indicated that treatment upregulated expression of genes in synapse‐relevant pathways. G, center band of the box is median log2 normalized expression and edges are 25th and 75th percentiles; whiskers are minimum and maximum log2 normalized expression values.HSynapsin1 + puncta quantitation (one‐way ANOVA, F 3,34 = 10.07, P < 0.0001; Dunnett’s multiple comparisons test vs. untreated: Nefiracetam, **P < 0.01 and Z = 2.998; PHA 543613, P > 0.05 and Z = 1.266; WT83/Q83X cell lines were used; N = 8–10 each). Left: representative image of Synapsin1 + immunofluorescent staining; Right: Synapsin1 + puncta quantification. Scale bar = 20 µm.I, J MECP2‐KO and control organoids had similar proportions of cells positive for the neuronal marker NeuN (I; Student’s t‐test, t 14 = 0.26, P = 0.80, N = 8 each) and cortical layer V and VI neuronal marker CTIP2 (J; one‐way ANOVA, F 3,40 = 2.489, P = 0.074 and Z < 1, WT83/Q83X and WT82/K82fs cell lines were used; N = 8–14 organoids each). J, left: representative image of CTIP2 + immunofluorescent staining in cortical organoids; J, right: quantification of CTIP2 + neurons. Scale bar = 50 µm.K–M MECP2‐KO cortical organoids plated on MEA (K; left: schematic depicts process of plating organoids on MEA; right: top‐down view of organoid on MEA; scale bar = 200 µm) showed decreased population spiking (L; left and center: representative population spiking traces of control and MECP2‐KO organoids; right: quantification of organoid population spiking activity, N = 6 replicates each). Drug treatment increased spiking network activity of MECP2‐KO cortical organoids to a level not significantly different from that of control organoids (M; one‐way ANOVA, F 3,31 = 3.775, Dunnett’s multiple comparisons test vs. control: untreated KO, **P < 0.01 and Z = 3.192; Nefiracetam, P = 0.98 and Z = 2.117; PHA 543613, P = 0.12 and Z = 1.101, WT83/Q83X cell lines were used; N = 7–10 MEA wells per condition). Data information: Note that asterisks signify a statistically significant difference from untreated MECP2‐KO cortical organoids. Data are presented as mean ± s.e.m.CC BY · PubMed Central
Figure EV5 Cellular and molecular characterization of human cortical organoids ASchematic of the protocol used to generate cortical organoids. Scale bar = 200 μm.BReproducibility of organoid size at 3 weeks of maturation (N = 20 independent experiment, 7 different cell lines).C, DGene expression of specific neurotransmission markers of treated vs. untreated cortical organoids (N = 8 samples of treated organoids and 8 samples of control organoids, ~10–15 organoids pooled per sample). Boxplot: center band of the box is median log2 normalized expression and edges are 25th and 75th percentiles; whiskers are minimum and maximum log2 normalized expression values.E, FRepresentative images of quantification of Synapsin1 puncta. Scale bar = 50 μm. SYN1 puncta mask was made using ImageJ to access the number and area of the puncta.GNefiracetam and PHA 543613 treatment did not rescue MECP2‐KO neuronal morphology, for either the number of neurites (Kruskal–Wallis test, P = 0.011; Dunn’s multiple comparisons test vs. KO untreated: control, **P = 0.01 and Z = 3.13; Nefiracetam, P = 0.49 and Z = 1.74; PHA 543613, P > 0.99 and Z = 0.87; WT83/Q83X and WT82/K82fs cell lines; N = 5–10 neurons per condition) or the total neurite length (one‐way ANOVA, F 3,21 = 9.62, P = 0.0003; Dunnett’s multiple comparisons test vs. KO untreated: control, **P = 0.002 and Z = 3.08; Nefiracetam, P = 0.89 and Z = 0.64; PHA 543613, P = 0.99 and Z = 0.17; WT83/Q83X and WT82/K82fs cell lines; N = 5–10 neurons per condition) and, nearly uniformly, did not rescue nuclei size in neurons (one‐way ANOVA, F 3,221 = 26.04, P < 0.0001; Dunnett’s multiple comparisons test vs. KO untreated: control, ***P < 0.0001 and Z = 6.37; Nefiracetam, P = 0.91 and Z = 0.39; PHA 543613, P = 0.19 and Z = 1.74; WT83/Q83X and WT82/K82fs cell lines; N = 45 nuclei per condition), neurospheres (one‐way ANOVA, F 5,264 = 5.579, P < 0.0001; Dunnett’s multiple comparisons test vs. CTR/KO untreated: control, ***P < 0.0001 and Z = 3.782; KO untreated, P = 0.51 and Z = 1.066; Nefiracetam, P = 0.23 and Z = 1.35; PHA 543613, P = 0.99 and Z = 0.05; Nefi + PHA, P = 0.24 and Z = 1.012; WT83/Q83X cell lines; N = 45 nuclei per condition), or cortical organoids (one‐way ANOVA, F 3,281 = 6.594, P = 0.0003; Dunnett’s multiple comparisons test vs. KO untreated: control, **P = 0.009 and Z = 2.38; Nefiracetam, **P = 0.01 and Z = 3.05; PHA 543613, P = 0.98 and Z = 0.30; WT83/Q83X and WT82/K82fs cell lines; N = 45‐90 nuclei per condition). Spine density was rescued or partially rescued by the compounds (one‐way ANOVA, F 3,63 = 8.449, P < 0.0001; Dunnett’s multiple comparisons test vs. KO untreated: control, ***P < 0.0001 and Z = 4.35; Nefiracetam, P = 0.16 and Z = 2.01; PHA 543613, ***P = 0.001 and Z = 3.24; WT83/Q83X and WT82/K82fs cell lines; N = 11–28 neurons per condition). Note that statistical comparisons are presented relative to KO untreated or, for mosaic neurospheres, CTR/KO untreated. Data information: Data are presented as mean ± s.e.m.
Figure EV5 Cellular and molecular characterization of human cortical organoids ASchematic of the protocol used to generate cortical organoids. Scale bar = 200 μm.BReproducibility of organoid size at 3 weeks of maturation (N = 20 independent experiment, 7 different cell lines).C, DGene expression of specific neurotransmission markers of treated vs. untreated cortical organoids (N = 8 samples of treated organoids and 8 samples of control organoids, ~10–15 organoids pooled per sample). Boxplot: center band of the box is median log2 normalized expression and edges are 25th and 75th percentiles; whiskers are minimum and maximum log2 normalized expression values.E, FRepresentative images of quantification of Synapsin1 puncta. Scale bar = 50 μm. SYN1 puncta mask was made using ImageJ to access the number and area of the puncta.GNefiracetam and PHA 543613 treatment did not rescue MECP2‐KO neuronal morphology, for either the number of neurites (Kruskal–Wallis test, P = 0.011; Dunn’s multiple comparisons test vs. KO untreated: control, **P = 0.01 and Z = 3.13; Nefiracetam, P = 0.49 and Z = 1.74; PHA 543613, P > 0.99 and Z = 0.87; WT83/Q83X and WT82/K82fs cell lines; N = 5–10 neurons per condition) or the total neurite length (one‐way ANOVA, F 3,21 = 9.62, P = 0.0003; Dunnett’s multiple comparisons test vs. KO untreated: control, **P = 0.002 and Z = 3.08; Nefiracetam, P = 0.89 and Z = 0.64; PHA 543613, P = 0.99 and Z = 0.17; WT83/Q83X and WT82/K82fs cell lines; N = 5–10 neurons per condition) and, nearly uniformly, did not rescue nuclei size in neurons (one‐way ANOVA, F 3,221 = 26.04, P < 0.0001; Dunnett’s multiple comparisons test vs. KO untreated: control, ***P < 0.0001 and Z = 6.37; Nefiracetam, P = 0.91 and Z = 0.39; PHA 543613, P = 0.19 and Z = 1.74; WT83/Q83X and WT82/K82fs cell lines; N = 45 nuclei per condition), neurospheres (one‐way ANOVA, F 5,264 = 5.579, P < 0.0001; Dunnett’s multiple comparisons test vs. CTR/KO untreated: control, ***P < 0.0001 and Z = 3.782; KO untreated, P = 0.51 and Z = 1.066; Nefiracetam, P = 0.23 and Z = 1.35; PHA 543613, P = 0.99 and Z = 0.05; Nefi + PHA, P = 0.24 and Z = 1.012; WT83/Q83X cell lines; N = 45 nuclei per condition), or cortical organoids (one‐way ANOVA, F 3,281 = 6.594, P = 0.0003; Dunnett’s multiple comparisons test vs. KO untreated: control, **P = 0.009 and Z = 2.38; Nefiracetam, **P = 0.01 and Z = 3.05; PHA 543613, P = 0.98 and Z = 0.30; WT83/Q83X and WT82/K82fs cell lines; N = 45‐90 nuclei per condition). Spine density was rescued or partially rescued by the compounds (one‐way ANOVA, F 3,63 = 8.449, P < 0.0001; Dunnett’s multiple comparisons test vs. KO untreated: control, ***P < 0.0001 and Z = 4.35; Nefiracetam, P = 0.16 and Z = 2.01; PHA 543613, ***P = 0.001 and Z = 3.24; WT83/Q83X and WT82/K82fs cell lines; N = 11–28 neurons per condition). Note that statistical comparisons are presented relative to KO untreated or, for mosaic neurospheres, CTR/KO untreated. Data information: Data are presented as mean ± s.e.m.CC BY · PubMed Central
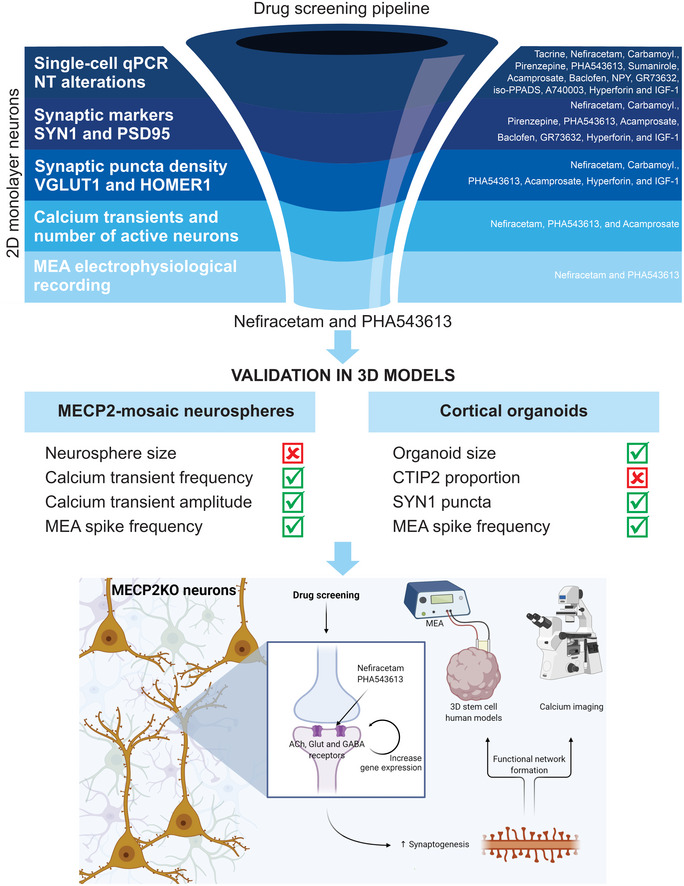
Figure 5 Drug‐screening pipeline overview Top: Left: MECP2‐KO neurons exhibit aberrant synaptic transcriptomics and synaptic morphology as well as decreased calcium transients and neural network activities. Right: Pharmacological compounds were selected for screening based on the expected ability of their mechanisms of action to counteract the synaptic and neurotransmitter pathologies we identified. Center: With step‐wise progression through a pipeline of assays (shown as dark‐to‐light shades of blue), drugs were eliminated either if they did not reverse the MECP2‐KO pathology identified in the assay or if they affected controls. Nefiracetam and PHA 543613 emerged as the two compounds that could reverse MECP2‐KO neurocytopathology without affecting controls. Middle: The effects of Nefiracetam and PHA 543613 were validated in two 3D human cell models, MECP2‐mosaic neurospheres (Left) and MECP2‐KO cortical organoids (Right). Left: One or both drugs reversed calcium transient frequency and amplitude as well as MEA spike frequency in MECP2‐mosaic neurospheres, but not their size. Right: One or both drugs reversed organoid size, SYN1 puncta, and MEA spike frequency in MECP2‐KO cortical organoids. Bottom: A schematic proposing a hypothetical mechanism by which Nefiracetam and PHA 543613 might influence synaptic function.
Figure 5 Drug‐screening pipeline overview Top: Left: MECP2‐KO neurons exhibit aberrant synaptic transcriptomics and synaptic morphology as well as decreased calcium transients and neural network activities. Right: Pharmacological compounds were selected for screening based on the expected ability of their mechanisms of action to counteract the synaptic and neurotransmitter pathologies we identified. Center: With step‐wise progression through a pipeline of assays (shown as dark‐to‐light shades of blue), drugs were eliminated either if they did not reverse the MECP2‐KO pathology identified in the assay or if they affected controls. Nefiracetam and PHA 543613 emerged as the two compounds that could reverse MECP2‐KO neurocytopathology without affecting controls. Middle: The effects of Nefiracetam and PHA 543613 were validated in two 3D human cell models, MECP2‐mosaic neurospheres (Left) and MECP2‐KO cortical organoids (Right). Left: One or both drugs reversed calcium transient frequency and amplitude as well as MEA spike frequency in MECP2‐mosaic neurospheres, but not their size. Right: One or both drugs reversed organoid size, SYN1 puncta, and MEA spike frequency in MECP2‐KO cortical organoids. Bottom: A schematic proposing a hypothetical mechanism by which Nefiracetam and PHA 543613 might influence synaptic function.CC BY · PubMed Central

Verification

Claims the paper makes

The claims and statistics of this paper haven’t been checked yet.

Run the check — free, no account needed. It reads the open-access text and checks the sources it cites.

A few free checks a day · papers already verified open instantly · results are public

Claims other papers make about this one

Each is checked against this paper’s own text: does it say what the citing paper says it does?

Self-check

Percentages, sums and reported differences re-computed from the paper’s own numbers.

The self-check needs the paper’s full text.

Citations

Cites

Cited by

Sorted by citations

See all 101

Metadata

Authors
Trujillo, C. A., Adams, J. W., Negraes, P. D., Carromeu, C., Tejwani, L., Acab, A., Tsuda, B., Thomas, C. A., Sodhi, N., Fichter, K. M., Romero, S., Zanella, F., Sejnowski, T. J., Ulrich, H., & Muotri, A. R.
Affiliations
  • University of California San Diego (US)
  • Salk Institute for Biological Studies (US)
  • Universidade de São Paulo (BR)
Corresponding author
  • Trujillo, Cleber A
  • Muotri, Alysson R
Venue
EMBO Molecular Medicine
Published
2020-12-08
Volume
13
Issue
1
Pages
e12523-e12523
ISSN
  • 1757-4676 (ISSN-L)
  • 1757-4684
OpenAlex
W3110698055
Cited by
101
References
67
Citations by year
2026: 6 · 2025: 27 · 2024: 13 · 2023: 16 · 2022: 23 · 2021: 14 · 2020: 2
FWCI
8.21
Type
journal article
Language
en
Open access
Locations
  • EMBO Molecular Medicine (publishedVersion, cc-by)
  • PubMed Central (publishedVersion, cc-by)
  • PubMed (publishedVersion)
  • eScholarship (California Digital Library) (submittedVersion, cc-by)
  • DOAJ (DOAJ: Directory of Open Access Journals) (submittedVersion, cc-by-sa)
  • eScholarship (California Digital Library) (submittedVersion)
Funders
  • HHS | NIH | National Institute of Mental Health (R01MH094753, R01MH103134, P01 NICHD033113)
  • California Institute for Regenerative Medicine (TR2‐01814, TR4‐06747)
  • HHS | National Institutes of Health (1‐DP2‐OD006495‐01, U19MH107367)
  • HHS | NIH | National Institute of General Medical Sciences (5T32GM007198)
  • UCSD Center for Academic Research and Training in Anthropogeny
  • Brain & Behavior Research Foundation (NARSAD Independent Investigator Grant)
  • HHS | NIH | National Institute on Alcohol Abuse and Alcoholism (K01AA026911)
  • Loulou Foundation
  • Sao Paulo Research Foundation (2018/07366‐4)
Topics
  • Life Sciences › Biochemistry, Genetics and Molecular Biology › Genetics › Genetics and Neurodevelopmental Disorders
  • Life Sciences › Neuroscience › Cellular and Molecular Neuroscience › Neuroscience and Neuropharmacology Research
  • Life Sciences › Neuroscience › Developmental Neuroscience › Neurogenesis and neuroplasticity mechanisms
Keywords
MeCP2, Rett syndrome, cortical organoids, synaptic dysfunction, neurodevelopmental disorders, nefiracetam, drug screening, X-linked disorders
MeSH terms
Female, Humans, Neurons, Organoids, Phenotype, Pyrrolidinones, Quinuclidines, Rett Syndrome, Bridged Bicyclo Compounds, Heterocyclic, Methyl-CpG-Binding Protein 2, Gene Knockout Techniques

About these checks

Registry, retraction, Cites and statistics results are computed, not judged, with one exception: a printed reference that no index lists is read once by a model before it counts as a citation error. Claims are extracted by a model and kept only when their quote appears verbatim in the text; each cited source is then checked, with a model’s help, for whether it says what the claim relies on. Those verdicts can be wrong — read the claim’s quote and the cited source before relying on one.

Statistics and arithmetic are recomputed, not judged.

Confidence bands are shown only for fields calibrated on our annotated test set. None is calibrated yet, so no band is shown.

What counts as a claim ›How we measure confidence ›How we check this ›

Are you an author, or do you see a problem with this page? Request a review