

The DOI matches its Crossref record; 36 of the 36 references it cites were found in a registry or an index.
Prevalence of Autism Spectrum Disorder Among Children Aged 8 Years — Autism and Developmental Disabilities Monitoring Network, 11 Sites, United States, 2016
Open accessAbstract
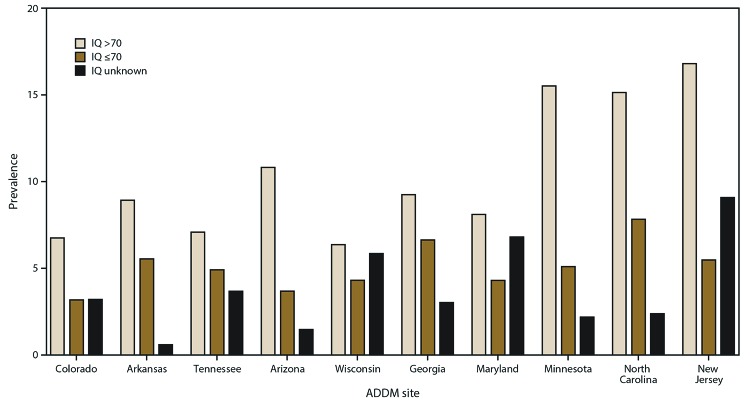
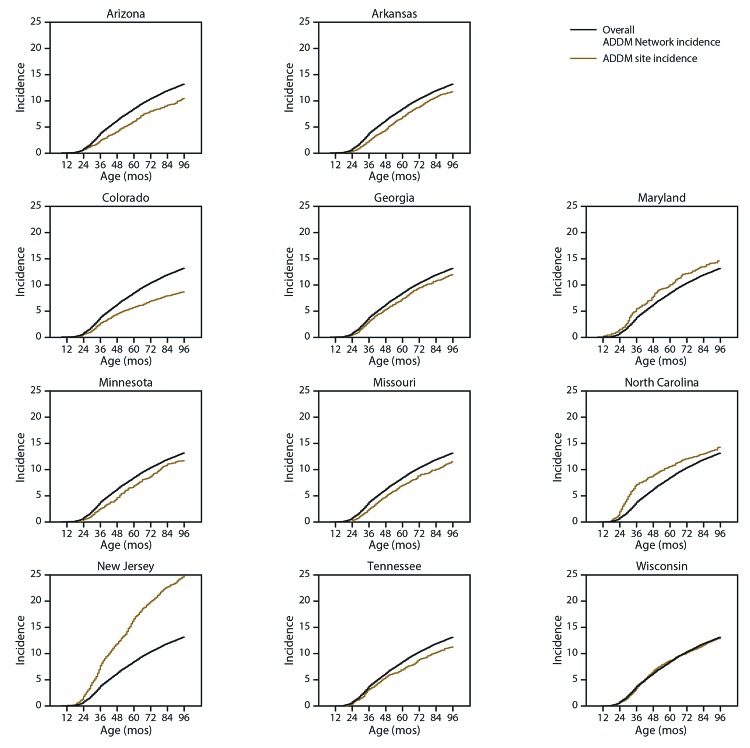
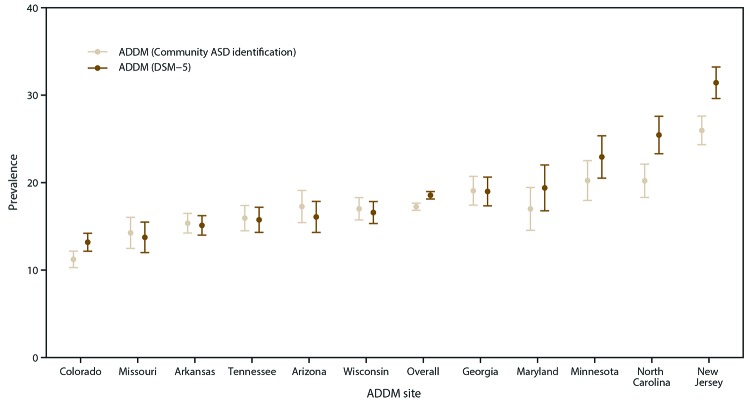
PROBLEM/CONDITION: Autism spectrum disorder (ASD). PERIOD COVERED: 2016. DESCRIPTION OF SYSTEM: The Autism and Developmental Disabilities Monitoring (ADDM) Network is an active surveillance program that provides estimates of the prevalence of ASD among children aged 8 years whose parents or guardians live in 11 ADDM Network sites in the United States (Arizona, Arkansas, Colorado, Georgia, Maryland, Minnesota, Missouri, New Jersey, North Carolina, Tennessee, and Wisconsin). Surveillance is conducted in two phases. The first phase involves review and abstraction of comprehensive evaluations that were completed by medical and educational service providers in the community. In the second phase, experienced clinicians who systematically review all abstracted information determine ASD case status. The case definition is based on ASD criteria described in the Diagnostic and Statistical Manual of Mental Disorders, Fifth Edition. RESULTS: For 2016, across all 11 sites, ASD prevalence was 18.5 per 1,000 (one in 54) children aged 8 years, and ASD was 4.3 times as prevalent among boys as among girls. ASD prevalence varied by site, ranging from 13.1 (Colorado) to 31.4 (New Jersey). Prevalence estimates were approximately identical for non-Hispanic white (white), non-Hispanic black (black), and Asian/Pacific Islander children (18.5, 18.3, and 17.9, respectively) but lower for Hispanic children (15.4). Among children with ASD for whom data on intellectual or cognitive functioning were available, 33% were classified as having intellectual disability (intelligence quotient [IQ] ≤70); this percentage was higher among girls than boys (39% versus 32%) and among black and Hispanic than white children (47%, 36%, and 27%, respectively) [corrected]. Black children with ASD were less likely to have a first evaluation by age 36 months than were white children with ASD (40% versus 45%). The overall median age at earliest known ASD diagnosis (51 months) was similar by sex and racial and ethnic groups; however, black children with IQ ≤70 had a later median age at ASD diagnosis than white children with IQ ≤70 (48 months versus 42 months). INTERPRETATION: The prevalence of ASD varied considerably across sites and was higher than previous estimates since 2014. Although no overall difference in ASD prevalence between black and white children aged 8 years was observed, the disparities for black children persisted in early evaluation and diagnosis of ASD. Hispanic children also continue to be identified as having ASD less frequently than white or black children. PUBLIC HEALTH ACTION: These findings highlight the variability in the evaluation and detection of ASD across communities and between sociodemographic groups. Continued efforts are needed for early and equitable identification of ASD and timely enrollment in services.
Overview
The claims and statistics of this paper haven’t been checked yet.
Run the check — free, no account needed. It reads the open-access text and checks the sources it cites.
Integrity signals
Registry
Cites
Statistics
Figures
Verification
Claims the paper makes
The claims and statistics of this paper haven’t been checked yet.
Run the check — free, no account needed. It reads the open-access text and checks the sources it cites.
Claims other papers make about this one
Each is checked against this paper’s own text: does it say what the citing paper says it does?
The source backs part of the claim, not all of it — or backs it for a different population, condition or comparison.
In the citing paper
“The U.S. reports a consistent pattern of increased ASD prevalence among higher socioeconomic status (SES) families (Baio et al. 2018; Durkin et al. 2010, 2017; Maenner et al. 2020; Pedersen et al. 2012), while European countries report increased prevalence among lower SES families (Delobel-Ayoub et al. 2015; Emerson 2012; Rai et al. 2012).”
From The Diagnosis of Autism: From Kanner to DSM-III to DSM-5 and Beyond (2021) · cites this paper as Maenner et al. 2020
Experimental — accuracy not yet measuredThe source backs part of the claim, not all of it — or backs it for a different population, condition or comparison.
In the citing paper
“In the U.S., African American, Hispanic, and Asian children are more likely to receive a diagnosis at a later age than Caucasian children (Maenner et al. 2020; Mandell et al. 2009; Palmer et al. 2010).”
From The Diagnosis of Autism: From Kanner to DSM-III to DSM-5 and Beyond (2021) · cites this paper as Maenner et al. 2020
Experimental — accuracy not yet measuredThe source backs part of the claim, not all of it — or backs it for a different population, condition or comparison.
In the citing paper
“While prevalence of ASD likely does not differ across racial and ethnic groups (Fombonne 2003; Maenner et al. 2020), the average age of diagnosis continues to differentiate these groups.”
From The Diagnosis of Autism: From Kanner to DSM-III to DSM-5 and Beyond (2021) · cites this paper as Maenner et al. 2020
Experimental — accuracy not yet measuredThe source backs part of the claim, not all of it — or backs it for a different population, condition or comparison.
In the citing paper
“Lastly, while the percentage of children diagnosed with ASD and intellectual disability is higher among African American and Hispanic children compared to Caucasian children in the U.S., African American and Hispanic children are nevertheless diagnosed at a later age on average than Caucasian children (Maenner et al. 2020).”
From The Diagnosis of Autism: From Kanner to DSM-III to DSM-5 and Beyond (2021) · cites this paper as Maenner et al. 2020
Experimental — accuracy not yet measuredThe source backs part of the claim, not all of it — or backs it for a different population, condition or comparison.
In the citing paper
“Surveillance among children aged 4 years in 2016 (8) indicated similar prevalence among children of different racial and ethnic groups, consistent with trends among children aged 8 years (9).”
From Early Identification of Autism Spectrum Disorder Among Children Aged 4 Years — Autism and Developmental Disabilities Monitoring Network, 11 Sites, United States, 2018 (2021) · cites this paper as [9]
Experimental — accuracy not yet measured
The source backs part of the claim, not all of it — or backs it for a different population, condition or comparison.
In the citing paper
“however, diagnosis typically occurs later in Europe (3.5 years), USA (4 years), and Canada (6 years), exposing an opportunity to decrease the age at diagnosis and accelerate access to specialized healthcare.”
From Tackling healthcare access barriers for individuals with autism from diagnosis to adulthood (2022) · cites this paper as [58]
Experimental — accuracy not yet measuredThe cited source says what the claim attributes to it.
In the citing paper
“ASD is ~4 times more prevalent in boys than in girls (16, 31).”
From Where Sex Meets Gender: How Sex and Gender Come Together to Cause Sex Differences in Mental Illness (2022) · cites this paper as [16]
In the citing paper
“and 1.85% (CI95%: 1.80–1.91%) in children aged eight year old (26).”
From Prevalence of Autism Spectrum Disorder and Co-morbidities in Children and Adolescents: A Systematic Literature Review (2021) · cites this paper as [26]
In the citing paper
“In the US, Christensen et al. (15) and Maenner et al. (26) assessed the prevalence of ID in ASD children aged 4y and 8y respectively based on the ADDM network and reported rates of 46.10% and 33.00%.”
From Prevalence of Autism Spectrum Disorder and Co-morbidities in Children and Adolescents: A Systematic Literature Review (2021) · cites this paper as [26]
In the citing paper
“The estimated prevalence of ASD has increased over 30-fold over the last four decades,18 primarily due to diagnostic expansion.19,20”
From The female protective effect against autism spectrum disorder (2022) · cites this paper as [20]
In the citing paper
“Members of previous generations, particularly those able to live independently as adults, were far less likely to receive an ASD diagnosis in childhood than children born as of writing.19,20”
From The female protective effect against autism spectrum disorder (2022) · cites this paper as [20]
In the citing paper
“For example, females are on average diagnosed later than males.20”
From The female protective effect against autism spectrum disorder (2022) · cites this paper as [20]
In the citing paper
“If consistent with the rate of ID in ASD cases in the United States or the United Kingdom, it would be approximately 40% over this diagnostic period.20”
From The female protective effect against autism spectrum disorder (2022) · cites this paper as [20]
In the citing paper
“The sex ratio is one example of how differences in identification of children without intellectual disability can affect patterns observed at older ages, with a higher ratio of boys to girls at age 8 years than at age 4 years, consistent with previous reports (8,9).”
In the citing paper
“In surveillance year 2018, ASD prevalence among Black children was higher than among White children at five of 11 sites and overall, the opposite of the pattern before surveillance year 2016 among children aged 8 years (9,17).”
In the citing paper
“Children with co-occurring intellectual disability are more likely to be identified earlier than children without intellectual disability, as indicated by an earlier median age at identification among this group (11) as well as the consistently higher proportion of children with intellectual disability at age 4 years (8,13) than at age 8 years (9,11,17).”
Self-check
Percentages, sums and reported differences re-computed from the paper’s own numbers.
The self-check needs the paper’s full text.
Citations
Cites
Diagnostic and Statistical Manual of Mental Disorders
American Psychiatric Association (2013) · doi:10.1176/appi.books.9780890425596 · Cited by 116,369
Baio, J., Wiggins, L., Christensen, D. L., Maenner, M. J., Daniels, J., Warren, Z., Kurzius-Spencer, M., Zahorodny, W., Robinson, C., Rosenberg, et al. (2018) · MMWR. Surveillance Summaries · doi:10.15585/mmwr.ss6706a1 · Cited by 6,078 · cited 5×
“8 per 1,000 (one in 59) children aged 8 years in 2014 (3).”
BackgroundMethodInfluentialSelf-citationDawson, G., Rogers, S., Munson, J., Smith, M., Winter, J., Greenson, J., Donaldson, A., & Varley, J. (2010) · Pediatrics · doi:10.1542/peds.2009-0958 · Cited by 2,835
Identification and Evaluation of Children With Autism Spectrum Disorders
Johnson, C. P., Myers, S. M., & and the Council on Children With Disabilities (2007) · Pediatrics · doi:10.1542/peds.2007-2361 · Cited by 2,011
Christensen, D. L., Baio, J., Braun, K. V. N., Bilder, D., Charles, J., Constantino, J. N., Daniels, J., Durkin, M. S., Fitzgerald, R. T., Kurzius-Spencer, M., et al. (2016) · MMWR. Surveillance Summaries · doi:10.15585/mmwr.ss6503a1 · Cited by 1,964
Self-citationNaarden Braun, K. V., Lopez, M., White, T., et al. (2023) · Carolina Digital Repository (University of North Carolina at Chapel Hill) · doi:10.17615/y3kk-5x30 · Cited by 1,381
Self-citationPrevalence of Autism in a US Metropolitan Area
Yeargin-Allsopp, M., Rice, C., Karapurkar, T., Doernberg, N., Boyle, C., & Murphy, C. (2003) · JAMA · doi:10.1001/jama.289.1.49 · Cited by 1,248 · cited 3×
“The ADDM Network uses a multiple-source, records-based surveillance methodology developed by CDC’s Metropolitan Atlanta Developmental Disabilities Surveillance Program (2,24).”
BackgroundMethodInfluentialPrevalence and Trends of Developmental Disabilities among Children in the United States: 2009–2017
Zablotsky, B., Black, L. I., Maenner, M. J., Schieve, L. A., Danielson, M. L., Bitsko, R. H., Blumberg, S. J., Kogan, M. D., & Boyle, C. A. (2019) · Pediatrics · doi:10.1542/peds.2019-0811 · Cited by 1,217 · cited 1×
“The 2016 NSCH and the 2015–2017 NHIS both estimated ASD prevalence at 25 per 1,000 children aged 3–17 years (13,29).”
BackgroundSelf-citationRice, C. E. (2009) · PsycEXTRA Dataset · doi:10.1037/e562722010-001 · Cited by 762
Rogers, S. J., Estes, A., Lord, C., Vismara, L., Winter, J., Fitzpatrick, A., Guo, M., & Dawson, G. (2012) · Journal of the American Academy of Child & Adolescent Psychiatry · doi:10.1016/j.jaac.2012.08.003 · Cited by 713
Epidemiology of autism spectrum disorders: a review of worldwide prevalence estimates since 2014
Chiarotti, F., & Venerosi, A. (2020) · Brain Sciences · doi:10.3390/brainsci10050274 · Cited by 580
Reichow, B., Barton, E. E., Boyd, B. A., & Hume, K. (2012) · Cochrane Database of Systematic Reviews · doi:10.1002/14651858.cd009260.pub2 · Cited by 577
Mack, A. H. (2011) · Yearbook of Psychiatry and Applied Mental Health · doi:10.1016/j.ypsy.2010.11.009 · Cited by 500
(2009) · PubMed · Cited by 409
The prevalence of parent-reported autism spectrum disorder among US children
Kogan, M. D., Vladutiu, C. J., Schieve, L. A., Ghandour, R. M., Blumberg, S. J., Zablotsky, B., Perrin, J. M., Shattuck, P., Kuhlthau, K. A., Harwood, R. L., et al. (2018) · Pediatrics · doi:10.1542/peds.2017-4161 · Cited by 354 · cited 1×
“The 2016 NSCH and the 2015–2017 NHIS both estimated ASD prevalence at 25 per 1,000 children aged 3–17 years (13,29).”
BackgroundReichow, B., Hume, K., Barton, E. E., & Boyd, B. A. (2018) · Cochrane Database of Systematic Reviews · doi:10.1002/14651858.cd009260.pub3 · Cited by 350
Durkin, M. S., Maenner, M. J., Baio, J., Christensen, D., Daniels, J., Fitzgerald, R., Imm, P., Lee, L.-C., Schieve, L. A., Van Naarden Braun, K., et al. (2017) · American Journal of Public Health · doi:10.2105/ajph.2017.304032 · Cited by 347 · cited 2×
“In contrast to other developmental disabilities (12–15), the ADDM Network reported higher ASD prevalence among more socioeconomically advantaged groups and among children classified as non-Hispanic white (white) than among other groups (16,17).”
MethodResultSelf-citationNarzisi, A. (2020) · Brain Sciences · doi:10.3390/brainsci10040207 · Cited by 299
Van Naarden Braun, K., Christensen, D., Doernberg, N., Schieve, L., Rice, C., Wiggins, L., Schendel, D., & Yeargin-Allsopp, M. (2015) · PLOS ONE · doi:10.1371/journal.pone.0124120 · Cited by 292
Self-citationShaw, K. A., Maenner, M. J., Baio, J., EdS1, Washington, A., Christensen, D. L., Wiggins, L. D., Pettygrove, S., Andrews, J. G., White, T., et al. (2020) · MMWR. Surveillance Summaries · doi:10.15585/mmwr.ss6903a1 · Cited by 286
Self-citationRogers, S. J., Estes, A., Lord, C., Munson, J., Rocha, M., Winter, J., Greenson, J., Colombi, C., Dawson, G., Vismara, L. A., et al. (2019) · Journal of the American Academy of Child & Adolescent Psychiatry · doi:10.1016/j.jaac.2019.01.004 · Cited by 233
Maenner, M. J., Blumberg, S. J., Kogan, M. D., Christensen, D., Yeargin-Allsopp, M., & Schieve, L. A. (2016) · Annals of Epidemiology · doi:10.1016/j.annepidem.2016.01.001 · Cited by 209
Self-citationYeargin‐Allsopp, M., Oakley, G. P., Murphy, C. C., Sikes, R. K., & Staff, T. M. A. D. D. S. (1992) · PEDIATRICS · doi:10.1542/peds.89.4.624 · Cited by 158
Prevalence of Autism Spectrum Disorders in Hispanic and Non-Hispanic White Children
Pedersen, A. L., Pettygrove, S. D., Meaney, F. J., Mancilla, K. C., Gotschall, K., Kessler, D. B., Grebe, T. A., & Cunniff, C. M. (2012) · PEDIATRICS · doi:10.1542/peds.2011-1145 · Cited by 105 · cited 2×
“In contrast to other developmental disabilities (12–15), the ADDM Network reported higher ASD prevalence among more socioeconomically advantaged groups and among children classified as non-Hispanic white (white) than among other groups (16,17).”
BackgroundResultSelf-citationCumulative Incidence of Autism Into Adulthood for Birth Cohorts in Denmark, 1980-2012
Schendel, D. E., & Thorsteinsson, E. (2018) · JAMA · doi:10.1001/jama.2018.11328 · Cited by 101
Changes in autism spectrum disorder prevalence in 4 areas of the United States
Rice, C. E., Nicholas, J. S., Baio, J., Pettygrove, S. D., Lee, L.-C., Braun, K. V. N., Doernberg, N. S., Cunniff, C., Newschaffer, C. J., Meaney, F. J., et al. (2010) · Disability and health journal · doi:10.1016/j.dhjo.2009.10.008 · Cited by 83
Self-citationDurkin, M. S., Maenner, M. J., Benedict, R. E., Braun, K. V. N., Christensen, D., Kirby, R. S., Wingate, M. S., & Yeargin‐Allsopp, M. (2015) · Developmental Medicine & Child Neurology · doi:10.1111/dmcn.12746 · Cited by 58
Self-citationRelationship between Vitamin Deficiencies and Co-Occurring Symptoms in Autism Spectrum Disorder
Robea, M. A., Luca, A.-C., & Ciobica, A. S. (2020) · Medicina · doi:10.3390/medicina56050245 · Cited by 54
Forthun, I., Strandberg‐Larsen, K., Wilcox, A. J., Moster, D., Petersen, T. G., Vik, T., Lie, R. T., Uldall, P. V., & Tollånes, M. C. (2018) · International Journal of Epidemiology · doi:10.1093/ije/dyy139 · Cited by 51
Imm, P., White, T., & Durkin, M. S. (2019) · Autism · doi:10.1177/1362361319827510 · Cited by 35
Self-citationWiggins, L. D., Christensen, D., Braun, K. V. N., Martin, L., & Baio, J. (2018) · PLoS ONE · doi:10.1371/journal.pone.0208079 · Cited by 8
Self-citationBarbero (2014) · doi:10.1016/j · Cited by 1
Cited by
Sorted by citations
Global prevalence of autism: A systematic review update
Zeidan, J., Fombonne, E., Scorah, J., Ibrahim, A., Durkin, M. S., Saxena, S., Yusuf, A., Shih, A., & Elsabbagh, M. (2022) · Autism Research · doi:10.1002/aur.2696 · Cited by 3,117
Self-citationMaenner, M. J., Warren, Z., Williams, A. R., Amoakohene, E., Bakian, A. V., Bilder, D. A., Durkin, M. S., Fitzgerald, R. T., Furnier, S. M., Hughes, M. M., et al. (2023) · MMWR. Surveillance Summaries · doi:10.15585/mmwr.ss7202a1 · Cited by 2,706
“2 3 US Department of Health and Human Services/Centers for Disease Control and Prevention necessitate record review if those codes closely aligned with program-recommended ICD codes (11).”
BackgroundSelf-citationMaenner, M. J., Shaw, K. A., Bakian, A. V., Bilder, D. A., Durkin, M. S., Esler, A., Furnier, S. M., Hallas, L., Hall-Lande, J., Hudson, A., et al. (2021) · MMWR. Surveillance Summaries · doi:10.15585/mmwr.ss7011a1 · Cited by 1,818
“Recommended ICD codes were described previously (10).”
BackgroundMethodInfluentialSelf-citationIdentification, Evaluation, and Management of Children With Autism Spectrum Disorder
Hyman, S. L., Levy, S. E., Myers, S. M., COUNCIL ON CHILDREN WITH DISABILITIES, S. O. D. A. B. P., Kuo, D. Z., Apkon, S., Davidson, L. F., Ellerbeck, K. A., Foster, J. E. A., Noritz, G. H., et al. (2020) · Pediatrics · doi:10.1542/peds.2019-3447 · Cited by 1,798
Sex/Gender Differences and Autism: Setting the Scene for Future Research
Lai, M.-C., Lombardo, M. V., Auyeung, B., Chakrabarti, B., & Baron-Cohen, S. (2015) · Journal of the American Academy of Child & Adolescent Psychiatry · doi:10.1016/j.jaac.2014.10.003 · Cited by 1,120
Metadata
- Authors
- Maenner, M. J., Shaw, K. A., Baio, J., EdS1, Washington, A., Patrick, M., DiRienzo, M., Christensen, D. L., Wiggins, L. D., Pettygrove, S., Andrews, J. G., Lopez, M., Hudson, A., Baroud, T., Schwenk, Y., White, T., Rosenberg, C. R., Lee, L.-C., Harrington, R. A., Huston, M., Hewitt, A., PhD-7, Esler, A., Hall-Lande, J., Poynter, J. N., Hallas-Muchow, L., Constantino, J. N., Fitzgerald, R. T., Zahorodny, W., Shenouda, J., Daniels, J. L., Warren, Z., Vehorn, A., Salinas, A., Durkin, M. S., & Dietz, P. M.
- Affiliations
- Centers for Disease Control and Prevention (US)
- University of North Carolina at Chapel Hill (US)
- University of Arizona (US)
- University of Arkansas for Medical Sciences (US)
- Colorado Department of Public Health and Environment (US)
- Johns Hopkins University (US)
- University of Minnesota (US)
- Washington University in St. Louis (US)
- Rutgers New Jersey Medical School (US)
- University of Wisconsin–Madison (US)
- Corresponding author
- Maenner, Matthew J.
- ORCID
- Maenner, Matthew J.
- Shaw, Kelly A.
- Washington, Anita
- Patrick, Mary
- DiRienzo, Monica
- Wiggins, Lisa D.
- Pettygrove, Sydney
- Andrews, Jennifer G.
- Lopez, Maya
- Rosenberg, Cordelia Robinson
- Lee, Li-Ching
- Esler, Amy
- Poynter, Jenny N.
- Constantino, John N.
- Fitzgerald, Robert T.
- Zahorodny, Walter
- Shenouda, Josephine
- Daniels, Julie L.
- Warren, Zachary
- Durkin, Maureen S.
- Dietz, Patricia M.
- Venue
- MMWR. Surveillance Summaries
- Published
- 2020-03-27
- Volume
- 69
- Issue
- 4
- Pages
- 1-12
- ISSN
- 1545-8636 (ISSN-L)
- 1546-0738
- PMC
- PMC7119644
- OpenAlex
- W3027179734
- Semantic Scholar
- ddeb34dc450a7cdc9fd11cdb896b266be9fa1f05
- Cited by
- 3,780
- References
- 34
- Citations by year
- 2026: 107 · 2025: 199 · 2024: 335 · 2023: 473 · 2022: 732 · 2021: 904 · 2020: 393
- FWCI
- 336.19
- Type
- journal article
- Language
- en
- Open access
- diamond
- doi.org
- Licence
- public-domain
- Locations
- MMWR Surveillance Summaries (publishedVersion, public-domain)
- PubMed Central (publishedVersion, cc-by)
- PubMed (publishedVersion)
- UA Campus Repository (The University of Arizona) (acceptedVersion, public-domain)
- Funders
- Centers for Disease Control and Prevention
- Topics
- Life Sciences › Neuroscience › Cognitive Neuroscience › Autism Spectrum Disorder Research
- Health Sciences › Medicine › Psychiatry and Mental health › Child Nutrition and Feeding Issues
- Social Sciences › Psychology › Clinical Psychology › Family and Disability Support Research
- Keywords
- autism spectrum disorder, autism prevalence, sex differences, racial and ethnic disparities, intellectual disability, age at diagnosis, autism epidemiology, Black children, Hispanic children, white children, regional variation in prevalence, United States states and territories
- MeSH terms
- Autism Spectrum Disorder, Child, Female, Humans, Male, Population Surveillance, United States, Prevalence, Diagnostic and Statistical Manual of Mental Disorders
About these checks
Registry, retraction, Cites and statistics results are computed, not judged, with one exception: a printed reference that no index lists is read once by a model before it counts as a citation error. Claims are extracted by a model and kept only when their quote appears verbatim in the text; each cited source is then checked, with a model’s help, for whether it says what the claim relies on. Those verdicts can be wrong — read the claim’s quote and the cited source before relying on one.
Statistics and arithmetic are recomputed, not judged.
Confidence bands are shown only for fields calibrated on our annotated test set. None is calibrated yet, so no band is shown.
What counts as a claim ›How we measure confidence ›How we check this ›
Are you an author, or do you see a problem with this page? Request a review
