

The Oral Minimal Model Method
Open accessThe DOI matches its Crossref record; 48 of the 48 references it cites were found in a registry or an index.
Abstract
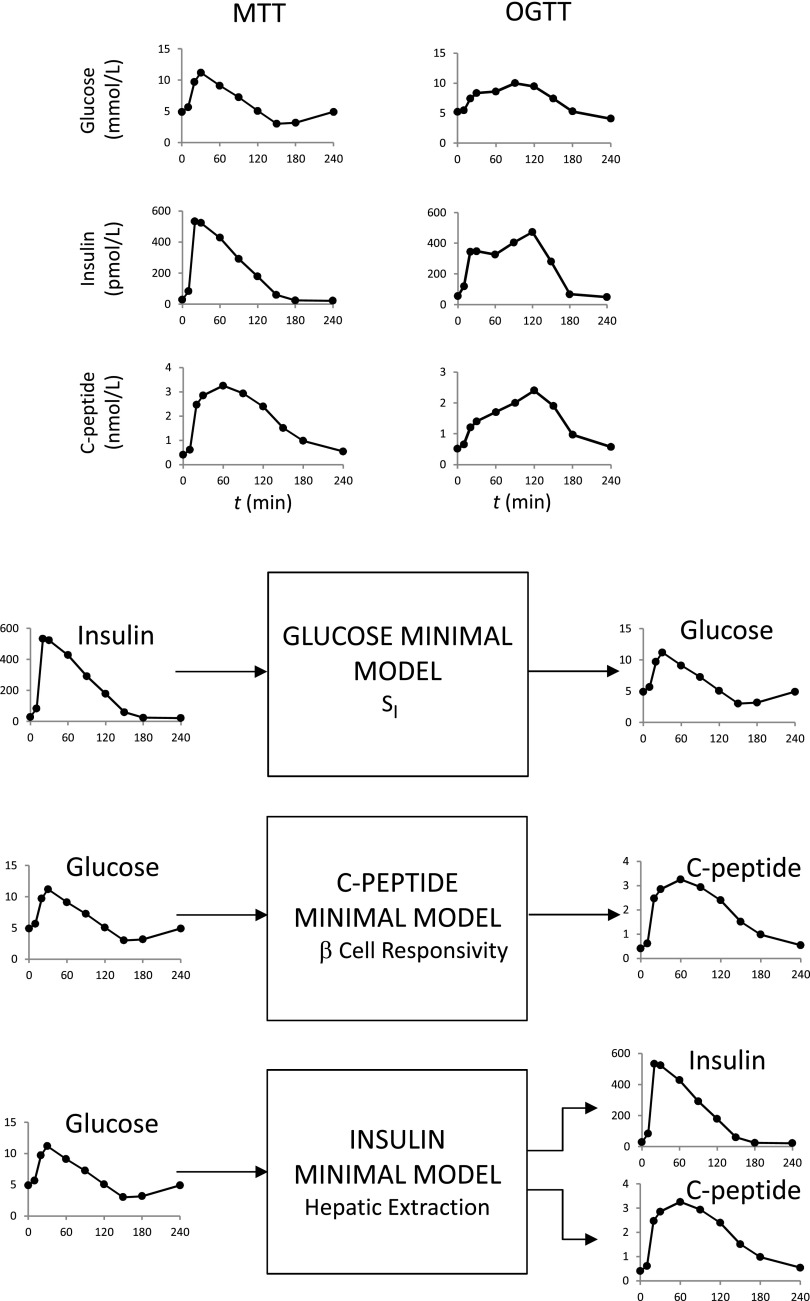
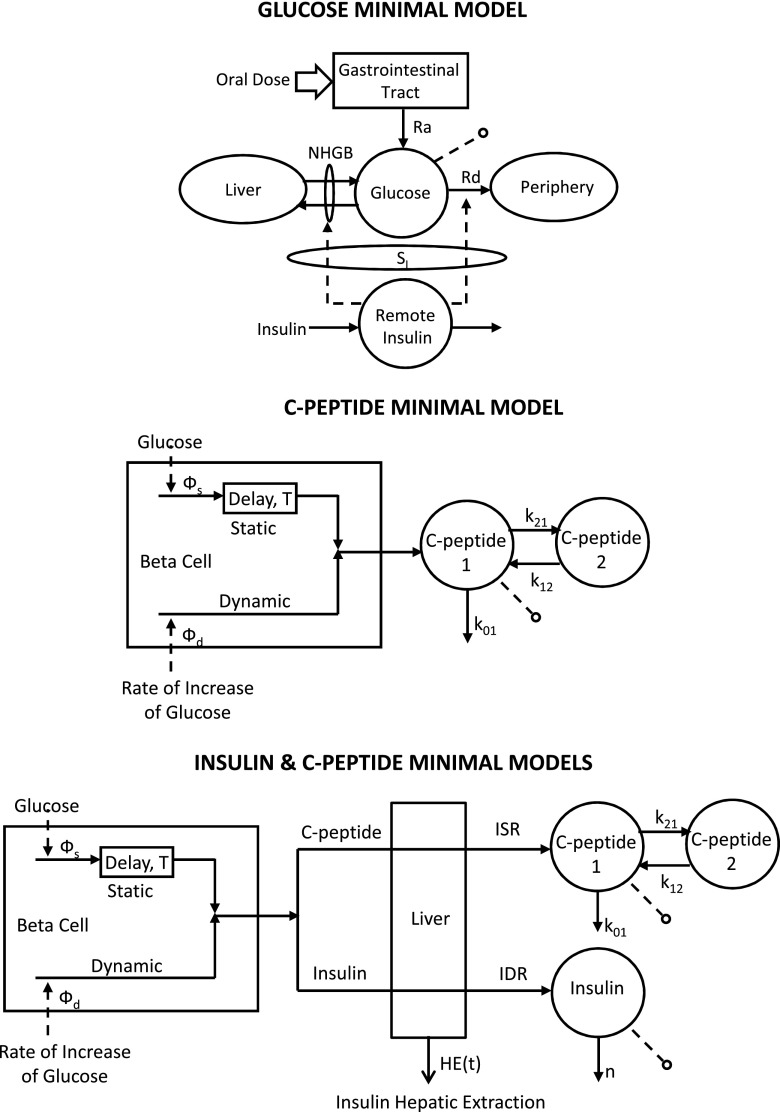
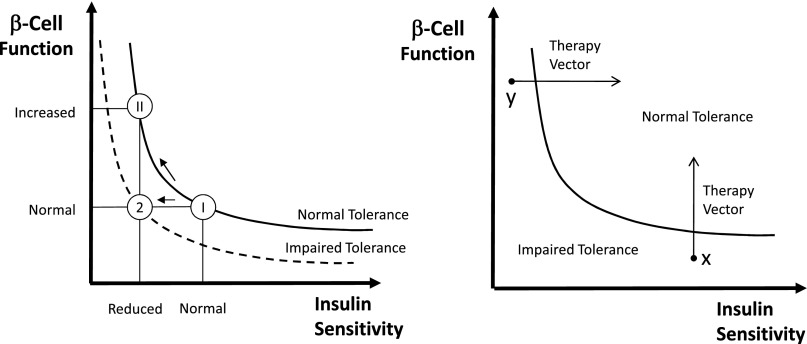
The simultaneous assessment of insulin action, secretion, and hepatic extraction is key to understanding postprandial glucose metabolism in nondiabetic and diabetic humans. We review the oral minimal method (i.e., models that allow the estimation of insulin sensitivity, β-cell responsivity, and hepatic insulin extraction from a mixed-meal or an oral glucose tolerance test). Both of these oral tests are more physiologic and simpler to administer than those based on an intravenous test (e.g., a glucose clamp or an intravenous glucose tolerance test). The focus of this review is on indices provided by physiological-based models and their validation against the glucose clamp technique. We discuss first the oral minimal model method rationale, data, and protocols. Then we present the three minimal models and the indices they provide. The disposition index paradigm, a widely used β-cell function metric, is revisited in the context of individual versus population modeling. Adding a glucose tracer to the oral dose significantly enhances the assessment of insulin action by segregating insulin sensitivity into its glucose disposal and hepatic components. The oral minimal model method, by quantitatively portraying the complex relationships between the major players of glucose metabolism, is able to provide novel insights regarding the regulation of postprandial metabolism.
Overview
The claims and statistics of this paper haven’t been checked yet.
Free: it reads the open-access text and checks the first 5 claims that cite a source we can check. Create a free account to check every claim.
Integrity signals
Registry
Cites
Statistics
Figures



Verification
Claims the paper makes
The claims and statistics of this paper haven’t been checked yet.
Free: it reads the open-access text and checks the first 5 claims that cite a source we can check. Create a free account to check every claim.
Claims other papers make about this one
Each is checked against this paper’s own text: does it say what the citing paper says it does?
The source backs part of the claim, not all of it — or backs it for a different population, condition or comparison.
In the citing paper
“Indeed, SI measured during an OGTT is highly correlated with glucose disposal measured during the euglycemic-hyperinsulinemic clamp technique (r = 0.70) [51].”
From Insulin sensitivity and pancreatic β-cell function in patients with primary aldosteronism (2021) · cites this paper as [51]
Experimental — accuracy not yet measured
Self-check
Percentages, sums and reported differences re-computed from the paper’s own numbers.
The self-check needs the paper’s full text.
Citations
Cites
Quantitative estimation of insulin sensitivity.
Bergman, R. N., Ider, Y. Z., Bowden, C. R., & Cobelli, C. (1979) · American Journal of Physiology-Endocrinology and Metabolism · doi:10.1152/ajpendo.1979.236.6.e667 · Cited by 1,874 · cited 2×
“(5), one obtains the following (14): (8)>>>< >>>: _ QðtÞ 1⁄4 2 1⁄2SG þ XðtÞ $QðtÞ þ SG$Qb þ Raða; tÞ Qð0Þ 1⁄4 Qb”
MethodSelf-citationBergman, R. N., Phillips, L. S., & Cobelli, C. (1981) · Journal of Clinical Investigation · doi:10.1172/jci110398 · Cited by 1,640 · cited 1×
“One possibility is to resort to a normalization of b-cell function based on the disposition index (DI) paradigm, first introduced in 1981 (28), and recently revisited first in Cobelli et al.”
MethodSelf-citationCauter, E. V., Mestrez, F., Sturis, J., & Polonsky, K. S. (1992) · Diabetes · doi:10.2337/diab.41.3.368 · Cited by 890
Cauter, E. V., Mestrez, F., Sturis, J., et al. (1992) · Diabetes · doi:10.2337/diabetes.41.3.368 · Cited by 643
DHEA in elderly women and DHEA or testosterone in elderly men.
Nair, K. S., Rizza, R. A., O'Brien, P., Dhatariya, K., Short, K. R., Nehra, A., Vittone, J. L., Klee, G. G., Basu, A., Basu, R., et al. (2006) · New England Journal of Medicine · doi:10.1056/nejmoa054629 · Cited by 566 · cited 1×
“For instance, the battery of oral glucose, C-peptide, and insulin models has been used to study the effect of age and sex on glucose metabolism (8), the effect of antiaging drugs (35), the influence of ethnicity (36), SI and b-cell function in nondiabetic (37) and obese (38) adolescents and children (39), the pathogen…”
MethodSelf-citationIncreased prevalence of insulin resistance and nonalcoholic fatty liver disease in Asian-Indian men
Petersen, K. F., Dufour, S., Feng, J., Befroy, D., Dziura, J., Man, C. D., Cobelli, C., & Shulman, G. I. (2006) · Proceedings of the National Academy of Sciences · doi:10.1073/pnas.0608537103 · Cited by 403 · cited 1×
“For instance, the battery of oral glucose, C-peptide, and insulin models has been used to study the effect of age and sex on glucose metabolism (8), the effect of antiaging drugs (35), the influence of ethnicity (36), SI and b-cell function in nondiabetic (37) and obese (38) adolescents and children (39), the pathogen…”
MethodSelf-citationEffects of Age and Sex on Postprandial Glucose Metabolism
Basu, R., Dalla Man, C., Campioni, M., Basu, A., Klee, G., Toffolo, G., Cobelli, C., & Rizza, R. A. (2006) · Diabetes · doi:10.2337/db05-1692 · Cited by 334
Self-citationOral Glucose Tolerance Test Minimal Model Indexes of β-Cell Function and Insulin Sensitivity
Breda, E., Cavaghan, M. K., Toffolo, G., Polonsky, K. S., & Cobelli, C. (2001) · Diabetes · doi:10.2337/diabetes.50.1.150 · Cited by 320
Self-citationCobelli, C., Toffolo, G. M., Man, C. D., Campioni, M., Denti, P., Caumo, A., Butler, P., & Rizza, R. (2007) · American Journal of Physiology-Endocrinology and Metabolism · doi:10.1152/ajpendo.00421.2006 · Cited by 311
Self-citationMeal and oral glucose tests for assessment of β-cell function: modeling analysis in normal subjects
Mari, A., Schmitz, O., Gastaldelli, A., Oestergaard, T., Nyholm, B., & Ferrannini, E. (2002) · American Journal of Physiology-Endocrinology and Metabolism · doi:10.1152/ajpendo.00093.2002 · Cited by 303
Research works printed but not linked: 1
- Cobelli, 1999, Minimal model SG overestimation and SI underestimation: improved accuracy by a Bayesian two-compartment model, Am J Physiol, 277, E481
Cited by
Temperature-Acclimated Brown Adipose Tissue Modulates Insulin Sensitivity in Humans
Lee, P., Smith, S., Linderman, J., Courville, A. B., Brychta, R. J., Dieckmann, W., Werner, C. D., Chen, K. Y., & Celi, F. S. (2014) · Diabetes · doi:10.2337/db14-0513 · Cited by 398
“Postprandial insulin sensitivity was calculated after a mixed meal (33) and adipose resistance index as the product of free fatty acid 3 insulin.”
MethodGlucose Variability: Timing, Risk Analysis, and Relationship to Hypoglycemia in Diabetes
Kovatchev, B., & Cobelli, C. (2016) · Diabetes Care · doi:10.2337/dc15-2035 · Cited by 255
Self-citationQian, J., Dalla Man, C., Morris, C. J., Cobelli, C., & Scheer, F. A. J. L. (2018) · Diabetes, Obesity and Metabolism · doi:10.1111/dom.13391 · Cited by 170
Self-citationKunz, H., Hart, C. R., Gries, K. J., Parvizi, M., LAURENTI, M. C., Man, C. D., Moore, N., Zhang, X., Ryan, Z., Polley, E. C., et al. (2021) · American Journal of Physiology-Endocrinology and Metabolism · doi:10.1152/ajpendo.00070.2021 · Cited by 189
Self-citationvan Stee, M. F., de Graaf, A. A., & Groen, A. K. (2018) · Cardiovascular Diabetology · doi:10.1186/s12933-018-0738-4 · Cited by 145
Equine hyperinsulinemia: investigation of the enteroinsular axis during insulin dysregulation
de Laat, M. A., McGree, J. M., & Sillence, M. N. (2015) · American Journal of Physiology-Endocrinology and Metabolism · doi:10.1152/ajpendo.00362.2015 · Cited by 152
“Thus, a significant amount of orally administered D-glucose was either not absorbed or, as is the case in other species, was substantially removed during its first pass through the liver before reaching the systemic circulation (12, 25).”
Backgroundβ-Cell function in type 2 diabetes
Ferrannini, E., & Mari, A. (2014) · Metabolism · doi:10.1016/j.metabol.2014.05.012 · Cited by 164
Konopka, A. R., Asante, A., Lanza, I. R., Robinson, M. M., Johnson, M. L., Dalla Man, C., Cobelli, C., Amols, M. H., Irving, B. A., & Nair, K. S. (2015) · Diabetes · doi:10.2337/db14-1701 · Cited by 112
“Net insulin action was determined from the insulin sensitivity index using the oral minimal model (23).”
MethodSelf-citationGlucose metabolism during rotational shift-work in healthcare workers
Sharma, A. R., LAURENTI, M. C., Man, C. D., Varghese, R. T., Cobelli, C., Rizza, R. A., Matveyenko, A. V., & Vella, A. V. (2017) · Diabetologia · doi:10.1007/s00125-017-4317-0 · Cited by 128
“This agrees with our current findings, although insulin concentrations are a poor surrogate of insulin secretion because they represent the end result of insulin secretion and hepatic insulin extraction [21].”
InfluentialSelf-citationCropano, C. M., Santoro, N., Groop, L., Man, C. D., Cobelli, C., Galderisi, A., Kursawe, R., Pierpont, B. M., Goffredo, M., & Caprio, S. (2017) · Diabetes Care · doi:10.2337/dc17-0290 · Cited by 103
Self-citationHDL and glucose metabolism: current evidence and therapeutic potential
Siebel, A. L., Heywood, S. E., & Kingwell, B. A. (2015) · Frontiers in Pharmacology · doi:10.3389/fphar.2015.00258 · Cited by 104
“Future clinical studies utilizing stable isotope tracers and minimal modeling techniques (Cobelli et al., 2014) are warranted to more directly characterize the effects of HDL on postprandial insulin secretion and glucose metabolism.”
BackgroundHannon, T. S., Kahn, S. E., Utzschneider, K. M., Buchanan, T. A., Nadeau, K. J., Zeitler, P. S., Ehrmann, D. A., Arslanian, S. A., Caprio, S., Edelstein, S. L., et al. (2018) · Diabetes, Obesity and Metabolism · doi:10.1111/dom.13005 · Cited by 87
Lee, Y.-M., Ha, C.-M., Kim, S.-A., Thoudam, T., Yoon, Y.-R., Kim, D.-J., Kim, H.-C., Moon, H.-B., Park, S., Lee, I.-K., et al. (2017) · Diabetes · doi:10.2337/db17-0188 · Cited by 74
“8 average static second-phase secretion of insulin per unit over basal average glucose, which is used to assess the appropriateness of insulin secretion for a given glucose level (20).”
Shankar, S. S., Vella, A. V., Raymond, R. H., Staten, M. A., Calle, R. A., Bergman, R. N., Cao, C., Chen, D., Cobelli, C., Man, C. D., et al. (2016) · Diabetes Care · doi:10.2337/dc15-0931 · Cited by 77
“This is the basis of the minimal model as applied to data obtained from an intravenous (frequently sampled intravenous glucose tolerance test [FSIGT]) or oral challenge (mixedmeal tolerance test [MMTT] or oral glucose tolerance test [OGTT]) (10,11).”
MethodSelf-citationLifestyle Intervention Strategy to Treat Diabetes in Older Adults: A Randomized Controlled Trial
Celli, A., Barnouin, Y., Jiang, B. C., Blevins, D., Colleluori, G., Mediwala, S. N., Armamento‐Villareal, R., Qualls, C., & Villareal, D. T. (2022) · Diabetes Care · doi:10.2337/dc22-0338 · Cited by 92
Taylor, R., Barnes, A. C., Hollingsworth, K. G., Irvine, K. M., Solovyova, A. S., Clark, L., Kelly, T., Martin-Ruiz, C., Romeres, D., Koulman, A., et al. (2023) · Clinical Science · doi:10.1042/cs20230586 · Cited by 71
“Indices of insulin sensitivity (SI) and insulin secretion normalised to insulin sensitivity (DI) were estimated by mathematical modelling [15] after a standard meal of ordinary foodstuffs (587 kcal; 65% carbohydrate, 13% protein and 19% fat) following an overnight fast.”
Self-citationMari, A., Tura, A., Grespan, E., & Bizzotto, R. (2020) · Frontiers in Physiology · doi:10.3389/fphys.2020.575789 · Cited by 80
Hyperglucagonemia Mitigates the Effect of Metformin on Glucose Production in Prediabetes
Konopka, A. R., Esponda, R. R., Robinson, M. M., Johnson, M. L., Carter, R. E., Schiavon, M., Cobelli, C., Wondisford, F. E., Lanza, I. R., & Nair, K. S. (2016) · Cell Reports · doi:10.1016/j.celrep.2016.04.024 · Cited by 67
“Mixed Meal Tolerance Test Insulin sensitivity (SI); total, dynamic, and static b cell responsivity (F, FD, and FS); and DIs (DID and DIS) were modeled after a mixed meal (600 kcal; 30% carbohydrate, 55% fat, and 15% protein) (Cobelli et al., 2014).”
Self-citationOxytocin Improves β-Cell Responsivity and Glucose Tolerance in Healthy Men
Klement, J., Ott, V., Rapp, K., Brede, S., Piccinini, F., Cobelli, C., Lehnert, H., & Hallschmid, M. (2016) · Diabetes · doi:10.2337/db16-0569 · Cited by 80
Self-citationType 2 diabetes: one disease, many pathways
Ha, J., & Sherman, A. (2020) · American Journal of Physiology-Endocrinology and Metabolism · doi:10.1152/ajpendo.00512.2019 · Cited by 70
Impaired insulin signaling in unaffected siblings and patients with first-episode psychosis
Chouinard, V., Henderson, D. C., Man, C. D., Valeri, L., Gray, B. E., Ryan, K. P., Cypess, A. M., Cobelli, C., Cohen, B. M., & Öngür, D. (2018) · Molecular Psychiatry · doi:10.1038/s41380-018-0045-1 · Cited by 72
Self-citationTCF7L2 Genotype and α-Cell Function in Humans Without Diabetes
Shah, M., Varghese, R. T., Miles, J. M., Piccinini, F., Dalla Man, C., Cobelli, C., Bailey, K. R., Rizza, R. A., & Vella, A. (2016) · Diabetes · doi:10.2337/db15-1233 · Cited by 57
“The dynamic component of b-cell responsivity to glucose (believed to represent the secretion of preformed insulin secretory granules in response to rising glucose concentrations) as well as total b-cell responsivity (5) was slightly, but significantly decreased in the TT group (Fig.”
BackgroundSelf-citationThree hours of intermittent hypoxia increases circulating glucose levels in healthy adults
Newhouse, L. P., Joyner, M. J., Curry, T. B., LAURENTI, M. C., Man, C. D., Cobelli, C., Vella, A. V., & Limberg, J. K. (2017) · Physiological Reports · doi:10.14814/phy2.13106 · Cited by 56
“Following the 3-h protocol, participants placed their nondominant hand with a retro-grade intravenous catheter into a heated plexiglass box maintained at 55°C for collection of “arterialized” venous blood (Cobelli et al. 2014).”
MethodSelf-citationNath, A., Deb, D., Dey, R., & Das, S. (2018) · IET Systems Biology · doi:10.1049/iet-syb.2017.0093 · Cited by 57
Javed, A., Vella, A. V., Balagopal, P., Fischer, P. R., Weaver, A. L., Piccinini, F., Man, C. D., Cobelli, C., Giesler, P. D., Laugen, J. M., et al. (2014) · Journal of Nutrition · doi:10.3945/jn.114.202010 · Cited by 71
Self-citationO’Donovan, S. D., Lenz, M., Goossens, G. H., Kallen, C., Eussen, S. J. P. M., Stehouwer, C. D. A., van Greevenbroek, M. M. J., Schram, M. T., Sep, S. J. S., Peeters, R., et al. (2019) · Scientific Reports · doi:10.1038/s41598-019-45858-w · Cited by 52
Schiavon, M., Visentin, R., Göbel, B., Riz, M., Cobelli, C., Klabunde, T., & Dalla Man, C. (2021) · Diabetes, Obesity and Metabolism · doi:10.1111/dom.14394 · Cited by 49
Self-citationVersteeg, R. I., Stenvers, D. J., Visintainer, D., Linnenbank, A. C., Tanck, M. W. T., Zwanenburg, G., Smilde, A. K., Fliers, E., Kalsbeek, A., Serlie, M. J. M., et al. (2017) · Journal of Biological Rhythms · doi:10.1177/0748730417693480 · Cited by 52
“The C-peptide minimal model outputs are the static time constant kg that represents the amount of secreted C-peptide per minute for a certain plasma glucose level above the static glucose threshold h and the dynamic constant kd that represents the amount of secreted C-peptide induced by the change in plasma glucose (E…”
Siebel, A. L., Trinh, S. K., Formosa, M. F., Mundra, P. A., Natoli, A. K., Reddy-Luthmoodoo, M., Huynh, K., Khan, A. A., Carey, A. L., van Hall, G., et al. (2016) · Metabolism · doi:10.1016/j.metabol.2016.03.002 · Cited by 50
Self-citationKowalski, G. M., Kloehn, J., Burch, M. L., Selathurai, A., Hamley, S., Bayol, S. A., Lamon, S., Watt, M. J., Lee, R. S., McConville, M. J., et al. (2014) · Biochimica et Biophysica Acta (BBA) - Molecular and Cell Biology of Lipids · doi:10.1016/j.bbalip.2014.12.002 · Cited by 49
Kalman Smoothing for Objective and Automatic Preprocessing of Glucose Data
Staal, O. M., Salid, S., Fougner, A. L., & Stavdahl, Ø. (2018) · IEEE Journal of Biomedical and Health Informatics · doi:10.1109/jbhi.2018.2811706 · Cited by 40
“The models range from minimal [19], [20], via intermediate complexity [21]– [24] to maximal models [25], [26].”
BackgroundPurnell, J. Q., Johnson, G., Wahed, A. S., Man, C. D., Piccinini, F., Cobelli, C., Prigeon, R. L., Goodpaster, B. H., Kelley, D. E., Staten, M. A., et al. (2018) · Diabetologia · doi:10.1007/s00125-018-4553-y · Cited by 43
“Modelling for insulin secretory response and insulin sensitivity Insulin sensitivity (SI), beta cell responsivity to glucose (Φ; measured as Φ total, Φ basal, Φ dynamic and Φ static) and hepatic insulin extraction (HE basal and HE total) were determined during theMMas previously described [14].”
Self-citationde Goede, P., Foppen, E., Ritsema, W. I. G. R., Korpel, N. L., Yi, C., & Kalsbeek, A. (2019) · Frontiers in Endocrinology · doi:10.3389/fendo.2019.00554 · Cited by 44
Goff, L. M., Ladwa, M., Hakim, O., & Bello, O. (2019) · Proceedings of The Nutrition Society · doi:10.1017/s0029665119001034 · Cited by 44
Reinforcement Learning Models and Algorithms for Diabetes Management
Yau, K. A., Chong, Y.-W., Fan, X., Wu, C., Saleem, Y., & Lim, P.-C. (2023) · IEEE Access · doi:10.1109/access.2023.3259425 · Cited by 51
“of ordinary and partial equations [44] to characterize the dynamics of the operating environment, particularly the time-varying physiological characteristics, such as the glucose, glucagon, and insulin”
BackgroundVisentin, R., Schiavon, M., Göbel, B., Riz, M., Cobelli, C., Klabunde, T., & Dalla Man, C. (2020) · Diabetes, Obesity and Metabolism · doi:10.1111/dom.13939 · Cited by 37
Self-citationGalderisi, A., Giannini, C., Name, M. A. V., & Caprio, S. (2019) · The Journal of Clinical Endocrinology & Metabolism · doi:10.1210/jc.2019-00161 · Cited by 41
Hinshaw, L., Schiavon, M., Mallad, A., Man, C. D., Basu, R., Bharucha, A. E., Cobelli, C., Carter, R. E., Basu, A., & Kudva, Y. C. (2014) · American Journal of Physiology-Endocrinology and Metabolism · doi:10.1152/ajpendo.00199.2014 · Cited by 35
Self-citationImpaired Insulin Action Is Associated With Increased Glucagon Concentrations in Nondiabetic Humans
Sharma, A., Varghese, R. T., Shah, M., Man, C. D., Cobelli, C., Rizza, R. A., Bailey, K. R., & Vella, A. (2018) · The Journal of Clinical Endocrinology & Metabolism · doi:10.1210/jc.2017-01197 · Cited by 35
Self-citationMethods for Measuring Risk for Type 2 Diabetes in Youth: the Oral Glucose Tolerance Test (OGTT)
Chen, M. E., Aguirre, R. S., & Hannon, T. S. (2018) · Current Diabetes Reports · doi:10.1007/s11892-018-1023-3 · Cited by 41
Lim, M. H., Lee, W. H., Jeon, B., & Kim, S. (2021) · IEEE Access · doi:10.1109/access.2021.3100007 · Cited by 47
“Several physiological and mathematical models [5]– [8]. have been proposed.”
BackgroundEffect of Slow Wave Sleep Disruption on Metabolic Parameters in Adolescents
Shaw, N. D., McHill, A. W., Schiavon, M., Kangarloo, T., Mankowski, P. W., Cobelli, C., Klerman, E. B., & Hall, J. E. (2016) · SLEEP · doi:10.5665/sleep.6028 · Cited by 35
Self-citationSharma, N., Sajuthi, S. P., Chou, J. W., Calles-Escandón, J., Demons, J. L., Rogers, S. D., Ma, L., Palmer, N. D., McWilliams, D. R., Beal, J., et al. (2016) · The Journal of Clinical Endocrinology & Metabolism · doi:10.1210/jc.2015-3336 · Cited by 38
Assessment of individual and standardized glucagon kinetics in healthy humans
LAURENTI, M. C., Vella, A. V., Adams, J. D., Wismayer, D. S., Egan, A. M., & Man, C. D. (2020) · American Journal of Physiology-Endocrinology and Metabolism · doi:10.1152/ajpendo.00488.2020 · Cited by 28
Self-citationA Modular Safety System for an Insulin Dose Recommender: A Feasibility Study
Liu, C., Avari, P., Leal, Y., Wos, M., Sivasithamparam, K., Georgiou, P., Reddy, M., Fernández-Real, J., Martin, C. E., Fernández-Balsells, M., et al. (2019) · Journal of Diabetes Science and Technology · doi:10.1177/1932296819851135 · Cited by 25
YADAV, Y. R., Dunagan, K. T., Khot, R., Venkatesh, S. K., Port, J. D., Galderisi, A., Cobelli, C., Wegner, C. D., Basu, A., Carter, R. E., et al. (2022) · Diabetes Obesity and Metabolism · doi:10.1111/dom.14646 · Cited by 29
Self-citationMorrison, D., Kowalski, G. M., Grespan, E., Mari, A., Bruce, C. R., & Wadley, G. D. (2018) · American Journal of Physiology-Endocrinology and Metabolism · doi:10.1152/ajpendo.00316.2017 · Cited by 28
“, tracer clamp approach (3, 10)], thus permitting accurate determination of meal Ra, EGP, and Rd.”
Chen, M. E., Chandramouli, A. G., Considine, R. V., Hannon, T. S., & Mather, K. J. (2018) · Diabetes Care · doi:10.2337/dc17-1373 · Cited by 26
“single input via the ingested glucose dose, modeling a monophasic glucose time course (3).”
BackgroundMethodQuantifying beta cell function in the preclinical stages of type 1 diabetes
Galderisi, A., Carr, A. L. J., Martino, M., Taylor, P., Senior, P. A., & Dayan, C. M. (2023) · Diabetologia · doi:10.1007/s00125-023-06011-5 · Cited by 32
“…the secretion of readily releasable insulin, which is stimulated by the rate of increase in glucose concentration ( 𝜑 dynamic ), and a static component, which measures new insulin production in response to a given increment in glucose above basal concentrations ( 𝜑 static ) [77, 83, 86].”
BackgroundMethodAdams, J. D., Man, C. D., LAURENTI, M. C., Andrade, M. D. H., Cobelli, C., Rizza, R. A., Bailey, K. R., & Vella, A. V. (2020) · Metabolism · doi:10.1016/j.metabol.2020.154175 · Cited by 26
Self-citationLinear Model Identification for Personalized Prediction and Control in Diabetes
Faccioli, S., Facchinetti, A., Sparacino, G., Pillonetto, G., & Favero, S. D. (2021) · IEEE Transactions on Biomedical Engineering · doi:10.1109/tbme.2021.3101589 · Cited by 30
Association Between Thyrotropin Levels and Insulin Sensitivity in Euthyroid Obese Adolescents
Javed, A., Balagopal, P., Vella, A. V., Fischer, P. R., Piccinini, F., Man, C. D., Cobelli, C., Giesler, P. D., Laugen, J. M., & Kumar, S. (2015) · Thyroid · doi:10.1089/thy.2015.0005 · Cited by 28
“The model assumes that b-cell responsiveness (utotal) is composed of two parts: a dynamic component (ud), which is proportionate to the rate of rise of glucose; and a static component (us) that represents the response to the increment in glucose above the basal concentration (10,22,24).”
Self-citationOhashi, K., Fujii, M., Uda, S., Kubota, H., Komada, H., Sakaguchi, K., Ogawa, W., & Kuroda, S. (2018) · npj Systems Biology and Applications · doi:10.1038/s41540-018-0051-6 · Cited by 26
Galderisi, A., Moran, A., Evans‐Molina, C., Martino, M., Santoro, N., Caprio, S., & Cobelli, C. (2021) · The Journal of Clinical Endocrinology & Metabolism · doi:10.1210/clinem/dgab344 · Cited by 28
Self-citationFabris, C., Nass, R. M., Pinnata, J., Carr, K., Koravi, C. L. K., Barnett, C. L., Oliveri, M. C., Anderson, S. M., Cherñavvsky, D. R., & Breton, M. D. (2020) · Diabetes Care · doi:10.2337/dc19-1675 · Cited by 24
Diabetes-associated genetic variation in TCF7L2 alters pulsatile insulin secretion in humans
LAURENTI, M. C., Man, C. D., Varghese, R. T., Andrews, J. C., Rizza, R. A., Matveyenko, A. V., Nicolao, G. D., Cobelli, C., & Vella, A. V. (2020) · JCI Insight · doi:10.1172/jci.insight.136136 · Cited by 23
Self-citationFuzzy type-2 fractional Backstepping blood glucose control based on sliding mode observer
Heydarinejad, H., Delavari, H., & Bǎleanu, D. (2018) · International Journal of Dynamics and Control · doi:10.1007/s40435-018-0445-8 · Cited by 23
VISENTIN, R., Man, C. D., Basu, R., Basu, A., Rizza, R. A., & Cobelli, C. (2015) · American Journal of Physiology-Endocrinology and Metabolism · doi:10.1152/ajpendo.00358.2014 · Cited by 23
Self-citationRuan, Y., Willemsen, R. H., Wilinska, M. E., Tauschmann, M., Dunger, D. B., & Hovorka, R. (2019) · Pediatric Diabetes · doi:10.1111/pedi.12816 · Cited by 21
Kohlenberg, J. D., LAURENTI, M. C., Egan, A. M., Wismayer, D. S., Bailey, K. R., Cobelli, C., Man, C. D., & Vella, A. V. (2022) · Diabetologia · doi:10.1007/s00125-022-05794-3 · Cited by 25
Self-citationInsulin sensitivity and pancreatic β-cell function in patients with primary aldosteronism
Grewal, S., Fosam, A., Chalk, L., Deven, A., Suzuki, M., Correa, R. R., Blau, J. E., Demidowich, A. P., Stratakis, C. A., & Muniyappa, R. (2021) · Endocrine · doi:10.1007/s12020-020-02576-y · Cited by 20
Lytrivi, M., Cauduro, C. G. D. S., Kibanda, J., Kristanto, P., Paesmans, M., & Cnop, M. (2023) · American Journal of Clinical Nutrition · doi:10.1016/j.ajcnut.2023.07.018 · Cited by 21
Shah, M., LAURENTI, M. C., Man, C. D., Ma, J., Cobelli, C., Rizza, R. A., & Vella, A. V. (2018) · Metabolism · doi:10.1016/j.metabol.2018.12.005 · Cited by 22
Self-citationCobelli, C., & Man, C. D. (2021) · Journal of Diabetes Science and Technology · doi:10.1177/19322968211015268 · Cited by 24
“35 35-37 Here, we discuss the oral minimal model method, 35 that is, models that allow the estimation of insulin sensitivity, beta-cell function and hepatic insulin extraction from an oral glucose test, either a mixed meal (MTT) or an oral glucose (OGTT) tolerance test.”
BackgroundMethodSelf-citationYet Another Glucose Variability Index: Time for a Paradigm Change?
Cobelli, C., & Facchinetti, A. (2018) · Diabetes Technology & Therapeutics · doi:10.1089/dia.2017.0397 · Cited by 22
“20 In this commentary, we call for a paradigm change and argue that techniques known in mathematics for decades can be very beneficial to assess the amplitude and timing components of GV. GV can help to better evaluate new medications, which specifically target restoration of normal BG fluctuations on…”
Self-citationRevisiting the Pattern of Loss of β-Cell Function in Preclinical Type 1 Diabetes
Martino, M., Galderisi, A., Evans‐Molina, C., & Dayan, C. M. (2024) · Diabetes · doi:10.2337/db24-0163 · Cited by 21
Measurement of Pulsatile Insulin Secretion: Rationale and Methodology
LAURENTI, M. C., Matveyenko, A. V., & Vella, A. V. (2021) · Metabolites · doi:10.3390/metabo11070409 · Cited by 23
“On the other hand, C-peptide has been widely used to estimate total insulin secretion [60,64,65], but its use in pulse investigation is historically limited [66].”
BackgroundSelf-citationShedding light on grey noise in diabetes modelling
Mansell, E. J., Docherty, P. D., & Chase, J. G. (2016) · Biomedical Signal Processing and Control · doi:10.1016/j.bspc.2016.06.007 · Cited by 23
In vivo and in silico dynamics of the development of Metabolic Syndrome
Wesseling-Rozendaal, Y. J. W., Wang, Y., Paalvast, Y., Tambyrajah, L. L., Li, Z., van Dijk, K. W., Rensen, P. C. N., Kuivenhoven, J. A., Groen, A. K., Hilbers, P. A. J., et al. (2018) · PLoS Computational Biology · doi:10.1371/journal.pcbi.1006145 · Cited by 21
When does diabetes start? Early detection and intervention in type 2 diabetes mellitus
Peralta, F. G., Abreu, C., Cos, X., & Gómez‐Huelgas, R. (2020) · Revista Clínica Española (English Edition) · doi:10.1016/j.rceng.2019.12.004 · Cited by 26
Agrinier, A.-L., Morissette, A., Daoust, L., Gignac, T., Marois, J., Varin, T. V., Pilon, G., Larose, É., Gagnon, C., Desjardins, Y., et al. (2024) · Cell Reports Medicine · doi:10.1016/j.xcrm.2024.101682 · Cited by 27
Intranasal oxytocin fails to acutely improve glucose metabolism in obese men
Brede, S., Fehr, S., Man, C. D., Cobelli, C., Lehnert, H., Hallschmid, M., & Klement, J. (2018) · Diabetes Obesity and Metabolism · doi:10.1111/dom.13527 · Cited by 18
Self-citationFabris, C., Özaslan, B., & Breton, M. D. (2019) · Sensors · doi:10.3390/s19245386 · Cited by 20
On behalf of the KIND-LM study investigators, Tanaka, K., Saisho, Y., Manesso, E., Tanaka, M., Meguro, S., Irie, J., Sugiura, H., Kawai, T., Jinzaki, M., et al. (2015) · Clinical Drug Investigation · doi:10.1007/s40261-015-0331-5 · Cited by 20
Self-citationA Systematic Review of Beta Cell Function in Adults of Black African Ethnicity
Ladwa, M., Hakim, O., Amiel, S. A., & Goff, L. M. (2019) · Journal of Diabetes Research · doi:10.1155/2019/7891359 · Cited by 201
“Each method has its strengths and limitations; for example, oral glucose and mixed meal tests are highly physiological while intravenous techniques allow specific assessment of the beta cell by excluding the modulating effect of the incretin hormones [18, 19].”
MethodHa, J., Chung, S. T., Springer, M., Kim, J. Y., Chen, P., Chhabra, A., Cree‐Green, M., Behn, C. D., Sumner, A. E., Arslanian, S. A., et al. (2023) · American Journal of Physiology-Endocrinology and Metabolism · doi:10.1152/ajpendo.00189.2023 · Cited by 21
Galderisi, A., Sims, E. K., Evans‐Molina, C., Petrelli, A., Cuthbertson, D. D., Nathan, B. M., Ismail, H. M., Herold, K. C., & Moran, A. (2024) · Diabetologia · doi:10.1007/s00125-024-06323-0 · Cited by 21
Ruetten, H., Gebauer, M., Raymond, R. H., Calle, R. A., Cobelli, C., Ghosh, A., Robertson, R. P., Shankar, S. S., Staten, M. A., Stefanovski, D., et al. (2018) · Metabolic Syndrome and Related Disorders · doi:10.1089/met.2018.0022 · Cited by 17
Self-citationRegenerative Medicine in Diabetes
Matveyenko, A. V., & Vella, A. V. (2015) · Mayo Clinic Proceedings · doi:10.1016/j.mayocp.2015.01.019 · Cited by 21
Self-citationHuman Physiology of Genetic Defects Causing Beta-cell Dysfunction
Kettunen, J. L. T., & Tuomilehto, J. (2020) · Journal of Molecular Biology · doi:10.1016/j.jmb.2019.12.038 · Cited by 23
“Some limitations and undermodeling of the minimal model can be overcome by replacing insulin measurements with C-peptide or using both combined (discussed in Cobelli et al [36]).”
MethodMechanisms Underlying the Pathogenesis of Isolated Impaired Glucose Tolerance in Humans
Varghese, R. T., Man, C. D., Sharma, A. R., Viegas, I., Barosa, C., Marques, C., Shah, M., Miles, J. M., Rizza, R. A., Jones, J. G., et al. (2016) · The Journal of Clinical Endocrinology & Metabolism · doi:10.1210/jc.2016-1998 · Cited by 17
Self-citationLiver triacylglycerol content and gestational diabetes: effects of moderate energy restriction
Hodson, K., Dalla Man, C., Smith, F. E., Barnes, A., McParlin, C., Cobelli, C., Robson, S. C., Araújo-Soares, V., & Taylor, R. (2017) · Diabetologia · doi:10.1007/s00125-016-4143-9 · Cited by 16
“Beta cell insulin secretion was calculated from the oral Cpeptide minimal model [24, 25].”
MethodSelf-citationAdams, J. D., & Vella, A. V. (2018) · Metabolic Syndrome and Related Disorders · doi:10.1089/met.2018.0024 · Cited by 20
Self-citationHypoglycemia Prevention via Personalized Glucose-Insulin Models Identified in Free-Living Conditions
Toffanin, C., Aiello, E. M., Cobelli, C., & Magni, L. (2019) · Journal of Diabetes Science and Technology · doi:10.1177/1932296819880864 · Cited by 16
Self-citationVieira‐Lara, M. A., Reijne, A. C., Koshian, S., Čiapaitė, J., Abegaz, F., Talarovičová, A., van Dijk, T. H., Versloot, C. J., Bandsma, R., Wolters, J. C., et al. (2023) · Diabetes · doi:10.2337/db22-0746 · Cited by 17
A Hepatocyte FOXN3-α Cell Glucagon Axis Regulates Fasting Glucose
Karanth, S., Adams, J. D., Serrano, M. D. L. Á., Quittner-Strom, E. B., Simcox, J., Villanueva, C. J., Özcan, L., Holland, W. L., Yost, H. J., Vella, A. V., et al. (2018) · Cell Reports · doi:10.1016/j.celrep.2018.06.039 · Cited by 17
“We genotyped subjects at the rs8004664 using a TaqMan SNP Genotyping Assay (Applied Biosystems assay ID C_29386020_10) and performed oral glucose tolerance testing after obtaining informed written consent (Cobelli et al., 2014; Dalla Man et al., 2005).”
MethodSelf-citationVella, A., Sathananthan, M., Ikramuddin, S., Swain, J., Shah, M., Piccinini, F., Dalla Man, C., Cobelli, C., Rizza, R., & Camilleri, M. (2014) · Diabetes, Metabolic Syndrome and Obesity: Targets and Therapy · doi:10.2147/dmso.s65733 · Cited by 15
Self-citationVarghese, R. T., Man, C. D., LAURENTI, M. C., Piccinini, F., Sharma, A. R., Shah, M., Bailey, K. R., Rizza, R. A., Cobelli, C., & Vella, A. V. (2017) · Diabetes Obesity and Metabolism · doi:10.1111/dom.13106 · Cited by 15
Self-citationHuang, R., Yin, S., Ye, Y., Chen, N., Luo, S., Xia, M., & Zhao, L. (2020) · Diabetes Care · doi:10.2337/dc19-2432 · Cited by 16
The relationship between dietary fat intake, impulsive choice, and metabolic health
Steele, C. C., Steele, T. J., Gwinner, M., Rosenkranz, S. K., & Kirkpatrick, K. (2021) · Appetite · doi:10.1016/j.appet.2021.105292 · Cited by 17
Effect of a GLP-1 mimetic on the insulin response to oral sugar testing in horses
Stefanovski, D., Robinson, M. A., & Eps, A. W. V. (2022) · BMC Veterinary Research · doi:10.1186/s12917-022-03394-2 · Cited by 16
Galderisi, A., Tricò, D., Pierpont, B. M., Shabanova, V., Samuels, S. L., Man, C. D., Galuppo, B., Santoro, N., & Caprio, S. (2020) · Diabetes Care · doi:10.2337/dc20-0445 · Cited by 17
Bartlette, K., Carreau, A., Xie, D., Garcia‐Reyes, Y., Rahat, H., Pyle, L. L., Nadeau, K. J., Cree‐Green, M., & Behn, C. D. (2021) · Metabolism Open · doi:10.1016/j.metop.2021.100078 · Cited by 15
“These findings are consistent with results suggesting that glucose and insulin concentrations at the 240 min time point may help estimate SI in adults with severe type 2 diabetes [41].”
BackgroundResultde Rooij, M., Erdõs, B., van Riel, N. A. W., & O’Donovan, S. D. (2025) · PLoS Computational Biology · doi:10.1371/journal.pcbi.1012198 · Cited by 18
“As a test case, a neural network was introduced into the glucose minimal model [17,31] to learn a representation of the rate of glucose appearance from the gut, following the ingestion of a meal and was trained using a large public dataset of meal responses.”
Tol, A. J. C., Hribar, K., Kruit, J. K., Bongiovanni, L., Vieira‐Lara, M. A., Koster, M. H., Kloosterhuis, N., Havinga, R., Koehorst, M., de Bruin, A., et al. (2023) · The Journal of Physiology · doi:10.1113/jp284061 · Cited by 14
¿Cuándo empieza la diabetes? Detección e intervención tempranas en diabetes mellitus tipo 2
Peralta, F. G., Abreu, C., Cos, X., & Gómez‐Huelgas, R. (2020) · Revista Clínica Española · doi:10.1016/j.rce.2019.12.003 · Cited by 29
Galderisi, A., Tricò, D., Man, C. D., Santoro, N., Pierpont, B. M., Groop, L., Cobelli, C., & Caprio, S. (2020) · The Journal of Clinical Endocrinology & Metabolism · doi:10.1210/clinem/dgz207 · Cited by 12
Self-citationGalderisi, A., Evans‐Molina, C., Martino, M., Caprio, S., Cobelli, C., & Moran, A. (2022) · The Journal of Clinical Endocrinology & Metabolism · doi:10.1210/clinem/dgac740 · Cited by 13
Self-citationPredicting Insulin Treatment Scenarios with the Net Effect Method: Domain of Validity
Vettoretti, M., Facchinetti, A., Sparacino, G., & Cobelli, C. (2016) · Diabetes Technology & Therapeutics · doi:10.1089/dia.2016.0148 · Cited by 13
Self-citationMarchetti, L., Reali, F., Dauriz, M., Brangani, C., Boselli, L., Ceradini, G., Bonora, E., Bonadonna, R. C., & Priami, C. (2016) · Scientific Reports · doi:10.1038/srep36029 · Cited by 12
Metadata
- Authors
- Cobelli, C., Dalla Man, C., Toffolo, G., Basu, R., Vella, A., & Rizza, R.
- Affiliations
- University of Padua (IT)
- Department of Information Engineering, University of Padova, Padova, Italy
- Mayo Clinic (US)
- Corresponding author
- Cobelli, Claudio
- Venue
- Diabetes
- Publisher
- American Diabetes Association
- Published
- 2014-03-13
- Volume
- 63
- Issue
- 4
- Pages
- 1203-1213
- ISSN
- 0012-1797 (ISSN-L)
- 1939-327X
- PMC
- PMC4179313
- OpenAlex
- W2123229781
- Semantic Scholar
- 11546915ff6d99236372831822dc553c6adef873
- Cited by
- 216
- References
- 47
- Citations by year
- 2026: 12 · 2025: 15 · 2024: 16 · 2023: 23 · 2022: 16 · 2021: 18 · 2020: 19 · 2019: 19 · 2018: 22 · 2017: 17 · 2016: 18 · 2015: 13 · 2014: 8
- FWCI
- 3.52
- Type
- journal article
- Language
- en
- Open access
- hybrid
- doi.org
- Licence
- Locations
- Diabetes (publishedVersion, cc-by-nc-nd)
- PubMed Central (publishedVersion, cc-by-nc-nd)
- PubMed (publishedVersion)
- Padua Research Archive (University of Padova) (submittedVersion, cc-by-nc-nd)
- Funders
- National Institutes of Health (UL1TR000135)
- National Institute of Diabetes and Digestive and Kidney Diseases (R01DK029953, P30DK050456, DK 29953, R37DK029953)
- National Center for Advancing Translational Sciences
- Topics
- Health Sciences › Medicine › Endocrinology, Diabetes and Metabolism › Pancreatic function and diabetes
- Health Sciences › Medicine › Endocrinology, Diabetes and Metabolism › Diabetes, Cardiovascular Risks, and Lipoproteins
- Health Sciences › Medicine › Endocrinology, Diabetes and Metabolism › Diabetes Management and Research
- Keywords
- insulin sensitivity, beta-cell function, hepatic insulin extraction, postprandial glucose metabolism, oral glucose tolerance test, mixed meal tolerance test, disposition index, glucose tracer, glucose disposal
- MeSH terms
- Adolescent, Blood Glucose, C-Peptide, Child, Food, Glucose, Glucose Tolerance Test, Humans, Insulin, Insulin Resistance, Liver, Models, Biological, Glucose Clamp Technique, Postprandial Period, Insulin-Secreting Cells
About these checks
Registry, retraction, Cites and statistics results are computed, not judged, with one exception: a printed reference that no index lists is read once by a model before it counts as a citation error. Claims are extracted by a model and kept only when their quote appears verbatim in the text; each cited source is then checked, with a model’s help, for whether it says what the claim relies on. Those verdicts can be wrong — read the claim’s quote and the cited source before relying on one.
Statistics and arithmetic are recomputed, not judged.
Confidence bands are shown only for fields calibrated on our annotated test set. None is calibrated yet, so no band is shown.
What counts as a claim ›How we measure confidence ›How we check this ›
Are you an author, or do you see a problem with this page? Request a review
Data sources
Bibliographic data: Semantic Scholar, OpenAlex, Crossref.
Contains information from the Semantic Scholar Academic Graph Datasets, made available under the ODC Attribution License (ODC-BY 1.0).
Semantic Scholar’s data is described in: Kinney, R., et al. (2023). The Semantic Scholar Open Data Platform. arXiv:2301.10140.
