

The DOI matches its Crossref record; 37 of the 37 references it cites were found in a registry or an index; none of the 58 sources its claims cite is checked for support yet.
The decline of vitamin D in adolescent athletes: insights from a one-year follow-up and its association with electrocardiographic changes
Open accessAbstract
Introduction: Annual health evaluations are essential for athletes to ensure fitness for competition and enable the early detection of emerging health issues. Aim: This research aimed to evaluate the longitudinal variations in vitamin D concentrations and associated physical and laboratory parameters among adolescent athletes, as well as to investigate their correlation with electrocardiographic (ECG) alterations following a one-year follow-up period. Subjects and methods: This prospective observational cohort study examined 93 adolescent male athletes (aged 11.6 ± 1.15 years, range 10–14) who underwent baseline health evaluations, including physical examination, laboratory tests [25(OH) vitamin D, parathyroid hormone, and muscle enzyme assays], and cardiovascular (CV) assessment with electrocardiography (ECG). Only patients with normal CV findings were included. Follow-ups were performed after one year. Results: At follow-up, weight, height, and muscle mass increased significantly, whereas fat mass and systolic pressure decreased. Vitamin D levels declined (21.9 ± 10.8 vs. 29.8 ± 8.6 ng/mL; p < 0.001), with compensatory rise in parathyroid hormone (38.8 ± 2.7 vs. 33.9 ± 1.6 pg/mL; p < 0.001). Among vitamin D-deficient athletes ( n = 79), ECG changes occurred in 26.6%, mainly sinus arrhythmia (15/79, 19%) and T-wave inversion (13/79, 16%). Vitamin D deficiency was associated with higher odds of T-wave inversion (OR 4.53; 95% CI 1.11–18.40; p = 0.035) and increased prevalence of U-wave and incomplete right bundle branch block. Conclusions: The drop in vitamin D levels over one year raises concerns, highlighting the need for monitoring and interventions due to vitamin D's role in musculoskeletal and CV health. Regular monitoring and preventive strategies are recommended to maintain optimal vitamin D levels and CV health among young athletes.
Overview
CoChat Summary
TL;DR
In 93 adolescent male athletes followed for one year, serum vitamin D declined from 29.8 ± 8.6 to 21.9 ± 10.8 ng/mL and PTH rose, while several ECG changes were more prevalent among vitamin D-deficient athletes. Vitamin D deficiency was associated with higher odds of T-wave inversion, though causality was not established.
Key findings
- Vitamin D decreased significantly over one year (29.8 ± 8.6 to 21.9 ± 10.8 ng/mL; p < 0.001), a 27% reduction, with a compensatory PTH increase (33.9 ± 1.6 to 38.8 ± 2.7 pg/mL; p < 0.001).
- Anthropometric changes included increased weight (40.2 ± 6.8 to 42.7 ± 9.2 kg; p = 0.036), height (151.4 ± 9.2 to 155.4 ± 12.1 cm; p = 0.012), and skeletal muscle mass (16.6 ± 1.4 to 17.2 ± 1.6 kg; p = 0.008), plus decreased fat mass (9.4 ± 0.7 to 8.8 ± 0.8 kg; p < 0.001) and systolic blood pressure (113.3 ± 9.7 to 109.3 ± 11.4 mmHg; p = 0.011).
- Among vitamin D-deficient athletes (n = 79), ECG changes occurred in 26.6%, mainly sinus arrhythmia (15/79, 19%) and T-wave inversion (13/79, 16%). Deficiency was associated with higher odds of T-wave inversion (OR 4.53; 95% CI 1.11–18.40; p = 0.035), with trends for RVCD/incomplete RBBB (OR 8.93; p = 0.082) and U-wave (OR 10.60; p = 0.061).
- T-wave axis decreased significantly (40.5 ± 7.7° to 38.2 ± 6.4°; p = 0.028); other ECG parameters did not differ significantly. Vitamin D correlated positively with calcium (r = 0.429; p < 0.001) and phosphorus (r = 0.408; p < 0.001), and negatively with PTH (r = −0.215; p = 0.039).
Methods
- Prospective observational cohort study of 93 adolescent male athletes aged 10–14 years (mean 11.6 ± 1.15 years), recruited from local sports clubs in Japan, with baseline and one-year follow-up assessments; athletes with chronic illness, cardiovascular abnormalities, or prior vitamin D supplementation were excluded.
- Assessments included physical examination with anthropometrics and blood pressure, fasting laboratory tests for 25(OH) vitamin D, PTH, TSH, ferritin, calcium, phosphorus, muscle enzymes (CK, LDH), and CBC, plus standard 12-lead ECG interpreted by two blinded pediatric cardiologists with a senior electrophysiologist resolving disagreements.
- Statistical analysis used paired t-tests, chi-square/Fisher’s exact tests, Pearson correlation, linear and logistic regression, ROC curves with Youden’s J, and Firth’s penalized logistic regression for sparse ECG subgroups; power analysis indicated ≥84 participants needed for a medium effect size (d = 0.3).
Limitations
- Stated: the sample was exclusively adolescent male athletes, excluding females and adults; the one-year follow-up was insufficient for long-term effects; no quantitative data on training schedule, sun exposure, or extravascular vitamin D stores were available; lifestyle and genetic confounders were uncontrolled; ECG subgroup analyses were exploratory and limited by small cell counts, prompting Firth’s penalized logistic regression.
- Evident from the text: the study was a single cohort without a non-athlete or supplemented control group, and the conclusion notes that vitamin D deficiency was associated with ECG changes but was “not proven to cause these changes.”
Model-written summary. Check it against the paper before relying on it.
Integrity signals
Registry
Cites
Statistics
Figures
Verification
Claims the paper makes
0 Valid · 1 Not valid · 39 Not checked · 64 Own results and interpretations
A result the paper reports from its own data — it cites no other source for it, so there is none to check. The quote shows it is in the paper.
In the paper
“Vitamin D deficiency was associated with higher odds of T-wave inversion (OR 4.53; 95% CI 1.11–18.40; p = 0.035)”
§ The decline of vitamin D in adolescent athletes: insights from a one-year follow-up and its association with electrocardiographic changes > Abstract > Results
plainstates an associationn = 79 ·- Asserted: passes — The authors put it forward as true.
- Checkable: passes — It can be checked against evidence.
- Load-bearing: passes — The paper’s conclusions depend on it.
- Based: passes — The paper gives a reason why it holds.
- Rests on an assumption not shown here.
A result the paper reports from its own data — it cites no other source for it, so there is none to check. The quote shows it is in the paper.
In the paper
“parathyroid hormone (PTH) levels increased significantly (38.8 ± 2.7 vs. 33.9 ± 1.6 pg/mL; p < 0.001).”
§ The decline of vitamin D in adolescent athletes: insights from a one-year follow-up and its association with electrocardiographic changes > Results > Laboratory investigations
plainstates a cause- Asserted: passes — The authors put it forward as true.
- Checkable: passes — It can be checked against evidence.
- Load-bearing: passes — The paper’s conclusions depend on it.
- Based: passes — The paper gives a reason why it holds.
A result the paper reports from its own data — it cites no other source for it, so there is none to check. The quote shows it is in the paper.
In the paper
“RVCD/incomplete RBBB | 2.19 | 8.93 (0.81–98.60) | 0.082 | Trend toward increased risk”
§ The decline of vitamin D in adolescent athletes: insights from a one-year follow-up and its association with electrocardiographic changes > Results > Correlation between vitamin D and electrocardiographic variables after 1-year follow-up
hedgedstates an association- Asserted: passes — The authors put it forward as true.
- Checkable: passes — It can be checked against evidence.
- Load-bearing: unclear — It is unclear whether the paper’s conclusions depend on it.
- Based: passes — The paper gives a reason why it holds.
A result the paper reports from its own data — it cites no other source for it, so there is none to check. The quote shows it is in the paper.
In the paper
“The increase in vitamin D accounted for a 17.5% and 16.7% increase in total serum calcium and serum phosphorus, respectively and vice versa”
§ The decline of vitamin D in adolescent athletes: insights from a one-year follow-up and its association with electrocardiographic changes > Results > Correlation between vitamin D and various anthropometric and biochemical parameters after 1-year follow-up
plainstates a cause- Asserted: passes — The authors put it forward as true.
- Checkable: passes — It can be checked against evidence.
- Load-bearing: unclear — It is unclear whether the paper’s conclusions depend on it.
- Based: passes — The paper gives a reason why it holds.
A result the paper reports from its own data — it cites no other source for it, so there is none to check. The quote shows it is in the paper.
In the paper
“fat mass significantly decreased from 9.4 ± 0.7 to 8.8 ± 0.8 kg (p < 0.001)”
§ The decline of vitamin D in adolescent athletes: insights from a one-year follow-up and its association with electrocardiographic changes > Results > Anthropometric/medical measurements
plain- Asserted: passes — The authors put it forward as true.
- Checkable: passes — It can be checked against evidence.
- Load-bearing: unclear — It is unclear whether the paper’s conclusions depend on it.
- Based: passes — The paper gives a reason why it holds.
45 more claims
Create a free account to see all 104 claims and to verify the 57 references still open.
- It may state two separate claims as one. 34
- Probably not a substantial claim. 37
Self-check
Percentages, sums and reported differences re-computed from the paper’s own numbers.
Each contradiction between two passages listed here was confirmed by an independent check.
Rated minor: it would not touch a result — a value no result rests on, a p-value that stays on the same side of the significance level, or a conflict that is clerical, resolved elsewhere in the paper, or outside its own findings.
In the paper
“Body-mass index (Kg/m2) | −0.016 (–2.257, 0.224)”
§ The decline of vitamin D in adolescent athletes: insights from a one-year follow-up and its association with electrocardiographic changes > Results > Correlation between vitamin D and various anthropometric and biochemical parameters after 1-year follow-up
Reported -0.016 · recomputed -1.0165
Rated minor: it would not touch a result — a value no result rests on, a p-value that stays on the same side of the significance level, or a conflict that is clerical, resolved elsewhere in the paper, or outside its own findings.
In the paper
§ The decline of vitamin D in adolescent athletes: insights from a one-year follow-up and its association with electrocardiographic changes > Results > Correlation between vitamin D and various anthropometric and biochemical parameters after 1-year follow-up
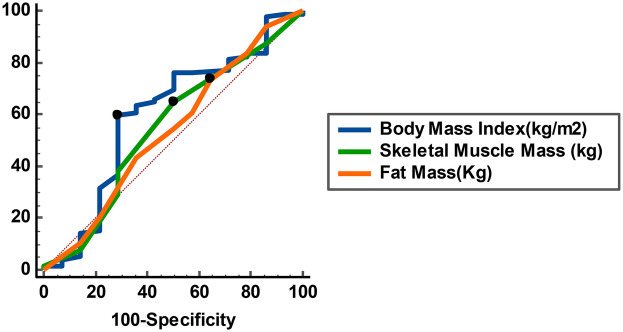
“Anthropometric variables with high risk, including BMI, skeletal muscle mass, and fat mass, were identified as having optimal sensitivity (SE) and specificity (SP) for independently predicting a decline in vitamin D levels after a 1-year follow-up”
§ The decline of vitamin D in adolescent athletes: insights from a one-year follow-up and its association with electrocardiographic changes > Results > Correlation between vitamin D and various anthropometric and biochemical parameters after 1-year follow-up
“No parameter demonstrated significant discriminatory ability (AUC < 0.6, p > 0.05).”
Citations
Cites
Holick, M. F., Binkley, N. C., Bischoff-Ferrari, H. A., Gordon, C. M., Hanley, D. A., Heaney, R. P., Murad, M. H., & Weaver, C. M. (2011) · The Journal of Clinical Endocrinology & Metabolism · doi:10.1210/jc.2011-0385 · Cited by 10,538
Vitamin D deficiency and risk of cardiovascular disease
Wang, T. J., Pencina, M. J., Booth, S. L., Jacques, P. F., Ingelsson, E., Lanier, K., Benjamin, E. J., D’Agostino, R. B., Wolf, M., & Vasan, R. S. (2008) · Circulation · doi:10.1161/circulationaha.107.706127 · Cited by 1,846
Vitamin D: The "sunshine" vitamin.
(2012) · Europe PMC (PubMed Central) · doi:10.4103/0976-500x.95506 · Cited by 652
Vitamin D Sources, Metabolism, and Deficiency: Available Compounds and Guidelines for Its Treatment
Dominguez, L. J., Farruggia, M., Veronese, N., & Barbagallo, M. (2021) · Metabolites · doi:10.3390/metabo11040255 · Cited by 299
Biology and mechanisms of action of the vitamin D hormone
Pike, J. W., & Christakos, S. (2017) · Endocrinology and Metabolism Clinics of North America · doi:10.1016/j.ecl.2017.07.001 · Cited by 247
Vitamin D and the athlete: current perspectives and new challenges
Owens, D. J., Allison, R., & Close, G. L. (2018) · Sports Medicine · doi:10.1007/s40279-017-0841-9 · Cited by 223
Role of Vitamin D in Athletes and Their Performance: Current Concepts and New Trends
de la Puente Yagüe, M., Collado Yurrita, L., Ciudad Cabañas, M., & Cuadrado Cenzual, M. (2020) · Nutrients · doi:10.3390/nu12020579 · Cited by 151
Touvier, M., Deschasaux, M., Montourcy, M., Sutton, A., Charnaux, N., Kesse-Guyot, E., Assmann, K. E., Fezeu, L., Latino-Martel, P., Druesne-Pecollo, N., et al. (2015) · Journal of Investigative Dermatology · doi:10.1038/jid.2014.400 · Cited by 134
Battista, F., Ermolao, A., van Baak, M. A., Beaulieu, K., Blundell, J. E., Busetto, L., Carraça, E. V., Encantado, J., Dicker, D., Farpour‐Lambert, N., et al. (2021) · Obesity Reviews · doi:10.1111/obr.13269 · Cited by 132
Role of vitamin D in cardiovascular health
Reddy Vanga, S., Good, M., Howard, P. A., & Vacek, J. L. (2010) · The American Journal of Cardiology · doi:10.1016/j.amjcard.2010.04.042 · Cited by 121
Vigorous physical activity, mediating biomarkers, and risk of myocardial infarction
CHOMISTEK, A. K., CHIUVE, S. E., JENSEN, M. K., COOK, N. R., & RIMM, E. B. (2011) · Medicine & Science in Sports & Exercise · doi:10.1249/mss.0b013e31821b4d0a · Cited by 99
Wall, J., Meehan, W. P., III, Trompeter, K., Gissane, C., Mockler, D., van Dyk, N., & Wilson, F. (2022) · British Journal of Sports Medicine · doi:10.1136/bjsports-2021-104749 · Cited by 68
Li, J., Somers, V. K., Gao, X., Chen, Z., Ju, J., Lin, Q., Mohamed, E. A., Karim, S., Xu, H., & Zhang, L. (2021) · JAMA Network Open · doi:10.1001/jamanetworkopen.2020.37554 · Cited by 65
Latic, N., & Erben, R. G. (2022) · Nutrients · doi:10.3390/nu14235186 · Cited by 63
Impact of air pollution on vitamin D deficiency and bone health in adolescents
Feizabad, E., Hossein-nezhad, A., Maghbooli, Z., Ramezani, M., Hashemian, R., & Moattari, S. (2017) · Archives of Osteoporosis · doi:10.1007/s11657-017-0323-6 · Cited by 55
McGuine, T. A., Biese, K. M., Hetzel, S., Petrovska, L., Kliethermes, S., Reardon, C. L., Bell, D. R., Brooks, A., & Watson, A. M. (2021) · Journal of Athletic Training · doi:10.4085/1062-6050-0739.20 · Cited by 53
Meta-analysis of vitamin D deficiency and risk of atrial fibrillation
Zhang, Z., Yang, Y., Ng, C. Y., Wang, D., Wang, J., Li, G., & Liu, T. (2016) · Clinical Cardiology · doi:10.1002/clc.22563 · Cited by 43
Exercise: a possibly effective way to improve vitamin D nutritional status
Zhang, J., & Cao, Z.-B. (2022) · Nutrients · doi:10.3390/nu14132652 · Cited by 43
Seo, M.-W., Song, J. K., Jung, H. C., Kim, S.-W., Kim, J.-H., & Lee, J.-M. (2019) · International Journal of Environmental Research and Public Health · doi:10.3390/ijerph16183422 · Cited by 34
Backx, E. M. P., Tieland, M., Maase, K., Kies, A. K., Mensink, M., van Loon, L. J. C., & de Groot, L. C. P. G. M. (2016) · European Journal of Clinical Nutrition · doi:10.1038/ejcn.2016.133 · Cited by 32
Herdea, A., Ionescu, A., Dragomirescu, M.-C., & Ulici, A. (2023) · International Journal of Environmental Research and Public Health · doi:10.3390/ijerph20043300 · Cited by 28
Schweiger, V., Niederseer, D., Schmied, C., Attenhofer-Jost, C., & Caselli, S. (2021) · Current Cardiology Reports · doi:10.1007/s11886-021-01608-x · Cited by 27
Khan, S. R., Claeson, M., Khan, A., & Neale, R. E. (2024) · Public Health in Practice · doi:10.1016/j.puhip.2024.100495 · Cited by 26
Effects of vitamin D supplementation in elite athletes: a systematic review
Wyatt, P. B., Reiter, C. R., Satalich, J. R., O’Neill, C. N., Edge, C., Cyrus, J. W., O’Connell, R. S., & Vap, A. R. (2024) · Orthopaedic Journal of Sports Medicine · doi:10.1177/23259671231220371 · Cited by 25
Pediatric athletes’ ECG and diagnostic performance of contemporary ECG interpretation criteria
Halasz, G., Cattaneo, M., Piepoli, M., Romano, S., Biasini, V., Menafoglio, A., Gasperetti, A., Badini, M., Villa, M., Dall'Ara, L., et al. (2021) · International Journal of Cardiology · doi:10.1016/j.ijcard.2021.04.019 · Cited by 24
Vitamin D and cardiovascular diseases: an update
Haider, F., Ghafoor, H., Hassan, O. F., Farooqui, K., Bel Khair, A. O. M., & Shoaib, F. (2023) · Cureus · doi:10.7759/cureus.49734 · Cited by 24
Wilson-Barnes, S. L., Hunt, J. E. A., Williams, E. L., Allison, S. J., Wild, J. J., Wainwright, J., Lanham-New, S. A., & Manders, R. J. F. (2020) · Journal of Nutritional Science · doi:10.1017/jns.2020.1 · Cited by 23
CANPOLAT, U., YAYLA, Ç., AKBOĞA, M. K., ÖZCAN, E. H., TURAK, O., ÖZCAN, F., TOPALOĞLU, S., & ARAS, D. (2015) · Journal of Cardiovascular Electrophysiology · doi:10.1111/jce.12656 · Cited by 21
Validation of a vitamin D specific questionnaire to determine vitamin D status in athletes
Larson-Meyer, D. E., Douglas, C. S., Thomas, J. J., Johnson, E. C., Barcal, J. N., Heller, J. E., Hollis, B. W., & Halliday, T. M. (2019) · Nutrients · doi:10.3390/nu11112732 · Cited by 21
The importance of vitamin D and magnesium in athletes
Dominguez, L. J., Veronese, N., Ragusa, F. S., Baio, S. M., Sgrò, F., Russo, A., Battaglia, G., Bianco, A., & Barbagallo, M. (2025) · Nutrients · doi:10.3390/nu17101655 · Cited by 19
Alsufiani, H. M., AlGhamdi, S. A., Alshaibi, H. F., Khoja, S., Saif, S. F., & Carlberg, C. (2022) · Nutrients · doi:10.3390/nu14193963 · Cited by 18
Vitamin D deficiency in athletes: laboratory, clinical and field integration
Ip, T. S.-T., Fu, S.-C., Ong, M. T.-Y., & Yung, P. S.-H. (2022) · Asia-Pacific Journal of Sports Medicine, Arthroscopy, Rehabilitation and Technology · doi:10.1016/j.asmart.2022.06.001 · Cited by 16
Tuliani, T. A., Shenoy, M., Deshmukh, A., Rathod, A., Pant, S., Badheka, A. O., Levine, D., & Afonso, L. (2014) · Clinical Cardiology · doi:10.1002/clc.22329 · Cited by 10
Relationship between vitamin D level and index of cardio electrophysiological balance in children
Guzelcicek, A., Kilinc, E., Fedai, H., Dedeoglu, N. F., Toprak, K., Tascanov, M. B., Ocak, M., Gungorer, B., & Kose, D. (2024) · Combinatorial Chemistry & High Throughput Screening · doi:10.2174/1386207326666230816094807 · Cited by 7
Association of vitamin D deficiency with electrocardiographic markers of left atrial abnormalities
Anees, M. A., Ahmad, M. I., Chevli, P. A., Li, Y., & Soliman, E. Z. (2019) · Annals of Noninvasive Electrocardiology · doi:10.1111/anec.12626 · Cited by 5
Resting electrocardiogram and blood pressure in young athletes and nonathletes: a 4-year follow-up
Pentikäinen, H., Toivo, K., Kokko, S., Alanko, L., Heinonen, O. J., Nylander, T., Selänne, H., Vasankari, T., Kujala, U. M., Villberg, J., et al. (2022) · Clinical Physiology and Functional Imaging · doi:10.1111/cpf.12747 · Cited by 3
Altın, H., Şen, E., Bozdemir, Ş., Türe, E., Aktürk, B., & Karaca, A. (2024) · Nigerian Journal of Clinical Practice · doi:10.4103/njcp.njcp_721_23 · Cited by 2
Cited by
Determinants of vitamin D status in Albanian elite athletes: A cross-sectional study
Hoxha, I. I., Bozo, S., Pojani, E., Hoxha-Lami, B., & Bozo, D. (2026) · Sportis Scientific Journal of School Sport Physical Education and Psychomotricity · doi:10.55040/9z0kew35
Metadata
- Authors
- Ramadan, M. M., Jaber, A. A., Aladwani, A. J., Alayyaf, A. E., Sayed-Noor, A. S., Ghanem, H. B., El-Sherbiny, M., Ebrahim, H. A., Ahmed, M. M., & Elsherbini, D. M. A.
- Affiliations
- Mansoura University (EG)
- University of Sharjah (AE)
- Jouf University (SA)
- Princess Nourah bint Abdulrahman University (SA)
- Cairo University (EG)
- Corresponding author
- Ramadan, Mahmoud Mohammed
- Elsherbini, Dalia Mahmoud Abdelmonem
- ORCID
- Venue
- Frontiers in Cardiovascular Medicine
- Publisher
- Frontiers Media SA
- Published
- 2025-12-08
- Volume
- 12
- Pages
- 1731919-1731919
- ISSN
- 2297-055X (ISSN-L)
- PMC
- PMC12719414
- OpenAlex
- W4417103103
- Semantic Scholar
- 70b614402d942f9106cb432ff45cf085515a0076
- Cited by
- 1
- References
- 37
- Citations by year
- 2026: 1
- FWCI
- 0.51
- Type
- journal article
- Language
- en
- Open access
- gold
- doi.org
- Licence
- Locations
- Frontiers in Cardiovascular Medicine (publishedVersion, cc-by)
- PubMed (publishedVersion)
- PubMed Central (publishedVersion, cc-by)
- DOAJ (DOAJ: Directory of Open Access Journals) (submittedVersion)
- Funders
- AlMaarefa University
- Princess Nourah Bint Abdulrahman University
- Topics
- Health Sciences › Medicine › Endocrinology, Diabetes and Metabolism › Vitamin D Research Studies
- Health Sciences › Medicine › Cardiology and Cardiovascular Medicine › Cardiovascular Effects of Exercise
- Health Sciences › Medicine › Orthopedics and Sports Medicine › Sports injuries and prevention
- Keywords
- vitamin D deficiency, youth athletes, electrocardiographic changes, T-wave inversion, sinus arrhythmia, parathyroid hormone, right bundle branch block, U wave, cardiovascular health, longitudinal follow-up, anthropometric changes
About these checks
Registry, retraction, Cites and statistics results are computed, not judged, with one exception: a printed reference that no index lists is read once by a model before it counts as a citation error. Claims are extracted by a model and kept only when their quote appears verbatim in the text; each cited source is then checked, with a model’s help, for whether it says what the claim relies on. Those verdicts can be wrong — read the claim’s quote and the cited source before relying on one.
A language model drew the claims from the paper on 2026-11-14, under version 3 of the claim definition (model deepseek-v4.1-flash, prompt extract-v3).
A second model labelled each claim on 2026-11-14 (model jev-1.13-20260917, definition revision gold-guideline-v0.2).
Statistics and arithmetic are recomputed, not judged.
Confidence bands are shown only for fields calibrated on our annotated test set. None is calibrated yet, so no band is shown.
What counts as a claim ›How we measure confidence ›How we check this ›
Are you an author, or do you see a problem with this page? Request a review
Data sources
Bibliographic data: Semantic Scholar, OpenAlex, Crossref.
Contains information from the Semantic Scholar Academic Graph Datasets, made available under the ODC Attribution License (ODC-BY 1.0).
Semantic Scholar’s data is described in: Kinney, R., et al. (2023). The Semantic Scholar Open Data Platform. arXiv:2301.10140.
