Cited by 268Gut microbiota and healthOral microbiology and periodontitis researchReproductive tract infections research

The DOI matches its Crossref record; 50 of the 50 references it cites were found in a registry or an index.

The Impact of Gut Microbiota on Gender-Specific Differences in Immunity

Open access
Fransen, Floris, van Beek, Adriaan A., Borghuis, Theo, Meijer, Ben, Hugenholtz, Floor, van der Gaast-de Jongh, Christa, Savelkoul, Huub F., de Jonge, Marien I., Faas, Marijke M., Boekschoten, Mark V., Smidt, Hauke, El Aidy, Sahar, de Vos, Paul·2017·Frontiers in Immunology

Abstract

Males and females are known to have gender-specific differences in their immune system and gut microbiota composition. Whether these differences in gut microbiota composition are a cause or consequence of differences in the immune system is not known. To investigate this issue, gut microbiota from conventional males or females was transferred to germ-free animals of the same or opposing gender. We demonstrate that microbiota-independent gender differences in immunity are already present in germ-free mice. In particular type I interferon signaling was enhanced in the intestine of germ-free females. Presumably, due to these immune differences bacterial groups such as Alistipes, Rikenella, and Porphyromonadaceae known to expand in the absence of innate immune defense mechanism were overrepresented in the male microbiota. The presence of these bacterial groups was associated with induction of weight loss, inflammation, and DNA damage upon transfer of the male microbiota to female germ-free recipients. In summary, our data suggests that microbiota-independent gender differences in the immune system select a gender-specific gut microbiota composition, which in turn further contributes to gender differences in the immune system.

Overview

The claims and statistics of this paper haven’t been checked yet.

Run the check — free, no account needed. It reads the open-access text and checks the sources it cites.

A few free checks a day · papers already verified open instantly · results are public

Integrity signals

Registry

Crossref · 10.3389/fimmu.2017.00754

Cites

50 of 50 references verified0 citation errors · 0 not checkable

Statistics

Figures

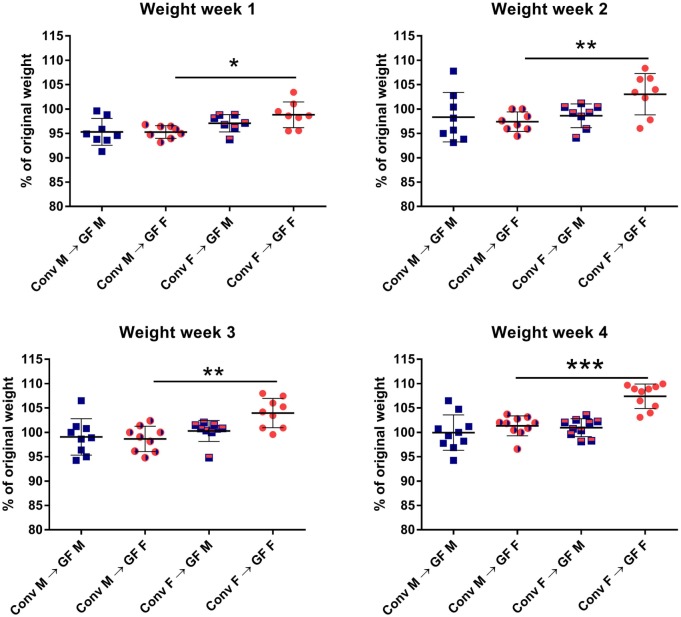
Figure 1 Feces of conventional (conv) males (M) or females (F) was transferred to germ-free (GF) male or female recipient mice (n = 10) by oral gavage. Weight was measured once a week for 4 weeks and is presented as the percentage of the original weight just before gut microbiota transfer. * indicates p < 0.05, ** indicates p < 0.01, and *** indicates p < 0.001.
Figure 1 Feces of conventional (conv) males (M) or females (F) was transferred to germ-free (GF) male or female recipient mice (n = 10) by oral gavage. Weight was measured once a week for 4 weeks and is presented as the percentage of the original weight just before gut microbiota transfer. * indicates p < 0.05, ** indicates p < 0.01, and *** indicates p < 0.001.CC BY · PubMed Central
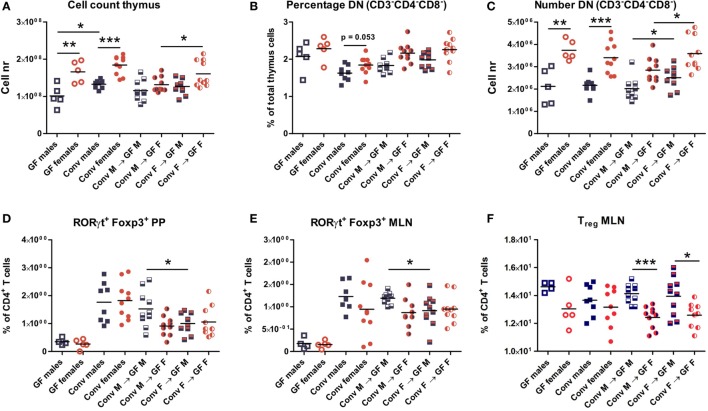
Figure 2 Cells from thymus, spleen, Peyer’s patches (PPs), and mesenteric lymph nodes (MLNs) were analyzed with flow cytometry. Germ-free (GF) males (M) (n = 5), GF females (F) (n = 5), conventional (conv) males (n = 8), and females (n = 10) were included as controls. Experimental groups of GF recipients of gut microbiota each contained 10 mice per group. (A) Total number of thymus cells. (B) Percentage among live thymus cells of lineage negative (CD11b, CD11c, CD19, CD45R/B220, NK1.1, and TER119) cells that were also double negative (DN) for CD4 and CD8. (C) Absolute numbers of thymus cells that were lineage negative (CD11b, CD11c, CD19, CD45R/B220, NK1.1, and TER119) and also DN for CD4 and CD8. (D) Percentage of RORyt+Foxp3+ cells among CD4+ T cells in PPs. (E) Percentage of RORyt+Foxp3+ cells among CD4+ T cells in MLN. (F) Percentage of CD25+Foxp3+ regulatory cells (Treg) among CD4+ T cells in MLN. * indicates p < 0.05, ** indicates p < 0.01, and *** indicates p < 0.001.
Figure 2 Cells from thymus, spleen, Peyer’s patches (PPs), and mesenteric lymph nodes (MLNs) were analyzed with flow cytometry. Germ-free (GF) males (M) (n = 5), GF females (F) (n = 5), conventional (conv) males (n = 8), and females (n = 10) were included as controls. Experimental groups of GF recipients of gut microbiota each contained 10 mice per group. (A) Total number of thymus cells. (B) Percentage among live thymus cells of lineage negative (CD11b, CD11c, CD19, CD45R/B220, NK1.1, and TER119) cells that were also double negative (DN) for CD4 and CD8. (C) Absolute numbers of thymus cells that were lineage negative (CD11b, CD11c, CD19, CD45R/B220, NK1.1, and TER119) and also DN for CD4 and CD8. (D) Percentage of RORyt+Foxp3+ cells among CD4+ T cells in PPs. (E) Percentage of RORyt+Foxp3+ cells among CD4+ T cells in MLN. (F) Percentage of CD25+Foxp3+ regulatory cells (Treg) among CD4+ T cells in MLN. * indicates p < 0.05, ** indicates p < 0.01, and *** indicates p < 0.001.CC BY · PubMed Central
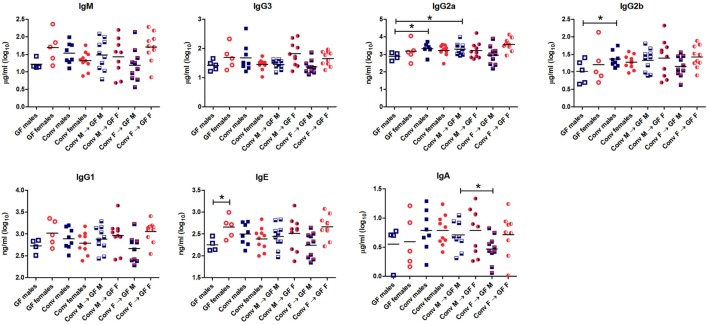
Figure 3 Total levels of IgM, IgG3, IgG2b, IgG2a, IgG1, IgE, and IgA were measured with luminex in serum of germ-free (GF) males (M) (n = 5), GF females (F) (n = 5), conventional (conv) males (n = 8), conventional females (n = 10), and the GF recipient male or female mice that received the gut microbiota from the same or opposite gender (n = 10 per group). * indicates p < 0.05.
Figure 3 Total levels of IgM, IgG3, IgG2b, IgG2a, IgG1, IgE, and IgA were measured with luminex in serum of germ-free (GF) males (M) (n = 5), GF females (F) (n = 5), conventional (conv) males (n = 8), conventional females (n = 10), and the GF recipient male or female mice that received the gut microbiota from the same or opposite gender (n = 10 per group). * indicates p < 0.05.CC BY · PubMed Central
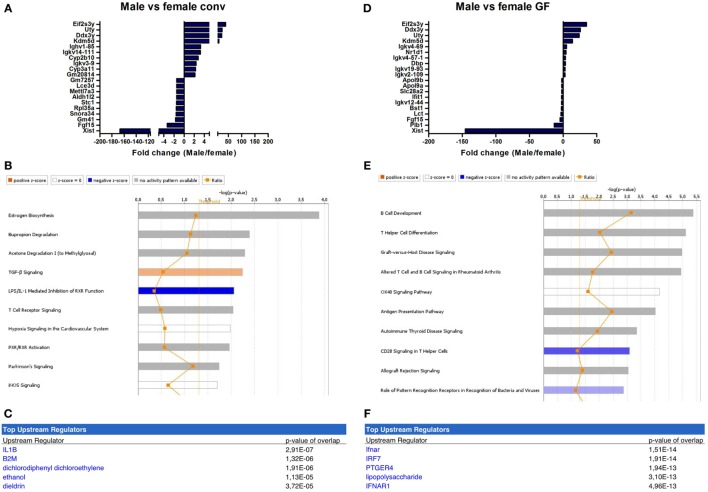
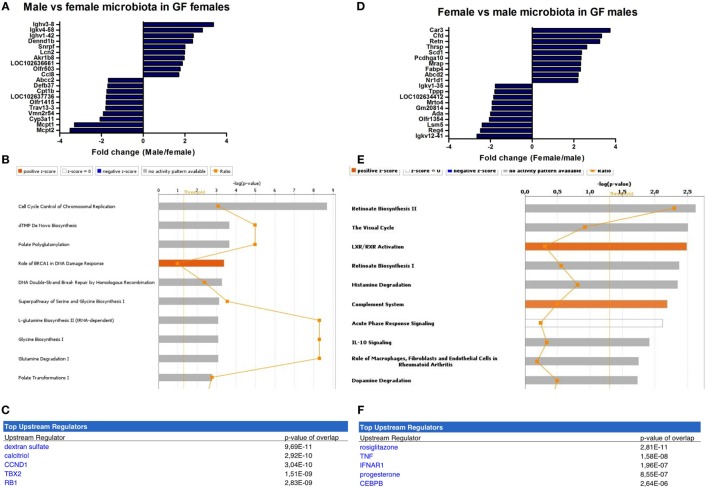
Figure 4 Microbiota-independent differences in immunity between males and females. Whole-genome gene expression in the ileum of male and female conventional (conv) mice (n = 5 per group) or male and female germ-free (GF) mice (n = 4) was assessed with Affymetrix GeneChip Mouse Gene 1.1 ST arrays. Genes that were significantly differentially expressed (p < 0.05 and fold change >1.2) between males and females, either conventional or germ free were analyzed with Ingenuity Pathway Analysis. (A) Top 10 of most upregulated genes and top 10 of most downregulated genes by comparing conventional males with conventional females. (B) Canonical pathways that were most significantly affected by gender in conventional mice. (C) Most significantly predicted upstream regulators of the pathways affected by gender in conventional mice. (D) Top 10 of most upregulated genes and top 10 of most downregulated genes by comparing GF males with GF females. (E) Canonical pathways that were most significantly affected by gender in GF mice. (F) Most significantly predicted upstream regulators of the pathways affected by gender in GF mice.
Figure 4 Microbiota-independent differences in immunity between males and females. Whole-genome gene expression in the ileum of male and female conventional (conv) mice (n = 5 per group) or male and female germ-free (GF) mice (n = 4) was assessed with Affymetrix GeneChip Mouse Gene 1.1 ST arrays. Genes that were significantly differentially expressed (p < 0.05 and fold change >1.2) between males and females, either conventional or germ free were analyzed with Ingenuity Pathway Analysis. (A) Top 10 of most upregulated genes and top 10 of most downregulated genes by comparing conventional males with conventional females. (B) Canonical pathways that were most significantly affected by gender in conventional mice. (C) Most significantly predicted upstream regulators of the pathways affected by gender in conventional mice. (D) Top 10 of most upregulated genes and top 10 of most downregulated genes by comparing GF males with GF females. (E) Canonical pathways that were most significantly affected by gender in GF mice. (F) Most significantly predicted upstream regulators of the pathways affected by gender in GF mice.CC BY · PubMed Central
Figure 5 Microbiota-dependent differences in gender-specific immunity. Whole-genome gene expression in the ileum of male and female germ-free (GF) mice (n = 5) that received the gut microbiota from male or female conventional mice was assessed with Affymetrix GeneChip Mouse Gene 1.1 ST arrays. Genes that were significantly differentially expressed (p < 0.05 and fold change >1.2) between recipients of male and female microbiota were analyzed with Ingenuity Pathway Analysis. (A) Top 10 of most upregulated genes and top 10 of most downregulated genes by comparing male microbiota with female microbiota in GF female recipients. (B) Canonical pathways that were most significantly affected by gender of the microbiota in GF female recipient mice. (C) Most significantly predicted upstream regulators of the pathways affected by gender of the microbiota in GF female recipient mice. (D) Top 10 of most upregulated genes and top 10 of most downregulated genes by comparing female microbiota with male microbiota in GF male recipients. (E) Canonical pathways that were most significantly affected by gender of the microbiota in GF male recipient mice. (F) Most significantly predicted upstream regulators of the pathways affected by gender of the microbiota in GF male recipient mice.
Figure 5 Microbiota-dependent differences in gender-specific immunity. Whole-genome gene expression in the ileum of male and female germ-free (GF) mice (n = 5) that received the gut microbiota from male or female conventional mice was assessed with Affymetrix GeneChip Mouse Gene 1.1 ST arrays. Genes that were significantly differentially expressed (p < 0.05 and fold change >1.2) between recipients of male and female microbiota were analyzed with Ingenuity Pathway Analysis. (A) Top 10 of most upregulated genes and top 10 of most downregulated genes by comparing male microbiota with female microbiota in GF female recipients. (B) Canonical pathways that were most significantly affected by gender of the microbiota in GF female recipient mice. (C) Most significantly predicted upstream regulators of the pathways affected by gender of the microbiota in GF female recipient mice. (D) Top 10 of most upregulated genes and top 10 of most downregulated genes by comparing female microbiota with male microbiota in GF male recipients. (E) Canonical pathways that were most significantly affected by gender of the microbiota in GF male recipient mice. (F) Most significantly predicted upstream regulators of the pathways affected by gender of the microbiota in GF male recipient mice.CC BY · PubMed Central
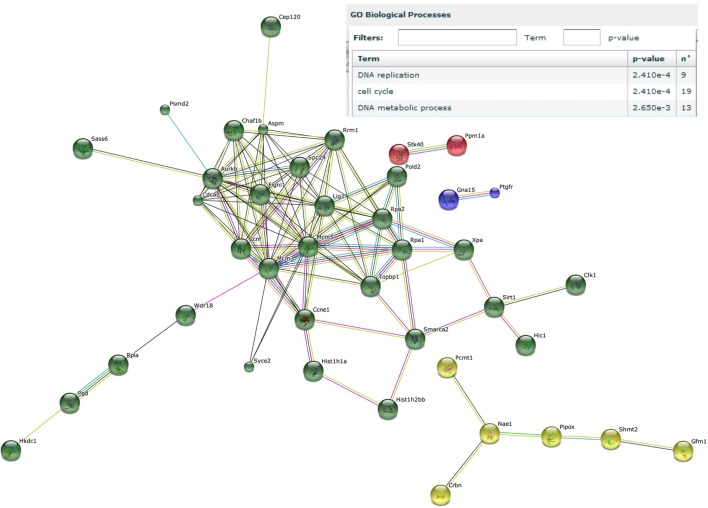
Figure 6 Male microbiota influences DNA replication and the cell cycle. Whole-genome gene expression in the ileum of male and female germ-free (GF) mice (n = 4), or male and female GF recipient mice (n = 5) that received the gut microbiota from male or female conventional mice was assessed with Affymetrix GeneChip Mouse Gene 1.1 ST arrays. Only genes that were significantly differentially expressed (p < 0.05 and fold change >1.2) were included in the analysis. Genes that were specifically affected by the male microbiota were selected as follows: affected by male microbiota in male GF recipients compared to male GF controls AND affected by male microbiota in female GF recipients compared to female GF controls, but NOT affected by female microbiota in female GF recipients compared to female GF controls, OR female microbiota in male GF recipients compared to male GF controls. The resulting list of genes was analyzed with the STRING database. Only genes with at least one interaction are shown. The following interactions are indicated: from curated databases (blue), experimentally determined (pink), textmining (yellow), co-expression (black), and protein homology (purple).
Figure 6 Male microbiota influences DNA replication and the cell cycle. Whole-genome gene expression in the ileum of male and female germ-free (GF) mice (n = 4), or male and female GF recipient mice (n = 5) that received the gut microbiota from male or female conventional mice was assessed with Affymetrix GeneChip Mouse Gene 1.1 ST arrays. Only genes that were significantly differentially expressed (p < 0.05 and fold change >1.2) were included in the analysis. Genes that were specifically affected by the male microbiota were selected as follows: affected by male microbiota in male GF recipients compared to male GF controls AND affected by male microbiota in female GF recipients compared to female GF controls, but NOT affected by female microbiota in female GF recipients compared to female GF controls, OR female microbiota in male GF recipients compared to male GF controls. The resulting list of genes was analyzed with the STRING database. Only genes with at least one interaction are shown. The following interactions are indicated: from curated databases (blue), experimentally determined (pink), textmining (yellow), co-expression (black), and protein homology (purple).CC BY · PubMed Central
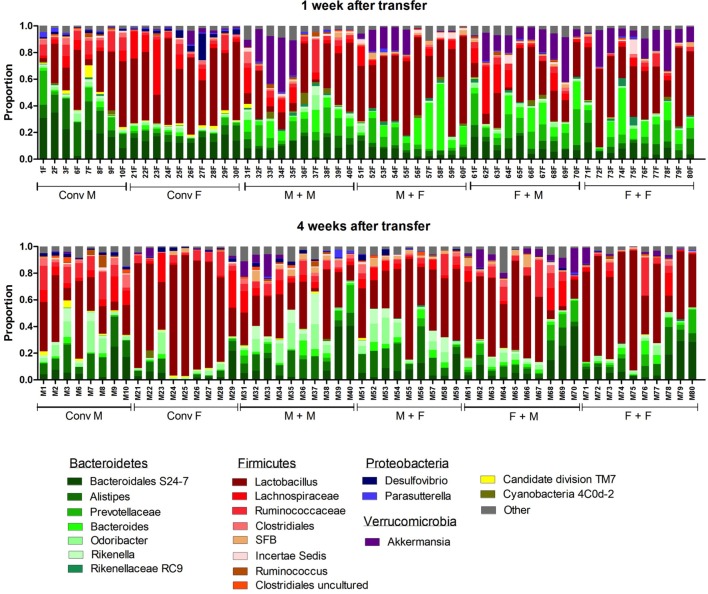
Figure 7 Gut microbiota composition in conventional and conventionalized mice. Fecal samples were collected from conventional (conv) males (M) (n = 8) and conventional females (F) (n = 10) at the time of transfer or 4 weeks after transfer to the germ-free (GF) recipient mice. In addition, fecal samples 1 and 4 weeks after the transfer were collected from the following groups (all n = 10 per group): male GF recipient mice that received male microbiota (M + M), female GF recipient mice that received male microbiota (F + M), male GF recipient mice that received female microbiota (M + F), and female GF recipient mice that received female microbiota (F + F). Gut microbiota composition was analyzed with 16S rDNA sequencing and data are presented as the relative abundance of the different bacterial groups for each individual mouse. The most highly abundant bacterial groups are indicated.
Figure 7 Gut microbiota composition in conventional and conventionalized mice. Fecal samples were collected from conventional (conv) males (M) (n = 8) and conventional females (F) (n = 10) at the time of transfer or 4 weeks after transfer to the germ-free (GF) recipient mice. In addition, fecal samples 1 and 4 weeks after the transfer were collected from the following groups (all n = 10 per group): male GF recipient mice that received male microbiota (M + M), female GF recipient mice that received male microbiota (F + M), male GF recipient mice that received female microbiota (M + F), and female GF recipient mice that received female microbiota (F + F). Gut microbiota composition was analyzed with 16S rDNA sequencing and data are presented as the relative abundance of the different bacterial groups for each individual mouse. The most highly abundant bacterial groups are indicated.CC BY · PubMed Central
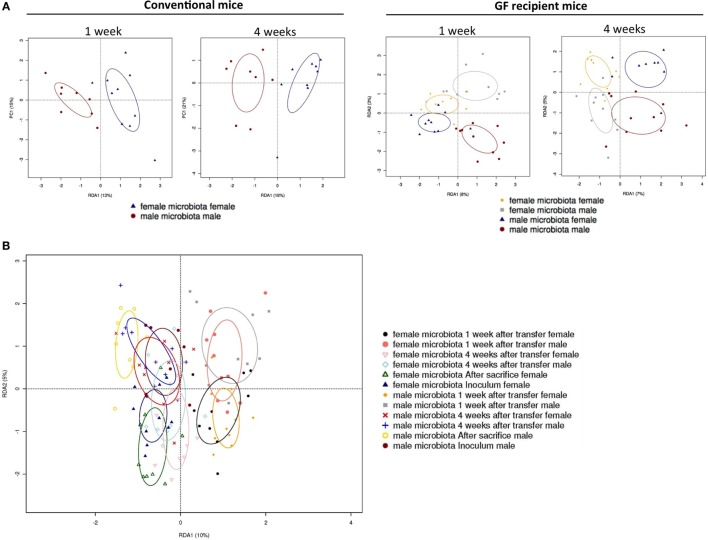
Figure 8 Redundancy analysis (RDA) of gut microbiota composition. Fecal samples were collected from conventional (conv) males (M) (n = 8) and conventional females (F) (n = 10) at the time of transfer or 4 weeks after transfer to the germ-free (GF) recipient mice. In addition, fecal samples 1 and 4 weeks after the transfer were collected from the following groups (all n = 10 per group): male GF recipient mice that received male microbiota (male microbiota male), female GF recipient mice that received male microbiota (male microbiota female), male GF recipient mice that received female microbiota (female microbiota male), and female GF recipient mice that received female microbiota (female microbiota female). Gut microbiota composition was analyzed with 16S rRNA gene sequencing. (A) RDA of gut microbiota composition of conventional males and females at the time of transfer (first panel), or conventional males and females 4 weeks after transfer (second panel), or GF recipient mice 1 week after transfer (third panel), or GF recipient mice 4 weeks after transfer (fourth panel). (B) RDA of gut microbiota composition of all groups combined.
Figure 8 Redundancy analysis (RDA) of gut microbiota composition. Fecal samples were collected from conventional (conv) males (M) (n = 8) and conventional females (F) (n = 10) at the time of transfer or 4 weeks after transfer to the germ-free (GF) recipient mice. In addition, fecal samples 1 and 4 weeks after the transfer were collected from the following groups (all n = 10 per group): male GF recipient mice that received male microbiota (male microbiota male), female GF recipient mice that received male microbiota (male microbiota female), male GF recipient mice that received female microbiota (female microbiota male), and female GF recipient mice that received female microbiota (female microbiota female). Gut microbiota composition was analyzed with 16S rRNA gene sequencing. (A) RDA of gut microbiota composition of conventional males and females at the time of transfer (first panel), or conventional males and females 4 weeks after transfer (second panel), or GF recipient mice 1 week after transfer (third panel), or GF recipient mice 4 weeks after transfer (fourth panel). (B) RDA of gut microbiota composition of all groups combined.CC BY · PubMed Central
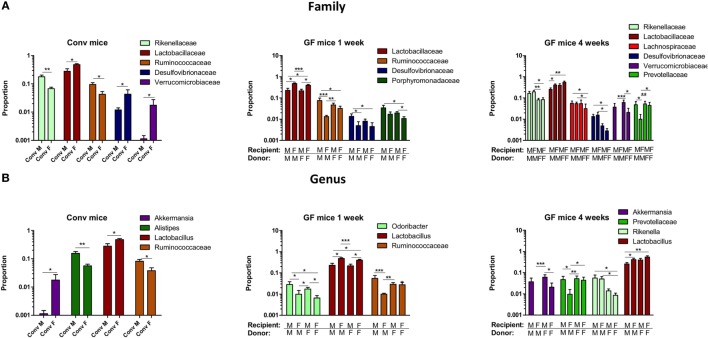
Figure 9 Gender-specific differences in gut microbiota composition. Fecal samples were collected from conventional (conv) males (M) (n = 8) and conventional females (F) (n = 10) at the time of transfer or 4 weeks after transfer to the germ-free (GF) recipient mice. In addition, fecal samples 1 and 4 weeks after the transfer were collected from the following groups (all n = 10 per group): male GF recipient mice that received male microbiota (male microbiota male), female GF recipient mice that received male microbiota (male microbiota female), male GF recipient mice that received female microbiota (female microbiota male), and female GF recipient mice that received female microbiota (female microbiota female). Gut microbiota composition was analyzed with 16S rRNA gene sequencing. (A) Bacterial families that were significantly different in abundance in the different experimental groups. (B) Bacterial genera that were significantly different in abundance in the different experimental groups.
Figure 9 Gender-specific differences in gut microbiota composition. Fecal samples were collected from conventional (conv) males (M) (n = 8) and conventional females (F) (n = 10) at the time of transfer or 4 weeks after transfer to the germ-free (GF) recipient mice. In addition, fecal samples 1 and 4 weeks after the transfer were collected from the following groups (all n = 10 per group): male GF recipient mice that received male microbiota (male microbiota male), female GF recipient mice that received male microbiota (male microbiota female), male GF recipient mice that received female microbiota (female microbiota male), and female GF recipient mice that received female microbiota (female microbiota female). Gut microbiota composition was analyzed with 16S rRNA gene sequencing. (A) Bacterial families that were significantly different in abundance in the different experimental groups. (B) Bacterial genera that were significantly different in abundance in the different experimental groups.CC BY · PubMed Central

Verification

Claims the paper makes

The claims and statistics of this paper haven’t been checked yet.

Run the check — free, no account needed. It reads the open-access text and checks the sources it cites.

A few free checks a day · papers already verified open instantly · results are public

Claims other papers make about this one

Each is checked against this paper’s own text: does it say what the citing paper says it does?

Self-check

Percentages, sums and reported differences re-computed from the paper’s own numbers.

The self-check needs the paper’s full text.

Citations

Cites

Show all 49 references

Cited by

Sorted by citations

See all 268

Metadata

Authors
Fransen, F., van Beek, A. A., Borghuis, T., Meijer, B., Hugenholtz, F., van der Gaast-de Jongh, C., Savelkoul, H. F., de Jonge, M. I., Faas, M. M., Boekschoten, M. V., Smidt, H., El Aidy, S., & de Vos, P.
Affiliations
  • University Medical Center Groningen (NL)
  • Wageningen University & Research (NL)
Corresponding author
Fransen, Floris
Venue
Frontiers in Immunology
Published
2017-06-30
Volume
8
Pages
754-754
ISSN
1664-3224 (ISSN-L)
OpenAlex
W2649086355
Cited by
266
References
49
Citations by year
2026: 12 · 2025: 27 · 2024: 46 · 2023: 32 · 2022: 30 · 2021: 27 · 2020: 37 · 2019: 25 · 2018: 26 · 2017: 3
FWCI
10.39
Type
journal article
Language
en
Open access
Licence
cc-by
Locations
  • Frontiers in Immunology (publishedVersion, cc-by)
  • Europe PMC (PubMed Central) (publishedVersion, cc-by)
  • PubMed Central (publishedVersion, cc-by)
  • PubMed (publishedVersion)
  • University of Groningen research database (University of Groningen / Centre for Information Technology) (publishedVersion, cc-by)
  • Socio-Environmental Systems Modeling (acceptedVersion, cc-by)
  • DOAJ (DOAJ: Directory of Open Access Journals) (submittedVersion, cc-by-sa)
  • Radboud Repository (Radboud University) (submittedVersion)
  • Radboud Repository (Radboud University) (submittedVersion, other-oa)
  • University of Groningen research database (University of Groningen / Centre for Information Technology) (submittedVersion, cc-by)
  • Data Archiving and Networked Services (DANS) (submittedVersion, cc-by)
Topics
  • Life Sciences › Biochemistry, Genetics and Molecular Biology › Molecular Biology › Gut microbiota and health
  • Health Sciences › Dentistry › Periodontics › Oral microbiology and periodontitis research
  • Life Sciences › Immunology and Microbiology › Microbiology › Reproductive tract infections research
Keywords
gut microbiota, sex differences in immunity, germ-free mice, microbiota transfer, type I interferon signaling, intestinal immunity, Alistipes, Rikenella, Porphyromonadaceae, inflammation, DNA damage, weight loss

About these checks

Registry, retraction, Cites and statistics results are computed, not judged, with one exception: a printed reference that no index lists is read once by a model before it counts as a citation error. Claims are extracted by a model and kept only when their quote appears verbatim in the text; each cited source is then checked, with a model’s help, for whether it says what the claim relies on. Those verdicts can be wrong — read the claim’s quote and the cited source before relying on one.

Statistics and arithmetic are recomputed, not judged.

Confidence bands are shown only for fields calibrated on our annotated test set. None is calibrated yet, so no band is shown.

What counts as a claim ›How we measure confidence ›How we check this ›

Are you an author, or do you see a problem with this page? Request a review