

The DOI matches its Crossref record; 1 of the 1 references it cites were found in a registry or an index.
Differential Expression of Plasma Exo-miRNA in Neurodegenerative Diseases by Next-Generation Sequencing
Overview
The claims and statistics of this paper haven’t been checked yet.
Run the check — free, no account needed. It reads the open-access text and checks the sources it cites.
Integrity signals
Registry
Cites
Statistics
Figures
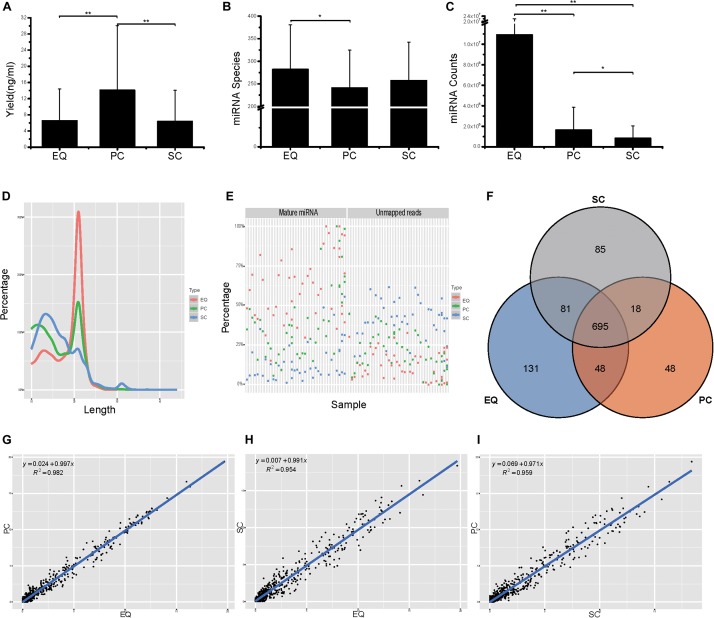
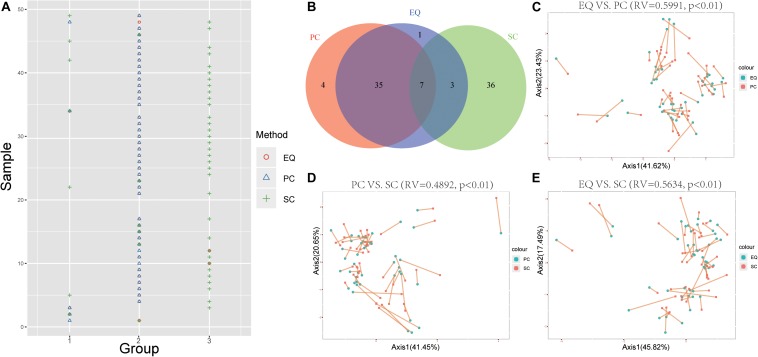
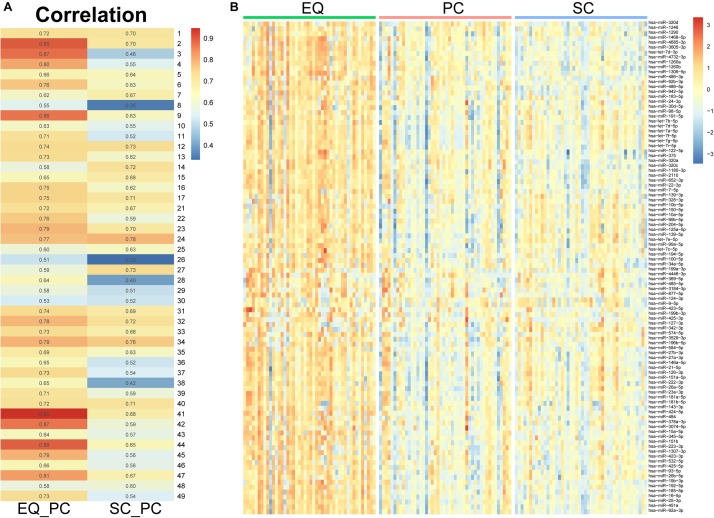
Verification
Claims the paper makes
The claims and statistics of this paper haven’t been checked yet.
Run the check — free, no account needed. It reads the open-access text and checks the sources it cites.
Claims other papers make about this one
Each is checked against this paper’s own text: does it say what the citing paper says it does?
The source backs part of the claim, not all of it — or backs it for a different population, condition or comparison.
In the citing paper
“miR-146a-5p was upregulated in brains and EVs from plasma of AD patients compared to HC [50,70,73,74,83,87].”
From MicroRNAs in Extracellular Vesicles of Alzheimer’s Disease (2023) · cites this paper as [87]
Experimental — accuracy not yet measuredThe cited source says what the claim attributes to it.
In the citing paper
“Some of them have the same alteration tendency, such as miR-199a-3p, which was upregulated in AD brains [80] and EVs from plasma [87].”
From MicroRNAs in Extracellular Vesicles of Alzheimer’s Disease (2023) · cites this paper as [87]
In the citing paper
“Many miRNAs of EVs isolated from plasma are dysregulated in AD patients [79,85,86,87,88]”
From MicroRNAs in Extracellular Vesicles of Alzheimer’s Disease (2023) · cites this paper as [87]
Self-check
Percentages, sums and reported differences re-computed from the paper’s own numbers.
The self-check needs the paper’s full text.
Citations
Cites
Gut bacteria selectively promoted by dietary fibers alleviate type 2 diabetes
Zhao, L., Zhang, F., Ding, X., Wu, G., Lam, Y. Y., Wang, X., Fu, H., Xue, X., Lu, C., Ma, J., et al. (2018) · Science · doi:10.1126/science.aao5774 · Cited by 2,304
Research works printed but not linked: 49
- Agarwal, 2015, Predicting effective microRNA target sites in mammalian mRNAs., eLife, 4, 10.7554/eLife.05005 · DOI · Paper page
- Alderton, 2015, Diagnosis: fishing for exosomes., Nat. Rev. Cancer, 15, 10.1038/nrc3990 · DOI
- Altschul, 1990, Basic local alignment search tool., J. Mol. Biol., 215, 403, 10.1016/S0022-2836(05)80360-2 · DOI · Paper page
- Bellingham, 2012, Small RNA deep sequencing reveals a distinct miRNA signature released in exosomes from prion-infected neuronal cells., Nucleic Acids Res., 40, 10937, 10.1093/nar/gks832 · DOI
- Betel, 2010, Comprehensive modeling of microRNA targets predicts functional non-conserved and non-canonical sites., Genome Biol., 11, 10.1186/gb-2010-11-8-r90 · DOI · Paper page
- Burgos, 2014, Profiles of extracellular miRNA in cerebrospinal fluid and serum from patients with Alzheimer’s and Parkinson’s diseases correlate with disease status and features of pathology., PLoS One, 9, 10.1371/journal.pone.0094839 · DOI · Paper page
- Dawson, 2003, Molecular pathways of neurodegeneration in Parkinson’s disease., Science, 302, 819, 10.1126/science.1087753 · DOI
- Derkow, 2018, Distinct expression of the neurotoxic microRNA family let-7 in the cerebrospinal fluid of patients with Alzheimer’s disease., PLoS One, 13, 10.1371/journal.pone.0200602 · DOI
- Dong, 2015, Serum MicroRNA profiles serve as novel biomarkers for the diagnosis of Alzheimer’s Disease., Dis Mark.rs, 2015, 10.1155/2015/625659 · DOI
- Enderle, 2015, Characterization of RNA from exosomes and other extracellular vesicles isolated by a novel spin column-based method., PLoS One, 10, 10.1371/journal.pone.0136133 · DOI
- Fischer, 2015, Unveiling the principle of microRNA-mediated redundancy in cellular pathway regulation., RNA Biol., 12, 238, 10.1080/15476286.2015.1017238 · DOI · Paper page
- Gao, 2008, Why neurodegenerative diseases are progressive: uncontrolled inflammation drives disease progression., Trends Immunol., 29, 357, 10.1016/j.it.2008.05.002 · DOI
- Gao, 2017, MicroRNA-125b in peripheral blood: a potential biomarker for severity and prognosis of children with viral encephalitis., Neurol. Sci., 38, 1437, 10.1007/s10072-017-2982-x · DOI
- Gonzales, 2009, Large-scale proteomics and phosphoproteomics of urinary exosomes., J. Am. Soc. Nephrol., 20, 363, 10.1681/ASN.2008040406 · DOI · Paper page
- Hara, 2017, Interaction of reactive astrocytes with type I collagen induces astrocytic scar formation through the integrin-N-cadherin pathway after spinal cord injury., Nat. Med., 23, 818, 10.1038/nm.4354 · DOI
- Hewel, 2019, Common miRNA Patterns of Alzheimer’s Disease and Parkinson’s Disease and their putative impact on commensal gut microbiota., Front. Neurosci., 13, 10.3389/fnins.2019.00113 · DOI
- Hoss, 2016, microRNA profiles in Parkinson’s Disease prefrontal cortex., Front. Aging Neurosci., 8, 10.3389/fnagi.2016.00036 · DOI · Paper page
- Jeppesen, 2019, Reassessment of exosome composition., Cell, 177, 428.e18, 10.1016/j.cell.2019.02.029 · DOI · Paper page
- Jia, 2019, Concordance between the assessment of Abeta42, T-tau, and P-T181-tau in peripheral blood neuronal-derived exosomes and cerebrospinal fluid., Alzheimers Dement., 15, 1071, 10.1016/j.jalz.2019.05.002 · DOI
- Kanehisa, 2000, KEGG: kyoto encyclopedia of genes and genomes., Nucleic Acids Res., 28, 27, 10.1093/nar/28.1.27 · DOI · Paper page
- Ke, 2016, NEAT1 is required for survival of breast cancer cells through FUS and miR-548., Gene Regul. Syst. Bio., 10, 11, 10.4137/GRSB.S29414 · DOI
- Keller, 2011, Toward the blood-borne miRNome of human diseases., Nat. Methods, 8, 841, 10.1038/nmeth.1682 · DOI · Paper page
- Kim, 2016, Harnessing cerebrospinal fluid biomarkers in clinical trials for treating Alzheimer’s and Parkinson’s Diseases: potential and challenges., J. Clin. Neurol., 12, 381, 10.3988/jcn.2016.12.4.381 · DOI
- Konovalova, 2019, Interplay between MicroRNAs and oxidative stress in neurodegenerative diseases., Int. J. Mol. Sci., 20, 10.3390/ijms20236055 · DOI
- Kruger, 2006, RNAhybrid: microRNA target prediction easy, fast and flexible., Nucleic Acids Res., 34, W451, 10.1093/nar/gkl243 · DOI · Paper page
- Lehmann, 2012, An unconventional role for miRNA: let-7 activates Toll-like receptor 7 and causes neurodegeneration., Nat. Neurosci., 15, 827, 10.1038/nn.3113 · DOI · Paper page
- Leidinger, 2013, A blood based 12-miRNA signature of Alzheimer disease patients., Genome Biol., 14, 10.1186/gb-2013-14-7-r78 · DOI
- Long, 2013, Tumor suppressive microRNA-424 inhibits osteosarcoma cell migration and invasion via targeting fatty acid synthase., Exp. Ther. Med., 5, 1048, 10.3892/etm.2013.959 · DOI
- Love, 2014, Moderated estimation of fold change and dispersion for RNA-seq data with DESeq2., Genome Biol., 15, 10.1186/s13059-014-0550-8 · DOI · Paper page
- Mak, 2017, Comparative performance of the BGISEQ-500 vs Illumina HiSeq2500 sequencing platforms for palaeogenomic sequencing., Gigascience, 6, 1, 10.1093/gigascience/gix049 · DOI · Paper page
- Mashek, 2007, Long-chain acyl-CoA synthetases and fatty acid channeling., Future Lipidol., 2, 465, 10.2217/17460875.2.4.465 · DOI
- McKhann, 2011, The diagnosis of dementia due to Alzheimer’s disease: recommendations from the National Institute on Aging-Alzheimer’s association workgroups on diagnostic guidelines for Alzheimer’s disease., Alzheimers Dement., 7, 263, 10.1016/j.jalz.2011.03.005 · DOI · Paper page
- Melo, 2014, Cancer exosomes perform cell-independent microRNA biogenesis and promote tumorigenesis., Cancer Cell, 26, 707, 10.1016/j.ccell.2014.09.005 · DOI
- Nelson, 2008, MicroRNAs (miRNAs) in neurodegenerative diseases., Brain Pathol., 18, 130, 10.1111/j.1750-3639.2007.00120.x · DOI
- Rekker, 2014, Comparison of serum exosome isolation methods for microRNA profiling., Clin. Biochem., 47, 135, 10.1016/j.clinbiochem.2013.10.020 · DOI
- Ritchie, 2015, limma powers differential expression analyses for RNA-sequencing and microarray studies., Nucleic Acids Res., 43, 10.1093/nar/gkv007 · DOI · Paper page
- Robinson, 2010, edgeR: a Bioconductor package for differential expression analysis of digital gene expression data., Bioinformatics, 26, 139, 10.1093/bioinformatics/btp616 · DOI · Paper page
- Sadlon, 2019, miRNAs identify shared pathways in Alzheimer’s and Parkinson’s Diseases., Trends Mol. Med., 25, 662, 10.1016/j.molmed.2019.05.006 · DOI
- Satoh, 2015, MicroRNA-seq data analysis pipeline to identify blood biomarkers for Alzheimer’s Disease from public data., Biomark Insights, 10, 21, 10.4137/BMI.S25132 · DOI
- Schwarzenbach, 2014, Clinical relevance of circulating cell-free microRNAs in cancer., Nat. Rev. Clin. Oncol., 11, 145, 10.1038/nrclinonc.2014.5 · DOI · Paper page
- Sun, 2018, MiR-423-5p in brain metastasis: potential role in diagnostics and molecular biology., Cell Death Dis., 9, 10.1038/s41419-018-0955-5 · DOI
- Tan, 2015, Causes and consequences of MicroRNA dysregulation in neurodegenerative diseases., Mol. Neurobiol., 51, 1249, 10.1007/s12035-014-8803-9 · DOI
- Tang, 2017, Comparison of isolation methods of exosomes and exosomal RNA from cell culture medium and serum., Int. J. Mol. Med., 40, 834, 10.3892/ijmm.2017.3080 · DOI
- Taylor, 2011, Exosome isolation for proteomic analyses and RNA profiling., Methods Mol. Biol., 728, 235, 10.1007/978-1-61779-068-3_15 · DOI
- Thery, 2006, Isolation and characterization of exosomes from cell culture supernatants and biological fluids., Curr. Protoc. Cell Biol. Chapter, 3, 10.1002/0471143030.cb0322s30 · DOI · Paper page
- Valadi, 2007, Exosome-mediated transfer of mRNAs and microRNAs is a novel mechanism of genetic exchange between cells., Nat. Cell Biol., 9, 654, 10.1038/ncb1596 · DOI · Paper page
- Vlachos, 2015, DIANA-miRPath v3.0: deciphering microRNA function with experimental support., Nucleic Acids Res., 43, W460, 10.1093/nar/gkv403 · DOI
- Witwer, 2013, Standardization of sample collection, isolation and analysis methods in extracellular vesicle research., J. Extracell Vesicles, 2012, 10.3402/jev.v2i0.20360 · DOI
- Wood, 2011, Exosomes and the blood-brain barrier: implications for neurological diseases., Ther. Deliv., 2, 1095, 10.4155/tde.11.83 · DOI
Cited by
Sorted by citations
Xu, X., Iqbal, Z., Xu, L., Wen, C., Duan, L., Xia, J., Yang, N., Zhang, Y., & Liang, Y. (2024) · Psychiatry and Clinical Neurosciences · doi:10.1111/pcn.13610 · Cited by 68
Extracellular Vesicles as Novel Diagnostic and Prognostic Biomarkers for Parkinson’s Disease
Leggio, L., Paternò, G., Vivarelli, S., Falzone, G. G., Giachino, C., Marchetti, B., & Iraci, N. (2021) · Aging and disease · doi:10.14336/ad.2021.0527 · Cited by 55
MicroRNAs in Extracellular Vesicles of Alzheimer’s Disease
Li, W., & Zheng, Y. (2023) · Cells · doi:10.3390/cells12101378 · Cited by 43
Unveiling the Complex Role of Exosomes in Alzheimer’s Disease
Sun, M., & Chen, Z. (2024) · Journal of Inflammation Research · doi:10.2147/jir.s466821 · Cited by 39
Monteiro-Reis, S., Carvalho-Maia, C., Bart, G., Vainio, S. J., Pedro, J., Silva, E. R., Sales, G., Henrique, R., & Jerónimo, C. (2021) · International Journal of Molecular Sciences · doi:10.3390/ijms22063267 · Cited by 21
Rethinking Alzheimer’s: Novel miRNAs Illuminate a Disease Beyond the Brain
Novotný, J., Čarná, M., Dammer, E., Mao, Z., & Stokin, G. (2025) · doi:10.1101/2025.11.27.690929 · Cited by 1
Metadata
- Authors
- Nie, C., Sun, Y., Zhen, H., Guo, M., Ye, J., Liu, Z., Yang, Y., & Zhang, X.
- Venue
- Frontiers in Neuroscience
- Publisher
- Frontiers Media SA
- Published
- 2020-05-07
- Volume
- 14
- ISSN
- 1662-453X
- PMC
- PMC7227778
- Cited by
- 89
- References
- 1
- Funders
- Science, Technology and Innovation Commission of Shenzhen Municipality (JCYJ20170412153100794, JSGG20170824152728492)
About these checks
Registry, retraction, Cites and statistics results are computed, not judged, with one exception: a printed reference that no index lists is read once by a model before it counts as a citation error. Claims are extracted by a model and kept only when their quote appears verbatim in the text; each cited source is then checked, with a model’s help, for whether it says what the claim relies on. Those verdicts can be wrong — read the claim’s quote and the cited source before relying on one.
Statistics and arithmetic are recomputed, not judged.
Confidence bands are shown only for fields calibrated on our annotated test set. None is calibrated yet, so no band is shown.
What counts as a claim ›How we measure confidence ›How we check this ›
Are you an author, or do you see a problem with this page? Request a review
