

The DOI matches its Crossref record; 54 of the 54 references it cites were found in a registry or an index; 14 of the 27 sources its claims cite were checked for support.
Potential Pitfalls of Using Fractional Anisotropy, Axial Diffusivity, and Radial Diffusivity as Biomarkers of Cerebral White Matter Microstructure
Open accessAbstract
Fractional anisotropy (FA), axial diffusivity (AD), and radial diffusivity (RD) are commonly used as MRI biomarkers of white matter microstructure in diffusion MRI studies of neurodevelopment, brain aging, and neurologic injury/disease. Some of the more frequent practices include performing voxel-wise or region-based analyses of these measures to cross-sectionally compare individuals or groups, longitudinally assess individuals or groups, and/or correlate with demographic, behavioral or clinical variables. However, it is now widely recognized that the majority of cerebral white matter voxels contain multiple fiber populations with different trajectories, which renders these metrics highly sensitive to the relative volume fractions of the various fiber populations, the microstructural integrity of each constituent fiber population, and the interaction between these factors. Many diffusion imaging experts are aware of these limitations and now generally avoid using FA, AD or RD (at least in isolation) to draw strong reverse inferences about white matter microstructure, but based on the continued application and interpretation of these metrics in the broader biomedical/neuroscience literature, it appears that this has perhaps not yet become common knowledge among diffusion imaging end-users. Therefore, this paper will briefly discuss the complex biophysical underpinnings of these measures in the context of crossing fibers, provide some intuitive “thought experiments” to highlight how conventional interpretations can lead to incorrect conclusions, and suggest that future studies refrain from using (over-interpreting) FA, AD, and RD values as standalone biomarkers of cerebral white matter microstructure.
Overview
AI snapshot
Written from the paper’s full text.
TL;DR
This paper argues that fractional anisotropy (FA), axial diffusivity (AD), and radial diffusivity (RD) are problematic as standalone biomarkers of cerebral white matter microstructure because most white matter voxels contain crossing fibers. It uses thought experiments to show that conventional interpretations can lead to incorrect reverse inferences, and recommends avoiding over-interpretation of these metrics in isolation.
Key findings
- Most cerebral white matter voxels contain multiple fiber populations: the proportion is now thought to be at least 33% (Behrens et al., 2007) and more likely between 60 and 90% (Jeurissen et al., 2013), with many regions containing 3 or more intersecting fiber bundles.
- Because FA is a relative, unitless measure scaled between 0 and 1, it can paradoxically increase when one or more fiber bundles degenerate while others are preserved, or remain unchanged when all three eigenvalues increase proportionally despite net tissue loss; AD and RD are confounded for similar reasons in crossing-fiber voxels.
- Conventional reverse inferences from FA, AD, and RD can lead to Type I (false positive) and/or Type II (false negative) errors, and the paper states there is no way to control for these effects or estimate their prevalence.
- MD and Trace are proposed as more robust DTI metrics because they equally weight diffusion along all three tensor axes; advanced dMRI methods (DKI, NODDI, tensor-valued diffusion encoding/μFA, fixel-based analysis) and non-dMRI methods (T1w/T2w ratio, ihMT, myelin water imaging) are suggested as alternatives likely more robust to crossing fibers.
Methods
- Narrative/commentary review with no new empirical data or sample; it synthesizes prior literature and presents two intuitive “thought experiments.”
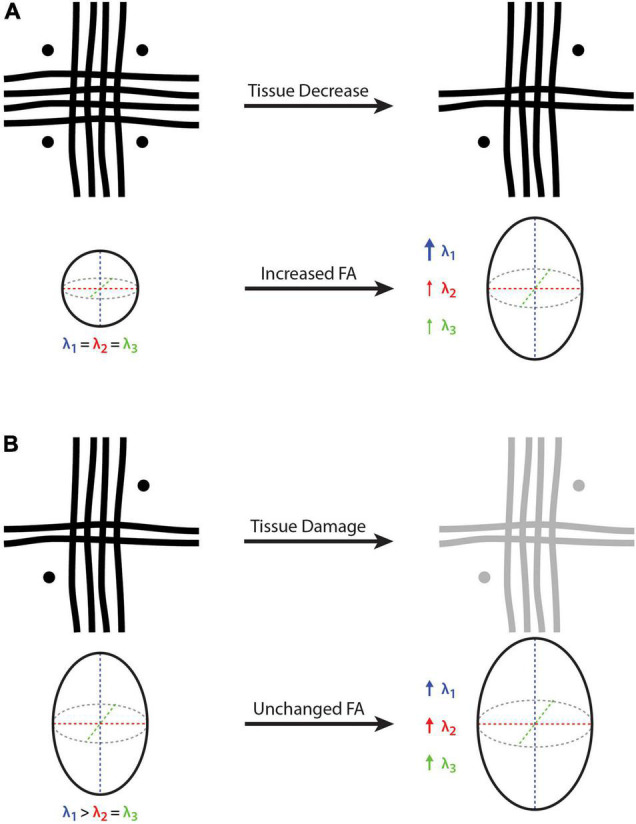
- The thought experiments use cartoon voxels containing three crossing fibers (vertical, horizontal, and through-plane) and corresponding diffusion tensor eigenvalues to illustrate how FA can increase despite net fiber reduction, or remain constant despite proportional tissue changes.
- Main analysis is conceptual and biophysical, supported by references to prior simulation and empirical work (e.g., Pierpaoli et al., 2001; Wheeler-Kingshott and Cercignani, 2009; Jeurissen et al., 2013).
Limitations
- The authors state that all MRI methods have limitations and that their list of alternatives is not comprehensive; they also note that they focused on FA for simplicity, though AD and RD are confounded similarly.
- The authors state there is no way to control for crossing-fiber effects or estimate the prevalence of Type I and Type II errors, which could even occur simultaneously in different brain regions.
- Evident from the text: this is not an original data study or systematic review, and the recommendations are conceptual rather than validated by new experiments in this paper.
Model-written summary. Check it against the paper before relying on it.
Integrity signals
Registry
Cites
Statistics
Figures
Verification
Claims the paper makes
17 Own interpretation · 7 Supported · 6 No full text of the sources · 5 Partly supported · 1 Supported so far · 1 Sources not found · 1 No basis given · accuracy not yet measured
The cited sources support only part of this claim — read each source’s verdict below.
In the paper
“it is now widely recognized that the majority of cerebral white matter voxels contain multiple fiber populations with different trajectories”
§ Potential Pitfalls of Using Fractional Anisotropy, Axial Diffusivity, and Radial Diffusivity as Biomarkers of Cerebral White Matter Microstructure > Abstract
What the sources say
- Partly supportedcites Behrens et al., 2007 sourceExperimental — accuracy not yet measured
The Abstract says that multiple fibre populations occur across large regions of white matter. But Results (Local fitting of the complex fibre model; page unavailable) reports that only one third of voxels with fractional anisotropy above 0.1 supported more than one orientation in the 60-direction dataset. This supports the presence of multiple populations, not the claim that they occur in a majority of cerebral white matter voxels. (LLM, conf=0.88)
- Supportedcites Jeurissen et al., 2013 source
In Vivo Estimation of Fiber Orientations (Table I) reports two or more fiber orientations in approximately 90% of white matter voxels using CSD and 63% using bedpostx. Both estimates support the claim that a majority contain multiple fiber populations with different trajectories. (LLM, conf=0.94)
boosted- Asserted: passes — The authors put it forward as true.
- Checkable: passes — It can be checked against evidence.
- Load-bearing: passes — The paper’s conclusions depend on it.
- Based: passes — The paper gives a reason why it holds.
- Partly supported
Every source the paper cites for this claim was checked and supports it.
In the paper
“and is more likely somewhere between 60 and 90% (Jeurissen et al., 2013)”
§ Potential Pitfalls of Using Fractional Anisotropy, Axial Diffusivity, and Radial Diffusivity as Biomarkers of Cerebral White Matter Microstructure > Introducing the Problem (Pitfall)
What the sources say
- Supportedcites Jeurissen et al., 2013 source
The In Vivo Estimation of Fiber Orientations section (Table I) reports multiple fiber orientations in approximately 90% of white-matter voxels using CSD and complex configurations in approximately 63% using bedpostx. The Discussion repeats both estimates, supporting the cited 60–90% range. The percentages are method-dependent estimates, not a single measured proportion. (LLM, conf=0.94)
hedged- Asserted: passes — The authors put it forward as true.
- Checkable: passes — It can be checked against evidence.
- Load-bearing: passes — The paper’s conclusions depend on it.
- Based: passes — The paper gives a reason why it holds.
- Supported
Every source the paper cites for this claim was checked and supports it.
In the paper
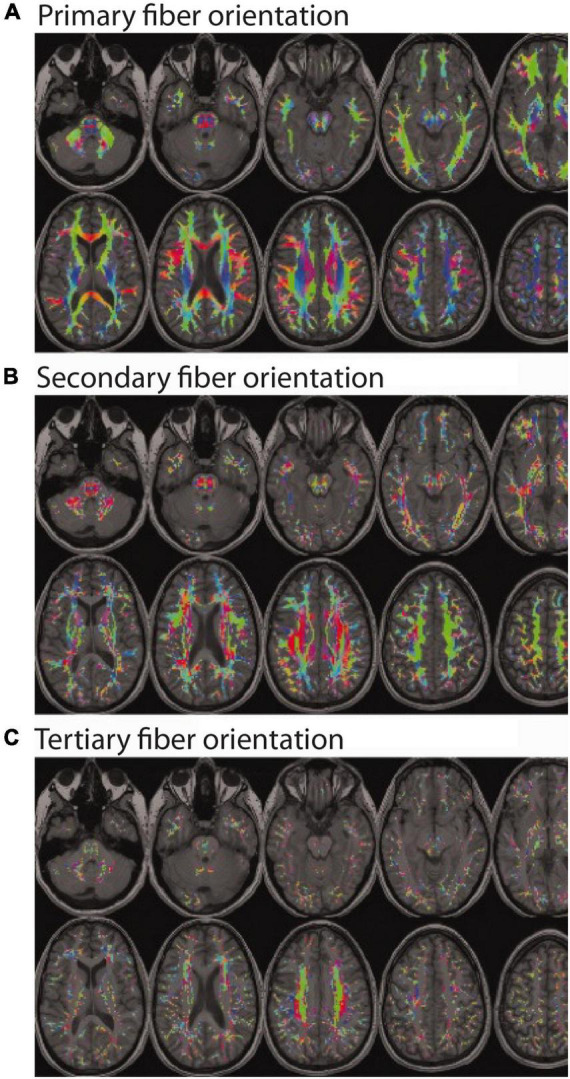
“with many regions thought to contain as many as 3 or more intersecting fiber bundles with different trajectories (Figure 1)”
§ Potential Pitfalls of Using Fractional Anisotropy, Axial Diffusivity, and Radial Diffusivity as Biomarkers of Cerebral White Matter Microstructure > Introducing the Problem (Pitfall)
What the sources say
- Supportedcites Jeurissen et al., 2013 source
The In Vivo Estimation of Fiber Orientations section reports large clusters of voxels with three fiber populations, including a region where three named bundles interdigitate. It also reports that CSD detected three or more orientations in about 45% of white-matter voxels, supporting the claim's hedged wording. (LLM, conf=0.93)
hedged- Asserted: passes — The authors put it forward as true.
- Checkable: passes — It can be checked against evidence.
- Load-bearing: passes — The paper’s conclusions depend on it.
- Based: passes — The paper gives a reason why it holds.
- Supported
The cited sources support only part of this claim — read each source’s verdict below.
In the paper
“the proportion of cerebral white matter voxels containing complex fiber geometries and/or multiple fiber bundles in different orientations (i.e., crossing fibers, kissing fibers, etc.) is now thought to be at least 33% (Behrens et al., 2007)”
§ Potential Pitfalls of Using Fractional Anisotropy, Axial Diffusivity, and Radial Diffusivity as Biomarkers of Cerebral White Matter Microstructure > Introducing the Problem (Pitfall)
What the sources say
- Partly supportedcites Behrens et al., 2007 sourceExperimental — accuracy not yet measured
The Results (Local fitting of the complex fibre model) and Discussion report detectable complex fibre architecture in approximately one third of voxels with fractional anisotropy greater than 0.1 using a 60-direction dataset; page numbers are not supplied. This supports the approximate proportion, but not a lower bound of at least 33% for all cerebral white matter voxels. (LLM, conf=0.88)
hedged- Asserted: passes — The authors put it forward as true.
- Checkable: passes — It can be checked against evidence.
- Load-bearing: passes — The paper’s conclusions depend on it.
- Based: passes — The paper gives a reason why it holds.
- Partly supported
The cited sources support only part of this claim — read each source’s verdict below.
In the paper
“in the case of ihMT and MWI likely also provide more myelin-specific information than can be obtained with more general measures based on DTI or T1w/T2w ratio metrics (Mädler et al., 2008; Ercan et al., 2018; Uddin et al., 2019).”
§ Potential Pitfalls of Using Fractional Anisotropy, Axial Diffusivity, and Radial Diffusivity as Biomarkers of Cerebral White Matter Microstructure > Potential Alternatives to Fractional Anisotropy, Axial Diffusivity, and Radial Diffusivity
What the sources say
- Not checked — no full text of the sourcecites Mädler et al., 2008 source
- Not checked — no full text of the sourcecites Ercan et al., 2018 source
- Partly supportedcites Uddin et al., 2019 sourceExperimental — accuracy not yet measured
The Introduction calls MWF a myelin-specific measure and DTI metrics general measures of tissue microstructure; the Conclusions also say T1w/T2w ratios should not be interpreted as myelin-specific in subcortical structures. The paper mentions an earlier ihMTR comparison but does not establish that ihMT is more myelin-specific than DTI or T1w/T2w. Page numbers are unavailable in our copy. (LLM, conf=0.86)
hedgedcorrelational- Asserted: passes — The authors put it forward as true.
- Checkable: passes — It can be checked against evidence.
- Load-bearing: passes — The paper’s conclusions depend on it.
- Based: passes — The paper gives a reason why it holds.
The cited sources support only part of this claim — read each source’s verdict below.
In the paper
“as pointed out by Jeurissen et al. (2013), even regions with crossing fibers, many observed differences/changes in FA, AD and/or RD are likely to reflect actual anatomical and biophysical phenomena, as long as other pitfalls in the acquisition and analysis have been avoided (Jones and Cercignani, 2010).”
§ Potential Pitfalls of Using Fractional Anisotropy, Axial Diffusivity, and Radial Diffusivity as Biomarkers of Cerebral White Matter Microstructure > General Discussion
What the sources say
- Partly supportedcites Jeurissen et al., 2013 sourceExperimental — accuracy not yet measured
In “Implications for DTI” (page not provided), the paper says that, if known analysis pitfalls are avoided, an observed FA change is highly likely to reflect a true underlying biophysical phenomenon—even though its meaning is ambiguous in crossing-fiber regions. It discusses axial and radial diffusivity as similarly difficult to interpret, but does not explicitly extend that likelihood statement to changes in AD or RD. (LLM, conf=0.86)
- Not checked — no full text of the sourcecites Jones and Cercignani, 2010 source
hedgedconditional- Asserted: passes — The authors put it forward as true.
- Checkable: passes — It can be checked against evidence.
- Load-bearing: passes — The paper’s conclusions depend on it.
- Based: passes — The paper gives a reason why it holds.
- Partly supported
Every source the paper cites for this claim was checked and supports it.
In the paper
“ex vivo MRI and histological studies of the macaque brain have revealed that white matter crossing fibers become even more apparent upon higher resolution and more detailed examination”
§ Potential Pitfalls of Using Fractional Anisotropy, Axial Diffusivity, and Radial Diffusivity as Biomarkers of Cerebral White Matter Microstructure > General Discussion
What the sources say
- Supportedcites Schilling et al., 2017 source
The Introduction describes ex vivo MRI of a macaque brain followed by histological analysis of the same specimen. The Conclusion reports that crossing fibers became more frequent at higher spatial resolutions in both MRI and histology, supporting the citing sentence’s paraphrase. (LLM, conf=0.94)
boostedcorrelational- Asserted: passes — The authors put it forward as true.
- Checkable: passes — It can be checked against evidence.
- Load-bearing: passes — The paper’s conclusions depend on it.
- Based: passes — The paper gives a reason why it holds.
- Supported
The cited sources support only part of this claim — read each source’s verdict below.
In the paper
“DKI data acquired using conventional hardware and reasonable scan times can resolve crossing fibers significantly better than conventional DTI (Glenn et al., 2016)”
§ Potential Pitfalls of Using Fractional Anisotropy, Axial Diffusivity, and Radial Diffusivity as Biomarkers of Cerebral White Matter Microstructure > Potential Alternatives to Fractional Anisotropy, Axial Diffusivity, and Radial Diffusivity
What the sources say
- Partly supportedcites Glenn et al., 2016 sourceExperimental — accuracy not yet measured
The Conclusion (page unavailable) says DKI directly resolves crossing fibers and improves tractography accuracy relative to DTI; the Methods report use of a 3T MRI system. However, the Discussion says this study’s scan time was relatively long compared with typical clinical protocols. It cites shorter DKI protocols as feasible but does not establish the same crossing-fiber performance at those scan times. (LLM, conf=0.88)
plaindirect- Asserted: passes — The authors put it forward as true.
- Checkable: passes — It can be checked against evidence.
- Load-bearing: unclear — It is unclear whether the paper’s conclusions depend on it.
- Based: passes — The paper gives a reason why it holds.
- Partly supported
Every source the paper cites for this claim was checked and supports it.
In the paper
“suggesting that this is a fundamental problem that cannot be overcome by scanning at higher resolution to reduce partial volume effects (Schilling et al., 2017).”
§ Potential Pitfalls of Using Fractional Anisotropy, Axial Diffusivity, and Radial Diffusivity as Biomarkers of Cerebral White Matter Microstructure > General Discussion
What the sources say
- Supportedcites Schilling et al., 2017 source
The Discussion says the crossing fiber problem is a fundamental limitation of diffusion MRI that cannot be overcome by increased spatial resolution. It also reports that crossing fibers remained in more than 50% of white-matter voxels at 32 µm, despite reduced partial-volume averaging. (LLM, conf=0.94)
hedged- Asserted: passes — The authors put it forward as true.
- Checkable: passes — It can be checked against evidence.
- Load-bearing: passes — The paper’s conclusions depend on it.
- Based: passes — The paper gives a reason why it holds.
- Supported
The sources with a verdict support this claim; the rest weren’t checked yet, have no full text we could read, or their verdicts aren’t rated yet.
In the paper
“other quantitative MRI techniques such as calibrated T1w/T2w ratio mapping (Ganzetti et al., 2014; Uddin et al., 2018), inhomogeneous magnetization transfer (ihMT) imaging (Manning et al., 2017; Swanson et al., 2017), and T2 relaxation-based myelin water imaging MWI (Prasloski et al., 2012; Lee et al., 2018) are likely less affected by fiber orientation”
§ Potential Pitfalls of Using Fractional Anisotropy, Axial Diffusivity, and Radial Diffusivity as Biomarkers of Cerebral White Matter Microstructure > Potential Alternatives to Fractional Anisotropy, Axial Diffusivity, and Radial Diffusivity
What the sources say
- Supportedcites Ganzetti et al., 2014 source
In the Discussion section on myelin-related information, the paper reports that T1-w/T2-w scores were more uniform than fractional anisotropy (FA) across white-matter structures. It attributes some FA variability to crossing fibers with different orientations, supporting the hedged claim that the ratio measure is less affected by fiber orientation than FA. The cited paper does not address the other techniques listed in the sentence, which have separate citations. (LLM, conf=0.83)
- Not checked — no full text of the sourcecites Uddin et al., 2018 source
- Not checked — no full text of the sourcecites Manning et al., 2017 source
hedged- Asserted: passes — The authors put it forward as true.
- Checkable: passes — It can be checked against evidence.
- Load-bearing: passes — The paper’s conclusions depend on it.
- Based: passes — The paper gives a reason why it holds.
- Supported
- It may state two separate claims as one. 5
- Probably not a substantial claim. 3
Every source the paper cites for this claim was checked and supports it.
In the paper
“changes in AD can induce spurious alterations in RD and vice versa in voxels containing crossing fibers (Wheeler-Kingshott and Cercignani, 2009)”
§ Potential Pitfalls of Using Fractional Anisotropy, Axial Diffusivity, and Radial Diffusivity as Biomarkers of Cerebral White Matter Microstructure > General Discussion
What the sources say
- Supportedcites Wheeler-Kingshott and Cercignani, 2009 source
The Abstract states that simulations of crossing-fiber voxels show a change in radial diffusivity can cause a fictitious change in axial diffusivity, and vice versa. The Discussion likewise describes changes to both fitted measures in its crossing-fiber model. (LLM, conf=0.95)
plaindirect- Asserted: passes — The authors put it forward as true.
- Checkable: passes — It can be checked against evidence.
- Load-bearing: passes — The paper’s conclusions depend on it.
- Based: passes — The paper gives a reason why it holds.
It may state two separate claims as one.
- Supported
Every source the paper cites for this claim was checked and supports it.
In the paper
“Modeling individual fibers at the sub-voxel level like this could lead to more sensitive measurements and more detailed understandings about tissue degeneration in various disorders (Finkelstein et al., 2021).”
§ Potential Pitfalls of Using Fractional Anisotropy, Axial Diffusivity, and Radial Diffusivity as Biomarkers of Cerebral White Matter Microstructure > Potential Alternatives to Fractional Anisotropy, Axial Diffusivity, and Radial Diffusivity
What the sources say
- Supportedcites Finkelstein et al., 2021 source
The Introduction describes fixel-based analysis as modeling individual fibers at the sub-voxel level, providing a more comprehensive understanding of fiber changes, and being used in several neurological disorders. The Conclusions say it may provide a sensitive biomarker for axonal degeneration, although the study’s sensitivity comparison was limited to an HIV cohort. (LLM, conf=0.90)
hedgeddirect- Asserted: passes — The authors put it forward as true.
- Checkable: passes — It can be checked against evidence.
- Load-bearing: fails — The paper’s conclusions may not depend on it.
- Based: passes — The paper gives a reason why it holds.
Probably not a substantial claim. The paper’s conclusions may not depend on it. It may state two separate claims as one.
- Supported
Every source the paper cites for this claim was checked and supports it.
In the paper
“recent fixel-based analysis approaches have been proposed to characterize a specific fiber population within a voxel (i.e., a “fixel”) (Raffelt et al., 2017).”
§ Potential Pitfalls of Using Fractional Anisotropy, Axial Diffusivity, and Radial Diffusivity as Biomarkers of Cerebral White Matter Microstructure > Potential Alternatives to Fractional Anisotropy, Axial Diffusivity, and Radial Diffusivity
What the sources say
- Supportedcites Raffelt et al., 2017 source
The Methods section (‘Fixel-based morphometry’; page unavailable) proposes a measure for each fixel, defined by its orientation and voxel location. The Conclusion (page unavailable) describes the resulting framework as fibre-specific and able to handle multiple fibre bundles within a voxel, supporting the citing sentence’s characterization. (LLM, conf=0.94)
plain- Asserted: passes — The authors put it forward as true.
- Checkable: passes — It can be checked against evidence.
- Load-bearing: fails — The paper’s conclusions may not depend on it.
- Based: passes — The paper gives a reason why it holds.
Probably not a substantial claim. The paper’s conclusions may not depend on it.
- Supported
A conclusion the paper draws from its own results — it cites no other source for it, so there is none to check. The quote shows it is in the paper.
In the paper
“As a result, MD and Trace values are theoretically more robust to multiple fiber populations and/or complex fiber geometries, and are likely the best DTI indicators of how tissues are constraining diffusion within a voxel.”
§ Potential Pitfalls of Using Fractional Anisotropy, Axial Diffusivity, and Radial Diffusivity as Biomarkers of Cerebral White Matter Microstructure > Potential Alternatives to Fractional Anisotropy, Axial Diffusivity, and Radial Diffusivity
hedgedcorrelational- Asserted: passes — The authors put it forward as true.
- Checkable: passes — It can be checked against evidence.
- Load-bearing: passes — The paper’s conclusions depend on it.
- Based: passes — The paper gives a reason why it holds.
It may state two separate claims as one.
In the paper
“NODDI can estimate neurite density in dendrites and axons, as well as orientation dispersion (i.e., fanning of neurites), which are factors that contribute to, but are distinct from DTI-based FA measures.”
§ Potential Pitfalls of Using Fractional Anisotropy, Axial Diffusivity, and Radial Diffusivity as Biomarkers of Cerebral White Matter Microstructure > Potential Alternatives to Fractional Anisotropy, Axial Diffusivity, and Radial Diffusivity
What the sources say
- Not checked — no full text of the sourcecites Zhang et al., 2012 source
plain- Asserted: passes — The authors put it forward as true.
- Checkable: passes — It can be checked against evidence.
- Load-bearing: unclear — It is unclear whether the paper’s conclusions depend on it.
- Based: passes — The paper gives a reason why it holds.
It may state two separate claims as one.
A conclusion the paper draws from its own results — it cites no other source for it, so there is none to check. The quote shows it is in the paper.
In the paper
“it suggests that strong biophysical interpretations and conclusions should not be drawn using FA, AD or RD measurements alone”
§ Potential Pitfalls of Using Fractional Anisotropy, Axial Diffusivity, and Radial Diffusivity as Biomarkers of Cerebral White Matter Microstructure > General Discussion
hedged- Asserted: passes — The authors put it forward as true.
- Checkable: fails — It may be too vague to check against evidence.
- Load-bearing: passes — The paper’s conclusions depend on it.
- Based: passes — The paper gives a reason why it holds.
Probably not a substantial claim. It may be too vague to check against evidence.
In the paper
“Orientation dispersion estimates the angular variability between neurites and provides a better measure than FA in regions with fanning or crossing fibers.”
§ Potential Pitfalls of Using Fractional Anisotropy, Axial Diffusivity, and Radial Diffusivity as Biomarkers of Cerebral White Matter Microstructure > Potential Alternatives to Fractional Anisotropy, Axial Diffusivity, and Radial Diffusivity
What the sources say
- Not checked — no full text of the sourcecites Zhang et al., 2012 source
plaincorrelational- Asserted: passes — The authors put it forward as true.
- Checkable: passes — It can be checked against evidence.
- Load-bearing: passes — The paper’s conclusions depend on it.
- Based: passes — The paper gives a reason why it holds.
It may state two separate claims as one.
The paper relies on this without support.
FA, AD, and RD are commonly used as MRI biomarkers of white matter microstructure in diffusion MRI studies of neurodevelopment, brain aging, and neurologic injury/disease.
“Fractional anisotropy (FA), axial diffusivity (AD), and radial diffusivity (RD) are commonly used as MRI biomarkers of white matter microstructure in diffusion MRI studies of neurodevelopment, brain aging, and neurologic injury/disease.”
The paper relies on this without support.
Many diffusion imaging end-users continue to apply and interpret FA, AD, and RD as standalone biomarkers of white matter microstructure, and this has not become common knowledge among them.
“based on the continued application and interpretation of these metrics in the broader biomedical/neuroscience literature, it appears that this has perhaps not yet become common knowledge among diffusion imaging end-users.”
The paper relies on this without support.
The conventional interpretation that higher FA values generally reflect greater white matter density is widely held.
“the conventional thinking was that all else being equal, higher FA values generally reflected greater white matter density”
Self-check
Percentages, sums and reported differences re-computed from the paper’s own numbers.
Each contradiction between two passages listed here was confirmed by an independent check.
Rated minor: it would not touch a result — a value no result rests on, a p-value that stays on the same side of the significance level, or a conflict that is clerical, resolved elsewhere in the paper, or outside its own findings.
In the paper
§ Potential Pitfalls of Using Fractional Anisotropy, Axial Diffusivity, and Radial Diffusivity as Biomarkers of Cerebral White Matter Microstructure > Demonstrating the Problem (Pitfall) > Thought Experiment #1: Interpreting Fractional Anisotropy Differences or Changes (Increases and Decreases)
“Bold arrow represents a relatively large increase (λ1 in part A)”
§ Potential Pitfalls of Using Fractional Anisotropy, Axial Diffusivity, and Radial Diffusivity as Biomarkers of Cerebral White Matter Microstructure > Demonstrating the Problem (Pitfall) > Thought Experiment #1: Interpreting Fractional Anisotropy Differences or Changes (Increases and Decreases)
“thin arrows represent a relatively small increase (λ1 and λ2 in part A)”
Rated minor: it would not touch a result — a value no result rests on, a p-value that stays on the same side of the significance level, or a conflict that is clerical, resolved elsewhere in the paper, or outside its own findings.
In the paper
§ Potential Pitfalls of Using Fractional Anisotropy, Axial Diffusivity, and Radial Diffusivity as Biomarkers of Cerebral White Matter Microstructure > Demonstrating the Problem (Pitfall) > Thought Experiment #2: Interpreting Fractional Anisotropy Equivalence or Stability
“if a multiple sclerosis (MS) lesion or traumatic brain injury damages all of the underlying fiber bundles within a particular region equally (e.g., increased membrane permeability and decreased myelination leading to an equal reduction in λ1, λ2, and λ3), FA will appear unchanged”
§ Potential Pitfalls of Using Fractional Anisotropy, Axial Diffusivity, and Radial Diffusivity as Biomarkers of Cerebral White Matter Microstructure > Demonstrating the Problem (Pitfall) > Thought Experiment #1: Interpreting Fractional Anisotropy Differences or Changes (Increases and Decreases)
“all three fibers experience the same amount of tissue damage, such that all three eigenvalues (λ1, λ2, and λ3) are increased proportionally”
Citations
Cites
The basis of anisotropic water diffusion in the nervous system—A technical review.
Beaulieu, C. (2002) · NMR in Biomedicine · doi:10.1002/nbm.782 · Cited by 4,628 · cited 3×
“Additionally, there have been several excellent in-depth reviews published on the biophysical interpretations of diffusion MRI signals (Beaulieu, 2002; Jelescu and Budde, 2017; Jelescu et al., 2020).”
BackgroundMethodBasser, P. J., & Pierpaoli, C. (1996) · Journal of Magnetic Resonance, Series B · doi:10.1006/jmrb.1996.0086 · Cited by 4,306 · cited 2×
“…of diffusion-encoding directions ( ≥ 6 orthogonal directions) (Alexander et al., 2007), is very easy to calculate (based on the common tensor model) (Basser and Pierpaoli, 1996), yields high test-retest and even inter-site/cross-scanner reliability (Vollmar et al., 2010; Luque Laguna et al., 2020),…”
BackgroundProbabilistic diffusion tractography with multiple fibre orientations: What can we gain?
Behrens, T. E. J., Berg, H. J., Jbabdi, S., Rushworth, M. F. S., & Woolrich, M. W. (2007) · NeuroImage · doi:10.1016/j.neuroimage.2006.09.018 · Cited by 3,471 · cited 2×
“…fiber geometries and/or multiple fiber bundles in different orientations (i.e., crossing fibers, kissing fibers, etc.) is now thought to be at least 33% (Behrens et al., 2007), and is more likely somewhere between 60 and 90% (Jeurissen et al., 2013) – with many regions thought to contain as many…”
BackgroundNODDI: Practical in vivo neurite orientation dispersion and density imaging of the human brain
Zhang, H., Schneider, T., Wheeler-Kingshott, C. A., & Alexander, D. C. (2012) · NeuroImage · doi:10.1016/j.neuroimage.2012.03.072 · Cited by 3,288 · cited 4×
“…to: diffusion kurtosis imaging (DKI) (Jensen et al., 2005; Jensen and Helpern, 2010), neurite orientation dispersion and density imaging (NODDI) (Zhang et al., 2012), tensor-valued diffusion encoding or b-tensor encoding (Szczepankiewicz et al., 2016, 2019), and novel fixel-based analysis…”
BackgroundMethodInfluentialCharacterization and propagation of uncertainty in diffusion-weighted MR imaging
Behrens, T. E. J., Woolrich, M. W., Jenkinson, M., Johansen‐Berg, H., Nunes, R. G., Clare, S., Matthews, P. M., Brady, J. M., & Smith, S. M. (2003) · Magnetic Resonance in Medicine · doi:10.1002/mrm.10609 · Cited by 3,038 · cited 2×
“…aspects of tissue microstructure, (2) non-invasively map the brain’s white matter pathways using deterministic (Mori et al., 1999) and/or probabilistic (Behrens et al., 2003) tractography approaches (Maier-Hein et al., 2017; Jeurissen et al., 2019), and (3) indirectly measure brain function (Le…”
BackgroundDiffusion tensor imaging of the brain
Alexander, A. L., Lee, J. E., Lazar, M., & Field, A. S. (2007) · Neurotherapeutics · doi:10.1016/j.nurt.2007.05.011 · Cited by 2,747
Jensen, J. H., Helpern, J. A., Ramani, A., Lu, H., & Kaczynski, K. (2005) · Magnetic Resonance in Medicine · doi:10.1002/mrm.20508 · Cited by 2,488 · cited 3×
“For example, DKI data acquired using conventional hardware and reasonable scan times can resolve crossing fibers significantly better than conventional DTI (Glenn et al., 2016), and certain DKI metrics such as kurtosis fractional anisotropy (KFA) and quantitative kurtosis tensor measures (e.g., radial tensor kurtosis) a…”
BackgroundWhite matter integrity, fiber count, and other fallacies: The do's and don'ts of diffusion MRI
Jones, D. K., Knösche, T. R., & Turner, R. (2013) · NeuroImage · doi:10.1016/j.neuroimage.2012.06.081 · Cited by 2,402 · cited 2×
“Indeed, the complex interactions between these factors and the resulting inability to ascribe apparent diffusion changes to any particular cause, is why (Jones et al., 2013) and others have advocated for researchers to exercise caution when interpreting DTI data and avoid drawing conclusions about microstructural or t…”
BackgroundTractography-based connectomes are dominated by false-positive connections
Maier-Hein, K. H., Neher, P., Houde, J.-C., Côté, M.-A., Garyfallidis, E., Zhong, J., Chamberland, M., Yeh, F.-C., Lin, Y.-C., Ji, Q., et al. (2016) · doi:10.1101/084137 · Cited by 1,376
MRI quantification of non-gaussian water diffusion by kurtosis analysis
Jensen, J. H., & Helpern, J. A. (2010) · NMR in Biomedicine · doi:10.1002/nbm.1518 · Cited by 1,251 · cited 3×
“For example, DKI data acquired using conventional hardware and reasonable scan times can resolve crossing fibers significantly better than conventional DTI (Glenn et al., 2016), and certain DKI metrics such as kurtosis fractional anisotropy (KFA) and quantitative kurtosis tensor measures (e.g., radial tensor kurtosis) a…”
Background
Cited by
Sorted by citations
Key, M. N., & Szabo‐Reed, A. N. (2023) · Nutrients · doi:10.3390/nu15112495 · Cited by 90
“A region with a high preference for a particular orientation will have a high FA value, indicating highly organized fibers, a sign of intact white matter tracts [32].”
BackgroundGong, Z., Bilgel, M., Kiely, M., Triebswetter, C., Ferrucci, L., Resnick, S. M., Spencer, R. G. S., & Bouhrara, M. (2023) · Alzheimer s & Dementia · doi:10.1002/alz.12968 · Cited by 76
“53,54 Therefore, the association between myelin content and cognition has not been directly established.”
An ALE meta-analytic review of musical expertise
Criscuolo, A., Pando‐Naude, V., Bonetti, L., Vuust, P., & Brattico, E. (2022) · Scientific Reports · doi:10.1038/s41598-022-14959-4 · Cited by 76
Hinojosa, C. A., George, G. C., & Ben‐Zion, Z. (2024) · Molecular Psychiatry · doi:10.1038/s41380-024-02558-w · Cited by 60
“The pattern of diffusivity can be computed using scalar measures such as fractional anisotropy (FA), whereby lower FA values illustrate a reduced axonal packing density [42].”
Gimbel, B. A., Anthony, M. E., Ernst, A. M., Roediger, D. J., de Water, E., Eckerle, J. K., Boys, C. J., Radke, J. P., Mueller, B. A., Fuglestad, A. J., et al. (2022) · Journal of Neurodevelopmental Disorders · doi:10.1186/s11689-022-09470-w · Cited by 39
“, NODDI) that allows for greater specificity with regard to white matter microstructure compared to traditional diffusion tensor imaging metrics such as FA and MD [54, 67].”
Background
Metadata
- Authors
- Figley, C. R., Uddin, M. N., Wong, K., Kornelsen, J., Puig, J., & Figley, T. D.
- Affiliations
- Health Sciences Centre (CA)
- University of Rochester Medicine (US)
- University of Manitoba (CA)
- Corresponding author
- Figley, Chase R.
- Venue
- Frontiers in Neuroscience
- Publisher
- Frontiers Media SA
- Published
- 2022-01-14
- Volume
- 15
- Pages
- 799576-799576
- ISSN
- 1662-453X (ISSN-L)
- PMC
- PMC8795606
- OpenAlex
- W4205639396
- Semantic Scholar
- be9d91e96b10025ed794c12fd9c9656efe11d15a
- Cited by
- 253
- References
- 54
- Citations by year
- 2026: 66 · 2025: 68 · 2024: 76 · 2023: 33 · 2022: 10
- FWCI
- 24.05
- Type
- journal article
- Language
- en
- Open access
- gold
- doi.org
- Licence
- Locations
- Frontiers in Neuroscience (publishedVersion, cc-by)
- PubMed (publishedVersion)
- PubMed Central (submittedVersion, cc-by)
- DOAJ (DOAJ: Directory of Open Access Journals) (submittedVersion, cc-by-sa)
- Funders
- Health Sciences Centre Foundation
- Research Manitoba
- Natural Sciences and Engineering Research Council of Canada
- Topics
- Health Sciences › Medicine › Radiology, Nuclear Medicine and Imaging › Advanced Neuroimaging Techniques and Applications
- Life Sciences › Neuroscience › Cognitive Neuroscience › Functional Brain Connectivity Studies
- Health Sciences › Medicine › Radiology, Nuclear Medicine and Imaging › Advanced MRI Techniques and Applications
- Keywords
- fractional anisotropy, axial diffusivity, radial diffusivity, white matter microstructure, diffusion MRI, crossing fibers, MRI biomarkers
About these checks
Registry, retraction, Cites and statistics results are computed, not judged, with one exception: a printed reference that no index lists is read once by a model before it counts as a citation error. Claims are extracted by a model and kept only when their quote appears verbatim in the text; each cited source is then checked, with a model’s help, for whether it says what the claim relies on. Those verdicts can be wrong — read the claim’s quote and the cited source before relying on one.
A language model drew the claims from the paper on 2026-10-18, under version 3 of the claim definition (model deepseek-v4.1-flash, prompt extract-v3).
A second model labelled each claim on 2026-10-18 (model jev-1.13-20260917, definition revision gold-guideline-v0.2).
Cited sources are checked with a language model’s help (gpt-6-sol).
Statistics and arithmetic are recomputed, not judged.
Confidence bands are shown only for fields calibrated on our annotated test set. None is calibrated yet, so no band is shown.
What counts as a claim ›How we measure confidence ›How we check this ›
Are you an author, or do you see a problem with this page? Request a review
