

The DOI matches its Crossref record; 81 of the 83 references it cites were found in a registry or an index.
Visual Surround Suppression in Schizophrenia
Open accessAbstract
Compared to unaffected observers patients with schizophrenia (SZ) show characteristic differences in visual perception, including a reduced susceptibility to the influence of context on judgments of contrast - a manifestation of weaker surround suppression (SS). To examine the generality of this phenomenon we measured the ability of 24 individuals with SZ to judge the luminance, contrast, orientation, and size of targets embedded in contextual surrounds that would typically influence the target's appearance. Individuals with SZ demonstrated weaker SS compared to matched controls for stimuli defined by contrast or size, but not for those defined by luminance or orientation. As perceived luminance is thought to be regulated at the earliest stages of visual processing our findings are consistent with a suppression deficit that is predominantly cortical in origin. In addition, we propose that preserved orientation SS in SZ may reflect the sparing of broadly tuned mechanisms of suppression. We attempt to reconcile these data with findings from previous studies.
Overview
The claims and statistics of this paper haven’t been checked yet.
Run the check — free, no account needed. It reads the open-access text and checks the sources it cites.
Integrity signals
Registry
Cites
Statistics
Figures
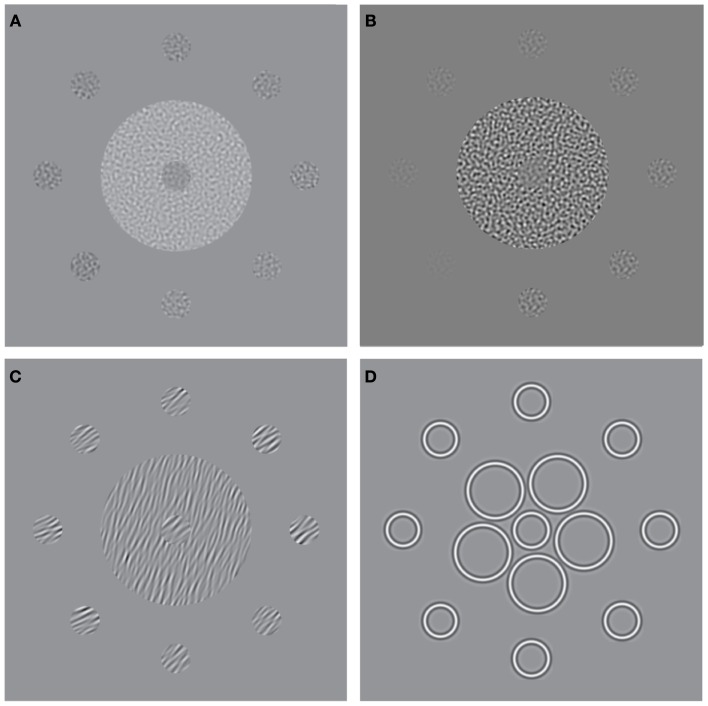
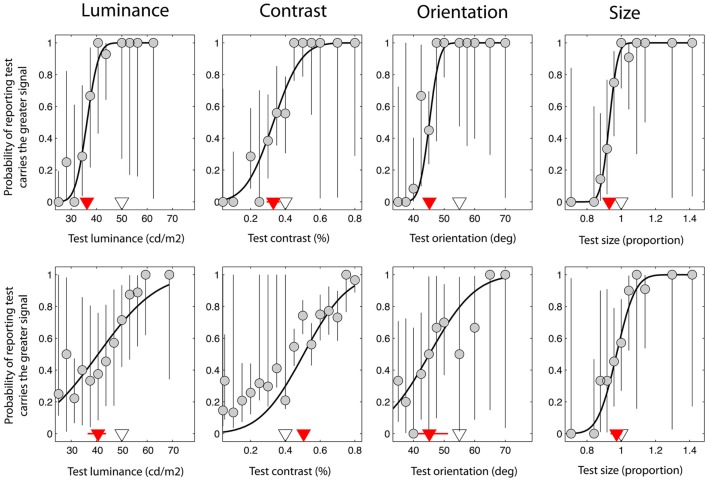
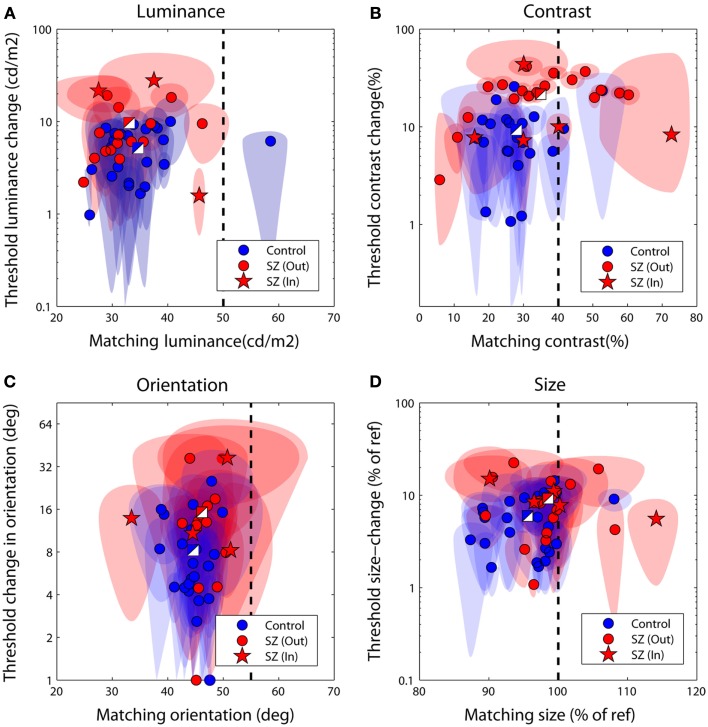
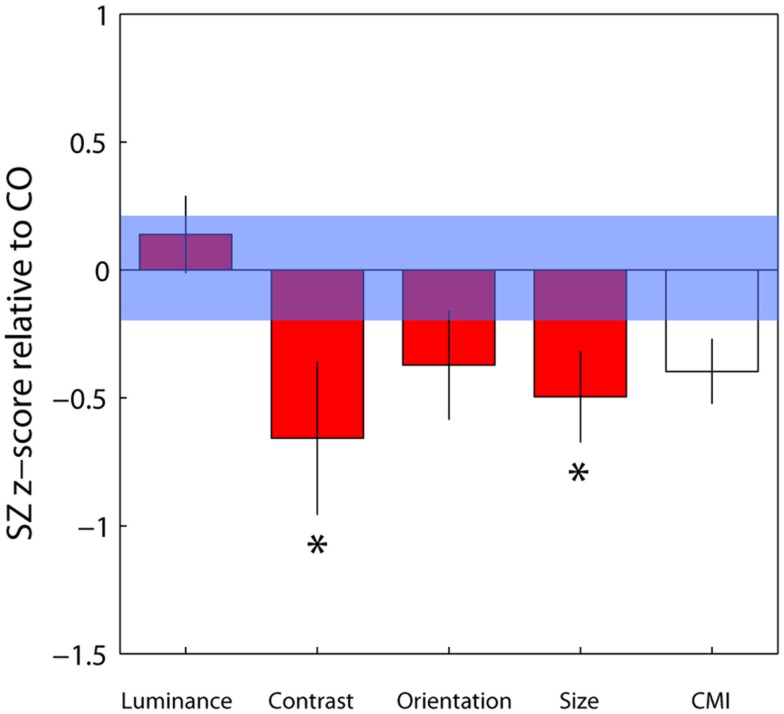
Verification
Claims the paper makes
The claims and statistics of this paper haven’t been checked yet.
Run the check — free, no account needed. It reads the open-access text and checks the sources it cites.
Claims other papers make about this one
Each is checked against this paper’s own text: does it say what the citing paper says it does?
The source backs part of the claim, not all of it — or backs it for a different population, condition or comparison.
In the citing paper
“Thus, these authors hypothesized that the pre-cortical stages of the visual system, in which luminance is supposed to be processed, were spared, thereby contradicting Norton's conclusions.”
From What visual illusions teach us about schizophrenia (2014) · cites this paper as Tibber et al., 2013
Experimental — accuracy not yet measuredIn the citing paper
“Our findings are therefore not at odds with decreased susceptibility to some visual illusions in schizophrenic patients (37,38,40,41).”
From Shift toward prior knowledge confers a perceptual advantage in early psychosis and psychosis-prone healthy individuals (2015) · cites this paper as [38]
In the citing paper
“This previous effect is most likely related to well-established schizophrenic deficits in early and midlevel vision that affect perceptual organization, context processing and integration (37,38,(48)(49)(50)(51)(52)(53) rather than to top-down influences from high-level visual cognition as in the current study.”
From Shift toward prior knowledge confers a perceptual advantage in early psychosis and psychosis-prone healthy individuals (2015) · cites this paper as [38]
In the citing paper
“Yang et al. (2012) and Tibber et al. (2013) found that luminance context processing was similar, whereas the strength of the illusions was inferior in patients for the other psychophysical parameters (e.g., contrast, orientation, size or motion).”
From What visual illusions teach us about schizophrenia (2014) · cites this paper as Tibber et al., 2013
In the citing paper
“Some authors have argued, in line with the findings that stem from the study of VIs, that the impairment of gain control is a robust and significant property of visual processing in schizophrenia, and may even consider it a core feature of the disorder (Robol et al., 2013; Tibber et al., 2013).”
From What visual illusions teach us about schizophrenia (2014) · cites this paper as Tibber et al., 2013
In the citing paper
“While some authors found no or only weak relationships between VIs and psychopathology (Koethe et al., 2006, 2009; Tibber et al., 2013; Yang et al., 2013)”
From What visual illusions teach us about schizophrenia (2014) · cites this paper as Tibber et al., 2013
Self-check
Percentages, sums and reported differences re-computed from the paper’s own numbers.
The self-check needs the paper’s full text.
Citations
Cites
Brainard, D. H. (1997) · Spatial Vision · doi:10.1163/156856897x00357 · Cited by 20,012
The VideoToolbox software for visual psychophysics: transforming numbers into movies
Pelli, D. G. (1997) · Spatial Vision · doi:10.1163/156856897x00366 · Cited by 11,110
The Dopamine Hypothesis of Schizophrenia: Version III--The Final Common Pathway
Howes, O. D., & Kapur, S. (2009) · Schizophrenia Bulletin · doi:10.1093/schbul/sbp006 · Cited by 2,693
Chlorpromazine Equivalent Doses for the Newer Atypical Antipsychotics
Woods, S. W. (2003) · The Journal of Clinical Psychiatry · doi:10.4088/jcp.v64n0607 · Cited by 2,056
Normalization as a canonical neural computation
Carandini, M., & Heeger, D. J. (2012) · Nature Reviews Neuroscience · doi:10.1038/nrn3136 · Cited by 1,906
Normalization of cell responses in cat striate cortex
Heeger, D. J. (1992) · Visual Neuroscience · doi:10.1017/s0952523800009640 · Cited by 1,835
Context, cortex, and dopamine: A connectionist approach to behavior and biology in schizophrenia.
Cohen, J. D., & Servan‐Schreiber, D. (1992) · Psychological Review · doi:10.1037/0033-295x.99.1.45 · Cited by 1,513
Ceramide-orchestrated signalling in cancer cells
Morad, S. A. F., & Cabot, M. C. (2012) · Nature reviews. Cancer · doi:10.1038/nrc3398 · Cited by 1,032
The Maudsley Prescribing Guidelines in Psychiatry
Taylor, D. M., Barnes, T. R. E., & Young, A. H. (2021) · Wiley eBooks · doi:10.1002/9781119870203 · Cited by 995
Chapter 9 Visual adaptation and retinal gain controls
Shapley, R. M., & Enroth‐Cugell, C. (1984) · Progress in Retinal Research · doi:10.1016/0278-4327(84)90011-7 · Cited by 888
Cited by
Sorted by citations
Robertson, C. E., & Baron-Cohen, S. (2017) · Nature Reviews Neuroscience · doi:10.1038/nrn.2017.112 · Cited by 1,157
With or without you: predictive coding and Bayesian inference in the brain
Aitchison, L., & Lengyel, M. (2017) · Current Opinion in Neurobiology · doi:10.1016/j.conb.2017.08.010 · Cited by 308
Teufel, C., Subramaniam, N., Dobler, V., Perez, J., Finnemann, J., Mehta, P. R., Goodyer, I. M., & Fletcher, P. C. (2015) · Proceedings of the National Academy of Sciences · doi:10.1073/pnas.1503916112 · Cited by 308
Silverstein, S. M., & Rosen, R. B. (2015) · Schizophrenia Research Cognition · doi:10.1016/j.scog.2015.03.004 · Cited by 189
What visual illusions teach us about schizophrenia
Notredame, C.-E., Pins, D., Deneve, S., & Jardri, R. (2014) · Frontiers in Integrative Neuroscience · doi:10.3389/fnint.2014.00063 · Cited by 177
A computational perspective on autism
Rosenberg, A., Patterson, J. S., & Angelaki, D. E. (2015) · Proceedings of the National Academy of Sciences · doi:10.1073/pnas.1510583112 · Cited by 156
Visual Perception Disturbances in Schizophrenia: A Unified Model
Silverstein, S. M. (2016) · Nebraska Symposium on Motivation/The Nebraska symposium on motivation · doi:10.1007/978-3-319-30596-7_4 · Cited by 147
A review of abnormalities in the perception of visual illusions in schizophrenia
Griffiths-King, D. J., Hodgekins, J., Chouinard, P. A., Chouinard, V., & Sperandio, I. (2016) · Psychonomic Bulletin & Review · doi:10.3758/s13423-016-1168-5 · Cited by 112
Decision-making in schizophrenia: A predictive-coding perspective
Sterzer, P., Voss, M., Schlagenhauf, F., & Heinz, A. (2018) · NeuroImage · doi:10.1016/j.neuroimage.2018.05.074 · Cited by 105
The tilt illusion: Phenomenology and functional implications
Clifford, C. W. G. (2014) · Vision Research · doi:10.1016/j.visres.2014.06.009 · Cited by 99
On the functions, mechanisms, and malfunctions of intracortical contextual modulation
Phillips, W. A., Clark, A., & Silverstein, S. M. (2015) · Neuroscience & Biobehavioral Reviews · doi:10.1016/j.neubiorev.2015.02.010 · Cited by 94
Michaiel, A. M., Parker, P. R. L., & Niell, C. M. (2019) · Cell Reports · doi:10.1016/j.celrep.2019.02.104 · Cited by 82
Recent updates of eye movement abnormalities in patients with schizophrenia: A scoping review
Wolf, A., Ueda, K., & Hirano, Y. (2020) · Psychiatry and Clinical Neurosciences · doi:10.1111/pcn.13188 · Cited by 83
Sterzer, P., Mishara, A. L., Voss, M., & Heinz, A. (2016) · Frontiers in Human Neuroscience · doi:10.3389/fnhum.2016.00502 · Cited by 76
Schallmo, M., Sponheim, S. R., & Olman, C. A. (2015) · Psychological Medicine · doi:10.1017/s0033291715001439 · Cited by 63
Silverstein, S. M., Keane, B. P., Wang, Y., Mikkilineni, D., Paterno, D., Papathomas, T. V., & Feigenson, K. (2013) · Frontiers in Psychology · doi:10.3389/fpsyg.2013.00466 · Cited by 58
Yoon, J. H., Sheremata, S., Rokem, A., & Silver, M. A. (2013) · Frontiers in Psychology · doi:10.3389/fpsyg.2013.00681 · Cited by 61
Visual Population Receptive Fields in People with Schizophrenia Have Reduced Inhibitory Surrounds
Anderson, E. J., Tibber, M. S., Schwarzkopf, D. S., Shergill, S. S., Fernández-Egea, E., Rees, G. E., & Dakin, S. C. (2016) · Journal of Neuroscience · doi:10.1523/jneurosci.3620-15.2016 · Cited by 56
Self-citationIs the perception of illusions abnormal in schizophrenia?
Grzeczkowski, L., Roinishvili, M., Chkonia, E. D., Brand, A., Mast, F. W., Herzog, M. H., & Shaqiri, A. (2018) · Psychiatry Research · doi:10.1016/j.psychres.2018.10.063 · Cited by 51
Reduced visual contrast suppression during major depressive episodes
Salmela, V. R., Socada, J. L., Söderholm, J. J., Heikkilä, R., Lahti, J. M. T., Ekelund, J., & Isometsä, E. T. (2021) · Journal of Psychiatry and Neuroscience · doi:10.1503/jpn.200091 · Cited by 50
Serrano‐Pedraza, I., Romero‐Ferreiro, V., Read, J. C. A., Diéguez-Risco, T., Bagney, A., Caballero-González, M., Rodríguez-Torresano, J., & Rodríguez–Jiménez, R. (2014) · Frontiers in Psychology · doi:10.3389/fpsyg.2014.01431 · Cited by 48
Resolving the Delusion Paradox
Petrović, P., & Sterzer, P. (2023) · Schizophrenia Bulletin · doi:10.1093/schbul/sbad084 · Cited by 45
Bao, M., Dong, B., Liu, L., Engel, S. A., & Jiang, Y. (2017) · Psychological Science · doi:10.1177/0956797617728126 · Cited by 46
Abnormal contextual modulation of visual contour detection in patients with schizophrenia
Schallmo, M.-P., Sponheim, S. R., & Olman, C. A. (2013) · PLoS ONE · doi:10.1371/journal.pone.0068090 · Cited by 41
“A recent report suggested attentional factors may account for the weak contrast-contrast effect [24] observed when schizophrenia patients reported the perceived contrast of stimuli with and without surrounding context [18] (but see [22]).”
BackgroundVision in schizophrenia: why it matters
Silverstein, S. M., Keane, B. P., Blake, R., Giersch, A., Green, M. E., & Kéri, S. (2015) · Frontiers in Psychology · doi:10.3389/fpsyg.2015.00041 · Cited by 46
Visual context processing in bipolar disorder: a comparison with schizophrenia
Yang, E., Tadin, D., Glasser, D. M., Wook Hong, S., Blake, R., & Park, S. (2013) · Frontiers in Psychology · doi:10.3389/fpsyg.2013.00569 · Cited by 38
Robol, V., Tibber, M. S., Anderson, E. J., Bobin, T., Carlin, P., Shergill, S. S., & Dakin, S. C. (2013) · PLoS ONE · doi:10.1371/journal.pone.0060951 · Cited by 37
Self-citationDaily vision testing can expose the prodromal phase of migraine
McKendrick, A. M., Chan, Y. M., Vingrys, A. J., Turpin, A. H., & Badcock, D. R. (2017) · Cephalalgia · doi:10.1177/0333102417741130 · Cited by 36
Mittal, V. A., Gupta, T., Keane, B. P., & Silverstein, S. M. (2015) · Journal of Abnormal Psychology · doi:10.1037/abn0000082 · Cited by 37
Two common psychophysical measures of surround suppression reflect independent neuronal mechanisms
Yazdani, P., Serrano‐Pedraza, I., Whittaker, R. G., Trevelyan, A. J., & Read, J. C. A. (2015) · Journal of Vision · doi:10.1167/15.13.21 · Cited by 33
Local and Global Limits on Visual Processing in Schizophrenia
Tibber, M. S., Anderson, E. J., Bobin, T., Carlin, P., Shergill, S. S., & Dakin, S. C. (2015) · PLoS ONE · doi:10.1371/journal.pone.0117951 · Cited by 32
Self-citationNo evidence for abnormal priors in early vision in schizophrenia
Kaliuzhna, M., Stein, T., Rusch, T., Sekutowicz, M., Sterzer, P., & Seymour, K. J. (2018) · Schizophrenia Research · doi:10.1016/j.schres.2018.12.027 · Cited by 31
Late, not early, stages of Kanizsa shape perception are compromised in schizophrenia
Keane, B. P., Joseph, J., & Silverstein, S. M. (2014) · Neuropsychologia · doi:10.1016/j.neuropsychologia.2014.02.001 · Cited by 32
Reduced influence of perceptual context in schizophrenia: behavioral and neurophysiological evidence
Pokorny, V., Lano, T. J., Schallmo, M., Olman, C. A., & Sponheim, S. R. (2019) · Psychological Medicine · doi:10.1017/s0033291719003751 · Cited by 28
A review of visual aftereffects in schizophrenia
Thakkar, K. N., Silverstein, S. M., & Brascamp, J. W. (2019) · Neuroscience & Biobehavioral Reviews · doi:10.1016/j.neubiorev.2019.03.021 · Cited by 25
Systematic review of visual illusions in schizophrenia
Costa, A. L. L., Costa, D. L., Pessoa, V. F., Caixeta, F. V., & Maior, R. S. (2023) · Schizophrenia Research · doi:10.1016/j.schres.2022.12.030 · Cited by 22
Bressan, P., & Krämer, P. (2013) · Frontiers in Psychology · doi:10.3389/fpsyg.2013.00343 · Cited by 21
Oscillatory Traveling Waves Provide Evidence for Predictive Coding Abnormalities in Schizophrenia
Alamia, A., Gordillo, D., Chkonia, E. D., Roinishvili, M., Cappe, C., & Herzog, M. H. (2024) · Biological Psychiatry · doi:10.1016/j.biopsych.2024.11.014 · Cited by 21
Comparison of visual perceptual organization in schizophrenia and body dysmorphic disorder
Silverstein, S. M., Elliott, C. M., Feusner, J. D., Keane, B. P., Mikkilineni, D., Hansen, N. S., Hartmann, A. S., & Wilhelm, S. (2015) · Psychiatry Research · doi:10.1016/j.psychres.2015.05.107 · Cited by 19
A bias-free measure of the tilt illusion
Patten, M. L. W., & Clifford, C. W. G. (2015) · Journal of Vision · doi:10.1167/15.15.8 · Cited by 17
Stronger tilt aftereffects in persons with schizophrenia.
Thakkar, K. N., Ghermezi, L., Silverstein, S. M., Slate, R., Yao, B., Achtyes, E. D., & Brascamp, J. W. (2020) · Journal of Abnormal Psychology · doi:10.1037/abn0000653 · Cited by 15
Nguyen, B. N., & McKendrick, A. M. (2016) · Frontiers in Aging Neuroscience · doi:10.3389/fnagi.2016.00079 · Cited by 15
Adaptive sensory coding of gaze direction in schizophrenia
Palmer, C. J., Caruana, N., Clifford, C. W. G., & Seymour, K. J. (2018) · Royal Society Open Science · doi:10.1098/rsos.180886 · Cited by 13
Most Findings Obtained With Untimed Visual Illusions Are Confounded
Bressan, P., & Krämer, P. (2021) · Psychological Science · doi:10.1177/0956797621994268 · Cited by 15
Nguyen, B. N., & McKendrick, A. M. (2016) · Journal of Vision · doi:10.1167/16.3.10 · Cited by 15
Visual illusions in young people reporting psychotic-like experiences
Sperandio, I., Chouinard, P. A., Paice, E., Griffiths-King, D., & Hodgekins, J. (2023) · Journal of Behavior Therapy and Experimental Psychiatry · doi:10.1016/j.jbtep.2023.101839 · Cited by 15
Visual surround suppression at the neural and perceptual levels
Li, Y., Dai, W., Wang, T., Wu, Y., Dou, F., & Xing, D. (2023) · Cognitive Neurodynamics · doi:10.1007/s11571-023-10027-3 · Cited by 16
Examining motion speed processing in schizophrenia using the flash lag illusion
Kaliuzhna, M., Stein, T., Sterzer, P., & Seymour, K. J. (2019) · Schizophrenia Research Cognition · doi:10.1016/j.scog.2019.100165 · Cited by 13
Crowding, grouping, and gain control in schizophrenia
Roinishvili, M., Cappe, C., Shaqiri, A., Brand, A., Rürup, L., Chkonia, E. D., & Herzog, M. H. (2015) · Psychiatry Research · doi:10.1016/j.psychres.2015.01.009 · Cited by 14
Intact Serial Dependence in Schizophrenia: Evidence from an Orientation Adjustment Task
Pascucci, D., Roinishvili, M., Chkonia, E. D., Brand, A., Whitney, D. C., Herzog, M. H., & Manassi, M. (2024) · Schizophrenia Bulletin · doi:10.1093/schbul/sbae106 · Cited by 12
Spatial Suppression and Sensitivity for Motion in Schizophrenia
Linares, D., Amoretti, S., Marin-Campos, R., Sousa, A., Prades, L., Dalmau, J. O., Bernardo, M., & Compte, A. (2020) · Schizophrenia Bulletin Open · doi:10.1093/schizbullopen/sgaa045 · Cited by 10
The psychosis human connectome project: Design and rationale for studies of visual neurophysiology
Schallmo, M., Weldon, K. B., Kamath, R. S., Moser, H. R., Montoya, S. A., Killebrew, K. W., Demro, C., Grant, A., Marjańska, M., Sponheim, S. R., et al. (2023) · NeuroImage · doi:10.1016/j.neuroimage.2023.120060 · Cited by 9
Illusions, Delusions, and Your Backwards Bayesian Brain: A Biased Visual Perspective
Born, R. T., & Bencomo, G. (2020) · Brain Behavior and Evolution · doi:10.1159/000514859 · Cited by 12
Intact prioritisation of unconscious face processing in schizophrenia
Caruana, N., Stein, T., Watson, T., Williams, N., & Seymour, K. J. (2019) · Cognitive Neuropsychiatry · doi:10.1080/13546805.2019.1590189 · Cited by 12
Zhuo, C., Tian, H., Fang, T., Li, R., Li, Y., Kong, L., Cai, Z., Zheng, L., Lin, X., & Chen, C. (2020) · Europe PMC (PubMed Central) · Cited by 9
Visual salience is affected in participants with schizophrenia during free-viewing
Yoshida, M., Miura, K., Fujimoto, M., Yamamori, H., Yasuda, Y., Iwase, M., & Hashimoto, R. (2024) · Scientific Reports · doi:10.1038/s41598-024-55359-0 · Cited by 11
Continuous flash suppression operates in local spatial zones: Effects of mask size and contrast
Han, S., Lukaszewski, R., & Alais, D. (2018) · Vision Research · doi:10.1016/j.visres.2018.11.006 · Cited by 9
Effects of altered‐reality training on interocular disinhibition in amblyopia
Du, X., Liu, L., Dong, X., & Bao, M. (2023) · Annals of the New York Academy of Sciences · doi:10.1111/nyas.14969 · Cited by 9
A Parametric Framework to Generate Visual Illusions Using Python
Makowski, D., Lau, Z. J., Pham, T., Boyce, W. P., & Chen, S. A. (2021) · Perception · doi:10.1177/03010066211057347 · Cited by 8
Pokorny, V., Schallmo, M., Sponheim, S. R., & Olman, C. A. (2023) · Journal of Vision · doi:10.1167/jov.23.2.2 · Cited by 9
Ludwig, S., Spitzer, B., Jacobs, A. M., Sekutowicz, M., Sterzer, P., & Blankenburg, F. (2016) · NeuroImage Clinical · doi:10.1016/j.nicl.2016.04.004 · Cited by 10
Schallmo, M., Sponheim, S. R., & Olman, C. A. (2013) · PLoS ONE · doi:10.1371/annotation/f082ec4d-419c-43ce-ae50-e05107539bf3 · Cited by 8
Size Contrast and Assimilation in the Delboeuf and Ebbinghaus Illusions
Mruczek, R. E. B., Blair, C. D., Strother, L., & Caplovitz, G. P. (2017) · doi:10.1093/acprof:oso/9780199794607.003.0028 · Cited by 7
Intact and deficient contextual processing in schizophrenia patients
Choung, O.-H., Gordillo, D., Roinishvili, M., Brand, A., Herzog, M. H., & Chkonia, E. D. (2022) · Schizophrenia Research Cognition · doi:10.1016/j.scog.2022.100265 · Cited by 7
Mannion, D. J., Donkin, C., & Whitford, T. J. (2017) · PeerJ · doi:10.7717/peerj.2921 · Cited by 7
Mechanisms Underlying Visuospatial Working Memory Impairments in Schizophrenia
Ichinose, M. C., & Park, S. (2019) · Current topics in behavioral neurosciences · doi:10.1007/7854_2019_99 · Cited by 7
Static and Dynamic Dysconnectivity in Early Psychosis: Relationship With Symptom Dimensions
Cattarinussi, G., Grimaldi, D. A., Aarabi, M. H., & Sambataro, F. (2024) · Schizophrenia Bulletin · doi:10.1093/schbul/sbae142 · Cited by 7
Han, C., Wang, B., Peng, X., Li, M., Zhang, Z., Yao, C., Tu, M., Chen, X., Zhou, J., Wang, C., et al. (2025) · Translational Psychiatry · doi:10.1038/s41398-025-03426-z · Cited by 6
Dong, X., Liu, L., Du, X., Wang, Y., Zhang, P., Li, Z., & Bao, M. (2023) · Human Brain Mapping · doi:10.1002/hbm.26526 · Cited by 5
Freeman, E. D. (2020) · Cortex · doi:10.1016/j.cortex.2020.06.014 · Cited by 5
Embedded figures in schizophrenia: A main deficit but no specificity
Favrod, O., Brand, A., Berdzenishvili, E., Chkonia, E. D., Akselrod, M., Wagemans, J. P., Herzog, M. H., & Roinishvili, M. (2021) · Schizophrenia Research Cognition · doi:10.1016/j.scog.2021.100227 · Cited by 5
Faster bi-stable visual switching in psychosis
Killebrew, K. W., Moser, H. R., Grant, A., Marjańska, M., Sponheim, S. R., & Schallmo, M. (2024) · Translational Psychiatry · doi:10.1038/s41398-024-02913-z · Cited by 4
Swanson, L. R., Jungers, S., Varghese, R., Cullen, K. R., Evans, M. D., Nielson, J. L., & Schallmo, M. (2024) · Journal of Vision · doi:10.1167/jov.24.12.5 · Cited by 6
Seymour, K. J., & Kaliuzhna, M. (2022) · Schizophrenia Research Cognition · doi:10.1016/j.scog.2022.100256 · Cited by 4
Lányi, O., Kéri, S., Pálffy, Z., & Polner, B. (2024) · Schizophrenia Research · doi:10.1016/j.schres.2023.12.023 · Cited by 4
Painting psychosis: an empirical investigation of the self-portraits of Edvard Munch
Bettelheim, E. C., Liu, J., Dazzan, P., & Turkheimer, F. (2026) · Frontiers in Psychiatry · doi:10.3389/fpsyt.2025.1643264 · Cited by 5
Miura, K., Yoshida, M., Morita, K., Fujimoto, M., Yasuda, Y., Yamamori, H., Takahashi, J., Miyata, S., Okazaki, K., Matsumoto, J., et al. (2024) · Molecular Psychiatry · doi:10.1038/s41380-024-02773-5 · Cited by 3
Giersch, A., & Laprévote, V. (2022) · Current topics in behavioral neurosciences · doi:10.1007/7854_2022_393 · Cited by 2
A decision-time account of individual variability in context-dependent orientation estimation
Dekel, R., & Sagi, D. (2020) · Vision Research · doi:10.1016/j.visres.2020.08.002 · Cited by 3
Perceptual Center-Surround Contrast Suppression in Adolescence
Nguyen, B. N., Ramakrishnan, B., Narayanan, A., Hussaindeen, J. R., & McKendrick, A. M. (2023) · Investigative Ophthalmology & Visual Science · doi:10.1167/iovs.64.5.14 · Cited by 4
Aberrant visual salience in participants with schizophrenia during free-viewing of natural imagesPreprint
Yoshida, M., Miura, K., Fujimoto, M., Yamamori, H., Yasuda, Y., Iwase, M., & Hashimoto, R. (2022) · medRxiv · doi:10.1101/2022.11.21.22282553 · Cited by 3
Contò, F., Agosta, S., Tadin, D., Pascual‐Leone, Á., & Battelli, L. (2026) · International Review of Psychiatry · doi:10.1080/09540261.2026.2677894 · Cited by 2
Klein, S. D., Teich, C. D., Pokorny, V., Rawls, E., Olman, C. A., & Sponheim, S. R. (2024) · Schizophrenia Bulletin · doi:10.1093/schbul/sbae103 · Cited by 2
Balancing prior knowledge and sensory data in a predictive coding model of coherent motion detection
Nemati, E., Grayden, D. B., Burkitt, A. N., & Eskikand, P. Z. (2025) · PLoS Computational Biology · doi:10.1371/journal.pcbi.1013116 · Cited by 2
Contrast–contrast asynchronies
Rose-Henig, A., & Shapiro, A. (2014) · Journal of the Optical Society of America A · doi:10.1364/josaa.31.00a232 · Cited by 2
Spatial suppression and sensitivity for motion in schizophreniaPreprint
Linares, D., Amoretti, S., Marin-Campos, R., Sousa, A., Prades, L., Dalmau, J. O., Bernardo, M., & Compte, A. (2019) · bioRxiv (Cold Spring Harbor Laboratory) · doi:10.1101/799395 · Cited by 2
Kaiser, K. A., Thompson, J. L., Butler, P. D., Ahmed, A. O., Seitz, A. R., Sobeih, T. M., & Silverstein, S. M. (2025) · Schizophrenia Research · doi:10.1016/j.schres.2025.02.011 · Cited by 1
Babadi, B., Holt, D. J., & Tootell, R. B. H. (2025) · Biological Psychiatry Cognitive Neuroscience and Neuroimaging · doi:10.1016/j.bpsc.2025.05.009 · Cited by 1
Perception of Visual Illusions in Children and Teenagers With ADHD
Montiel, V., Navarrete, V., González-Pérez, A. M., de Alba, C. V., Sánchez, R. D., Szenczi, P., Rosetti, M., Ulloa, R. E., & Bánszegi, O. (2025) · Journal of Attention Disorders · doi:10.1177/10870547251369665 · Cited by 1
Visual suppression deficits as a biomarker of working memory impairment in schizophrenia
Filannino, C., Freeman, E. D., Parton, A. D., Laxhman, N., & Haenschel, C. (2025) · Schizophrenia Research Cognition · doi:10.1016/j.scog.2025.100395 · Cited by 1
Importancia diferencial de los componentes fundamentales de la esquizotipia: un metaanálisis
Fumero, A., Rodríguez, M. G., Roa, A., & Peñate, W. (2016) · Revista Latinoamericana de Psicología · doi:10.1016/j.rlp.2016.09.001 · Cited by 1
Contrast Sensitivity on 1/f Noise Is More Greatly Impacted by Older Age for the Fovea Than Parafovea
Srinivasan, R., Turpin, A. H., & McKendrick, A. M. (2021) · Optometry and Vision Science · doi:10.1097/opx.0000000000001676 · Cited by 1
Does Cortical Inhibition Explain the Correlation Between Bistable Perception Paradigms?
Jagtap, A. R., & Brascamp, J. W. (2021) · i-Perception · doi:10.1177/20416695211020018
Enhanced visual contrast suppression during peak psilocybin effects: A psychophysical studyPreprint
Swanson, L. R., Jungers, S., Varghese, R., Cullen, K. R., Evans, M. D., Nielson, J. L., & Schallmo, M. (2024) · doi:10.31234/osf.io/5rm62 · Cited by 1
Barz, C. S. (2014) · Research Publications (Maastricht University) · doi:10.26481/dis.20140630cb
Modulation by visual context beyond local features
Qiu, C. (2015) · University of Minnesota Digital Conservancy (University of Minnesota)
Local and Iterative Visual Processing Deficits in Schizophrenia
Espensen-Sturges, T. D. (2017) · University of Minnesota Digital Conservancy (University of Minnesota)
Dynamic Visual Processing: Creating Representations of the World
Michaiel, A. M. (2020) · Scholars' Bank (University of Oregon)
Continuous flash suppression operates in local spatial zones: effects of mask size and contrastPreprint
Han, S., Lukaszewski, R., & Alais, D. (2018) · doi:10.31234/osf.io/83wjy
Metadata
- Authors
- Tibber, M. S., Anderson, E. J., Bobin, T., Antonova, E., Seabright, A., Wright, B., Carlin, P., Shergill, S. S., & Dakin, S. C.
- Affiliations
- National Institute for Health and Care Research (GB)
- NIHR Moorfields Biomedical Research Centre (GB)
- King's College London (GB)
- University College London (GB)
- Corresponding author
- Tibber, Marc S.
- Venue
- Frontiers in Psychology
- Publisher
- Frontiers Media SA
- Published
- 2013
- Volume
- 4
- Pages
- 88-88
- ISSN
- 1664-1078 (ISSN-L)
- PMC
- PMC3584288
- OpenAlex
- W2129294405
- Cited by
- 116
- References
- 83
- Citations by year
- 2026: 7 · 2025: 7 · 2024: 11 · 2023: 11 · 2022: 6 · 2021: 6 · 2020: 8 · 2019: 7 · 2018: 8 · 2017: 11 · 2016: 8 · 2015: 13 · 2014: 6 · 2013: 7
- FWCI
- 6.22
- Type
- journal article
- Language
- en
- Update notices
- corrigendum (2019-08-22)
- Open access
- gold
- doi.org
- Licence
- cc-by
- Locations
- Frontiers in Psychology (publishedVersion, cc-by)
- Europe PMC (PubMed Central) (publishedVersion, cc-by)
- PubMed Central (publishedVersion, cc-by)
- PubMed (publishedVersion)
- Repository@Hull (Worktribe) (University of Hull) (submittedVersion, cc-by)
- DOAJ (DOAJ: Directory of Open Access Journals) (submittedVersion)
- UCL Discovery (University College London) (submittedVersion)
- Research Portal (King's College London) (submittedVersion, cc-by)
- ResearchSpace (University of Auckland) (submittedVersion, cc-by)
- Brunel University Research Archive (BURA) (Brunel University London) (submittedVersion)
- Funders
- Wellcome Trust
- Topics
- Life Sciences › Neuroscience › Cognitive Neuroscience › Visual perception and processing mechanisms
- Health Sciences › Medicine › Psychiatry and Mental health › Schizophrenia research and treatment
- Life Sciences › Neuroscience › Cognitive Neuroscience › Hallucinations in medical conditions
- Keywords
- schizophrenia, surround suppression, visual perception, contrast perception, luminance perception, orientation perception, size perception
About these checks
Registry, retraction, Cites and statistics results are computed, not judged, with one exception: a printed reference that no index lists is read once by a model before it counts as a citation error. Claims are extracted by a model and kept only when their quote appears verbatim in the text; each cited source is then checked, with a model’s help, for whether it says what the claim relies on. Those verdicts can be wrong — read the claim’s quote and the cited source before relying on one.
Statistics and arithmetic are recomputed, not judged.
Confidence bands are shown only for fields calibrated on our annotated test set. None is calibrated yet, so no band is shown.
What counts as a claim ›How we measure confidence ›How we check this ›
Are you an author, or do you see a problem with this page? Request a review
