

Influences on PET Quantification and Interpretation
Open accessThe DOI matches its Crossref record; 226 of the 239 references it cites were found in a registry or an index; 188 of the 275 sources its claims cite were checked for support.
Abstract
Various factors have been identified that influence quantitative accuracy and image interpretation in positron emission tomography (PET).
Overview
CoChat Summary
TL;DR
This review summarizes the many patient, protocol, hardware, and reconstruction factors that affect PET quantification and visual interpretation, with emphasis on FDG-PET and newer scanner technologies. Its main message is that SUV and image appearance are highly variable, so standardized protocols, quality control, and harmonized reconstruction are needed for reliable clinical use.
Key findings
- Patient-related factors can materially change SUV in normal tissues: body mass/BMI correlates positively with body-mass–corrected SUV in several organs, and blood glucose can lower absolute [18F]FDG uptake by up to 50% when highly elevated.
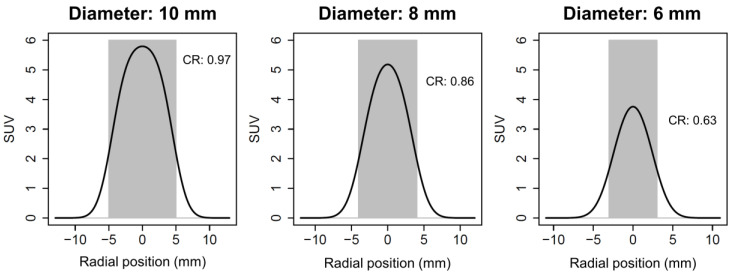
- Partial volume effects become relevant at lesion diameters of about 10 mm; with a 4 mm FWHM PSF, reported recovery of maximum activity is 97% at 10 mm, 86% at 8 mm, and 63% at 6 mm.
- PET/CT and PET/MRI can differ systematically: MR-based attenuation correction can cause SUV errors, with reported underestimation in bone tissue or lesions close to bone of >10% versus PET/CT, and phantom sphere SUV differences of 10–20%.
- Newer hardware/reconstruction can improve performance but also shift quantification: SiPM scanners and TOF/PSF/penalized-likelihood reconstruction generally improve sensitivity, SNR, lesion contrast, and detection; PSF reconstruction can increase lesion SUVmax, SUVmean, and SUVpeak by up to 30% on average.
- Even with improved quantification, routine clinical SUV thresholds remain hard to generalize because SUV test-retest variability in the same patient can be up to 20%, and the paper states that it has not been possible to prove that quantitative measures provide additional value over visual assessment alone for routine diagnostics.
Methods
- Narrative review of factors influencing PET quantification and interpretation, with special attention to [18F]FDG and recent PET technology.
- Synthesizes prior studies on patient physiology/preparation, acquisition parameters, attenuation correction, reconstruction methods, image quality, lesion detection, and reader variability.
- No original dataset or primary statistical analysis is reported in the paper itself.
Limitations
- The paper itself states that the clinical added value of quantitative uptake parameters is “still not well-defined,” and that robust, widely adoptable SUV thresholds are limited by variability and lack of harmonization.
- It also notes that many comparisons across scanners or reconstruction methods are hard to generalize because studies often differ in axial FOV, uptake time, reconstruction settings, or scan order.
- Evident from the text: this is a review, so its conclusions depend on the quality and heterogeneity of the cited literature rather than a single controlled study.
Model-written summary. Check it against the paper before relying on it.
Integrity signals
Registry
Cites
Statistics
Figures




Verification
Claims the paper makes
98 Valid · 5 Not valid · 16 Not checked · 46 Own results and interpretations
Some cited sources support this claim and some don’t — read each source’s verdict below.
In the paper
“Several studies on subjective image quality in whole-body [18F]FDG-PET with PL reconstruction found that image quality was highest at beta values of 450 (to 600) despite lower lesion CR or “image sharpness” at these beta values compared to lower values [41,108,112,175,179].”
§ Influences on PET Quantification and Interpretation > 3. Factors Affecting PET Interpretation > 3.3. Relationship between Objective and Subjective Image Quality
What the sources say
- Partly supportedcites [41] Rogasch, 2020, Reconstructed spatial resolution and contrast recovery with Bayesian penalized likelihood reconstruction (Q.Clear) for FDG-PET compared to time-of-flight (TOF) with point spread function (PSF), EJNMMI Phys. sourceExperimental — accuracy not yet measured
Split into 2 atoms — 0 confirmed, 2 partially supported, 0 disputed, 0 misattributed, 0 unverifiable. Expand the claim to see per-atom verdicts.
- Disputedcites [108] Sundin, 2018, Evaluation of Penalized-Likelihood Estimation Reconstruction on a Digital Time-of-Flight PET/CT Scanner for 18F-FDG Whole-Body Examinations, J. Nucl. Med. sourceExperimental — accuracy not yet measured
Split into 2 atoms — 0 confirmed, 1 partially supported, 1 disputed, 0 misattributed, 0 unverifiable. Expand the claim to see per-atom verdicts.
Checked by a reasoning model — may be wrong.
- Partly supportedcites [112] Messerli, 2018, Impact of a Bayesian penalized likelihood reconstruction algorithm on image quality in novel digital PET/CT: Clinical implications for the assessment of lung tumors, EJNMMI Phys. sourceExperimental — accuracy not yet measured
Split into 2 atoms — 1 confirmed, 1 partially supported, 0 disputed, 0 misattributed, 0 unverifiable. Expand the claim to see per-atom verdicts.
- Partly supportedcites [175] Oddstig, 2019, Impact of penalizing factor in a block-sequential regularized expectation maximization reconstruction algorithm for 18F-fluorocholine PET-CT regarding image quality and interpretation, EJNMMI Phys. sourceExperimental — accuracy not yet measured
Split into 2 atoms — 0 confirmed, 2 partially supported, 0 disputed, 0 misattributed, 0 unverifiable. Expand the claim to see per-atom verdicts.
- Disputedcites [179] 2018, Phantom, clinical, and texture indices evaluation and optimization of a penalized-likelihood image reconstruction method (Q.Clear) on a BGO PET/CT scanner, Med. Phys. sourceExperimental — accuracy not yet measured
Split into 2 atoms — 0 confirmed, 1 partially supported, 1 disputed, 0 misattributed, 0 unverifiable. Expand the claim to see per-atom verdicts.
Checked by a reasoning model — may be wrong.
plainstates an association- Asserted: passes — The authors put it forward as true.
- Checkable: passes — It can be checked against evidence.
- Load-bearing: passes — The paper’s conclusions depend on it.
- Based: passes — The paper gives a reason why it holds.
- Partly supported
The cited sources support only part of this claim — read each source’s verdict below.
In the paper
“The patient’s physiology and constitution influence the biodistribution of radiopharmaceuticals, especially of [18F]FDG, although they mainly affect standardized uptake values (SUV) in normal organs, such as the liver, brain, lung, skeletal muscles, and blood pool [1].”
§ Influences on PET Quantification and Interpretation > 2. Factors Affecting PET Quantification > 2.1. Patient
What the sources say
- Partly supportedcites [1] Eskian, 2019, Effect of blood glucose level on standardized uptake value (SUV) in 18F- FDG PET-scan: A systematic review and meta-analysis of 20,807 individual SUV measurements, Eur. J. Nucl. Med. Mol. Imaging sourceExperimental — accuracy not yet measured
The Clinical points and conclusions section (page unavailable) reports that fasting hyperglycemia changes [18F]FDG uptake in the brain, muscle, liver, and mediastinal blood pool. The paper addresses blood glucose specifically, not patient physiology and constitution broadly or radiopharmaceuticals generally; its lung measurements concern lung tumors, not normal lung. (LLM, conf=0.88)
plainstates a cause- Asserted: passes — The authors put it forward as true.
- Checkable: passes — It can be checked against evidence.
- Load-bearing: unclear — It is unclear whether the paper’s conclusions depend on it.
- Based: passes — The paper gives a reason why it holds.
- Partly supported
The cited sources support only part of this claim — read each source’s verdict below.
In the paper
“Normal brain [18F]FDG uptake varies with age, sex, and the presence or absence of diabetes mellitus [1,6,9,10].”
§ Influences on PET Quantification and Interpretation > 2. Factors Affecting PET Quantification > 2.1. Patient
What the sources say
- Partly supportedcites [1] Eskian, 2019, Effect of blood glucose level on standardized uptake value (SUV) in 18F- FDG PET-scan: A systematic review and meta-analysis of 20,807 individual SUV measurements, Eur. J. Nucl. Med. Mol. Imaging sourceExperimental — accuracy not yet measured
Table 4 (Clinical points and conclusions; page not provided) reports associations of brain SUVmax with age (p < 0.0001) and diabetes diagnosis (p = 0.04). It does not support the sex component: sex was not significantly associated with brain SUVmax (p = 0.245) or SUVmean (p = 0.892). The age and diabetes associations also did not extend to brain SUVmean in this analysis. (LLM, conf=0.87)
- Not checked — no full text of the sourcecites [6] Brade, 2013, Impact of blood glucose, diabetes, insulin, and obesity on standardized uptake values in tumors and healthy organs on 18F-FDG PET/CT, Nucl. Med. Biol. source
- Partly supportedcites [9] Yoshizawa, 2014, Characterizing the normative profile of 18F-FDG PET brain imaging: Sex difference, aging effect, and cognitive reserve, Psychiatry Res. sourceExperimental — accuracy not yet measured
The abstract (p. 1) reports sex differences and age-related changes in cerebral glucose metabolism measured with 18F-FDG PET. But §2.1 (p. 2) says diabetes mellitus was an exclusion criterion, so this study does not establish variation by the presence or absence of diabetes. (LLM, conf=0.93)
- Partly supportedcites [10] Turpin, 2018, Modeling the Effects of Age and Sex on Normal Pediatric Brain Metabolism Using 18F-FDG PET/CT, J. Nucl. Med. sourceExperimental — accuracy not yet measured
The Discussion reports that normal pediatric regional brain metabolism changes with age and that sex differences are present, though their effect is limited. The paper does not report whether brain FDG uptake differs by diabetes status; its Imaging section says only that blood glucose was checked before injection. (LLM, conf=0.89)
plainstates an association- Asserted: passes — The authors put it forward as true.
- Checkable: passes — It can be checked against evidence.
- Load-bearing: unclear — It is unclear whether the paper’s conclusions depend on it.
- Based: passes — The paper gives a reason why it holds.
- Partly supported
The cited sources support only part of this claim — read each source’s verdict below.
In the paper
“Conversely, raising blood glucose and/or insulin levels increases [18F]FDG uptake in the liver, skeletal muscles, and myocardium mainly via GLUT2 and 4 [1,6,22].”
§ Influences on PET Quantification and Interpretation > 2. Factors Affecting PET Quantification > 2.2. Patient Preparation
What the sources say
- Partly supportedcites [1] Eskian, 2019, Effect of blood glucose level on standardized uptake value (SUV) in 18F- FDG PET-scan: A systematic review and meta-analysis of 20,807 individual SUV measurements, Eur. J. Nucl. Med. Mol. Imaging sourceExperimental — accuracy not yet measured
The Liver section reports higher liver FDG uptake with higher blood glucose and identifies GLUT2 as a prominent hepatic transporter. The Muscle and Clinical points and conclusions sections report the opposite of the claimed glucose effect in patients still hyperglycemic after at least four hours of fasting: muscle FDG uptake was lower. The paper discusses insulin-sensitive GLUT4 and allows that uptake might rise in acute hyperglycemia, but does not establish the claimed increase across all three tissues; the retrieved passages do not address myocardial uptake. Page numbers were unavailable in our copy. (LLM, conf=0.88)
- Not checked — no full text of the sourcecites [6] Brade, 2013, Impact of blood glucose, diabetes, insulin, and obesity on standardized uptake values in tumors and healthy organs on 18F-FDG PET/CT, Nucl. Med. Biol. source
- Not checked — no full text of the sourcecites [22] Namba, 1994, A simple method for measuring glucose utilization of insulin-sensitive tissues by using the brain as a reference, Eur. J. Nucl. Med. source
plainstates a cause- Asserted: passes — The authors put it forward as true.
- Checkable: passes — It can be checked against evidence.
- Load-bearing: passes — The paper’s conclusions depend on it.
- Based: passes — The paper gives a reason why it holds.
- Partly supported
The cited sources support only part of this claim — read each source’s verdict below.
In the paper
“If, for example, a SiPM system with low relative coverage of <60% and a modest timing resolution of 382 ps [44,45] is compared to a bismuth germanate (BGO) PMT scanner with similar axial FOV length [46], the SiPM system’s sensitivity can be similar or even slightly inferior (20.8 vs. 23.3 cps/kBq) [45].”
§ Influences on PET Quantification and Interpretation > 2. Factors Affecting PET Quantification > 2.4. Hardware
What the sources say
- Supportedcites [44] Surti, 2020, Update on latest advances in time-of-flight PET, Phys. Med. source
The GE Healthcare subsection reports less than 60% SiPM coverage, 382 ps TOF resolution, and 20.8 cps/kBq sensitivity for the five-ring scanner. Those are the scanner measurements attributed to this source; the citing sentence separately cites [46] for the BGO comparator. (LLM, conf=0.90)
- Partly supportedcites [45] Pan, 2019, Performance evaluation of the 5-Ring GE Discovery MI PET/CT system using the national electrical manufacturers association NU 2-2012 Standard, Med. Phys. sourceExperimental — accuracy not yet measured
The Results (PET performance evaluation; page unavailable) report 20.84 cps/kBq sensitivity and approximately 382 ps timing resolution for the SiPM scanner. The Discussion compares it with a BGO/PMT scanner of similar axial FOV and says the BGO scanner’s sensitivity was slightly higher. The passages do not establish the claimed <60% relative coverage or the BGO scanner’s specific value of 23.3 cps/kBq. (LLM, conf=0.85)
- Partly supportedcites [46] 2017, Performance Characteristics of the Whole-Body Discovery IQ PET/CT System, J. Nucl. Med. sourceExperimental — accuracy not yet measured
The Scanner Characteristics section identifies the Discovery IQ as a BGO scanner with photomultipliers, and Scanner Performance reports sensitivity of 22.80 cps/kBq at the center and 20.43 cps/kBq at 10 cm. This supports the claim’s approximate BGO sensitivity, but our copy does not report 23.3 cps/kBq or compare the scanner with a SiPM system. (LLM, conf=0.85)
plain- Asserted: passes — The authors put it forward as true.
- Checkable: passes — It can be checked against evidence.
- Load-bearing: unclear — It is unclear whether the paper’s conclusions depend on it.
- Based: passes — The paper gives a reason why it holds.
- Supported
91 more claims · 54 with their cited sources checked
Create a free account to see all 165 claims and to verify the 3 references still open.
- It may state two separate claims as one. 53
- Probably not a substantial claim. 18
- The quote only partly states this claim. 2
Citations
Cites
Sokoloff, L., Reivich, M., Kennedy, C., Rosiers, M. H. D., Patlak, C. S., Pettigrew, K. D., Sakurada, O., & Shinohara, M. (1977) · Journal of Neurochemistry · doi:10.1111/j.1471-4159.1977.tb10649.x · Cited by 6,000 · cited 1×
“Lesional uptake of [18F]FDG is more or less irreversible in neoplastic cells [68,69] due to intracellular trapping of the phosphorylated molecule, although reversible uptake has been demonstrated in inflammatory tissue [18].”
BackgroundFrom RECIST to PERCIST: Evolving Considerations for PET Response Criteria in Solid Tumors
Wahl, R. L., Jacene, H., Kasamon, Y., & Lodge, M. A. (2009) · Journal of Nuclear Medicine · doi:10.2967/jnumed.108.057307 · Cited by 3,777
FDG PET/CT: EANM procedure guidelines for tumour imaging: version 2.0
Boellaard, R., Delgado-Bolton, R., Oyen, W. J. G., Giammarile, F., Tatsch, K., Eschner, W., Verzijlbergen, F. J., Barrington, S. F., Pike, L. C., Weber, W. A., et al. (2015) · European Journal of Nuclear Medicine and Molecular Imaging · doi:10.1007/s00259-014-2961-x · Cited by 3,303 · cited 12×
“, the assessment of generalized or focal pathologies in tracer accumulation, while quantitative parameters, including SUV, provide orientation or additional information at most [24].”
BackgroundMethodInfluentialSelf-citationHofman, M. S., Lawrentschuk, N., Francis, R. J., Tang, C., Vela, I., Thomas, P., Rutherford, N., Martin, J. M., Frydenberg, M., Shakher, R., et al. (2020) · The Lancet · doi:10.1016/s0140-6736(20)30314-7 · Cited by 2,040
(1992) · PubMed Central · doi:10.2967/jnumed.120.251744a · Cited by 1,172
Attenuation correction for a combined 3D PET/CT scanner
Kinahan, P. E., Townsend, D. W., Beyer, T., & Sashin, D. (1998) · Medical Physics · doi:10.1118/1.598392 · Cited by 946 · cited 1×
“g, acquired with 120 keV) into linear attenuation correction factors for 511 keV photons [57].”
BackgroundCherry, S. R., Jones, T., Karp, J. S., Qi, J., Moses, W. W., & Badawi, R. D. (2018) · Journal of Nuclear Medicine · doi:10.2967/jnumed.116.184028 · Cited by 763 · cited 15×
“Sekine et al. used a randomized protocol to investigate the potential to reduce injected [18F]FDG activity required (or acquisition time) through the use of an SiPM TOF PET/MRI instead of a PMT TOF PET/CT in 74 patients with different types of malignant tumors.”
BackgroundInfluentialPauleit, D. (2005) · Brain · doi:10.1093/brain/awh399 · Cited by 634
Eiber, M., Herrmann, K., Calais, J., Hadaschik, B., Giesel, F. L., Hartenbach, M., Hope, T., Reiter, R., Maurer, T., Weber, W. A., et al. (2018) · Journal of Nuclear Medicine · doi:10.2967/jnumed.117.198119 · Cited by 626
(2005) · PubMed · Cited by 612
Research works printed but not linked: 1
- Guo, 2020, Quantification Accuracy Using Bayesian Penalized Likelihood Based Reconstruction on 68Ga PET-CT, J. Nucl. Med., 61, 162
Cited by
Li, X., Zhang, L., Yang, J., & Teng, F. (2024) · Journal of Medical and Biological Engineering · doi:10.1007/s40846-024-00863-x · Cited by 133
“AI techniques have been employed to analyze nuclear medicine images, including PET and single-photon emission computed tomography (SPECT), enabling automated lesion detection, quantification, and prediction of patient outcomes [37, 38].”
Heydarheydari, S., Birgani, M. J. T., & Rezaeijo, S. M. (2023) · Polish Journal of Radiology · doi:10.5114/pjr.2023.130815 · Cited by 50
“However, the interpretation of PET images is often subjective and dependent on the operator, which can lead to errors and inconsistencies in the segmentation of tumors [6,7].”
Background[18F]FDG PET/CT: EANM procedure guidelines for tumour imaging: version 3.0
Boellaard, R., Herrmann, K., Barrington, S. F., Cranston, I., Mottaghy, F. M., Hoekstra, C. J., Beyer, T., Pike, L. C., Willemsen, A., Graham, M. M., et al. (2025) · The EANM Journal · doi:10.1016/j.eanmj.2025.100006 · Cited by 61
Self-citationvan Lith, S. A. M., Pruis, I. J., Tolboom, N., et al. (2023) · Journal of Nuclear Medicine · doi:10.2967/jnumed.123.265738 · Cited by 26
Self-citationThe value of artificial intelligence in PSMA PET: a pathway to improved efficiency and results
Dadgar, H., Hong, X., Karimzadeh, R., Ibragimov, B., Majidpour, J., Arabi, H., Al‐Ibraheem, A., Khalaf, A. N., Anwar, F., Marafi, F., et al. (2025) · The Quarterly Journal of Nuclear Medicine and Molecular Imaging · doi:10.23736/s1824-4785.25.03640-4 · Cited by 15
Korsholm, K., Overbeck, N., Dias, A. H., Loft, A., Andersen, F. L., & Fischer, B. M. (2023) · Diagnostics · doi:10.3390/diagnostics13050947 · Cited by 10
Thorwarth, D. (2022) · Zeitschrift für Medizinische Physik · doi:10.1016/j.zemedi.2022.09.001 · Cited by 8
Islam, M. Z., Spiro, E., Yap, P., Gorin, M., & Rowe, S. P. (2025) · Medical Review · doi:10.1515/mr-2024-0086 · Cited by 7
IRMA: Machine learning-based harmonization of $$^{18}$$F-FDG PET brain scans in multi-center studies
Lövdal, S., van Veen, R., Carli, G., Renken, R. J., Shiner, T., Bregman, N., Orad, R. I., Arnaldi, D., Orso, B., Morbelli, S. D., et al. (2025) · European Journal of Nuclear Medicine and Molecular Imaging · doi:10.1007/s00259-025-07114-4 · Cited by 9
Whole-body magnetic resonance imaging for cutaneous melanoma staging: A scientific review
Russo, A., Marinelli, L., Patanè, V., Alessandrella, M., Pezzella, M., Troiani, T., Brancaccio, G., Scharf, C., Argenziano, G., Cappabianca, S., et al. (2025) · World Journal of Clinical Oncology · doi:10.5306/wjco.v16.i8.109206 · Cited by 8
Dong, Y., Wang, P., Geng, H., Liu, Y., & Wang, E. (2025) · Journal of X-Ray Science and Technology · doi:10.1177/08953996241304988 · Cited by 7
Kendrick, J., Francis, R. J., Hassan, G. M., Rowshanfarzad, P., Ong, J. S. L., Barry, N., Rusanov, B., & Ebert, M. A. (2023) · Scientific Reports · doi:10.1038/s41598-023-45106-2 · Cited by 8
“It’s worth noting also that due to the limited spatial resolution of PET imaging, partial volume effects can affect biomarker quantitation accuracy 36 .”
BackgroundBarry, N., Kendrick, J., Rowshanfarzad, P., Hassan, G. M., Francis, R. J., Bucknell, N. W., Koh, E., Scott, A. M., Ebert, M. A., Gutsche, R., et al. (2025) · Journal of Nuclear Medicine · doi:10.2967/jnumed.124.268925 · Cited by 5
Maes, J., Carron, C., DeKeyser, S., Brants, T., Ridder, V. D., Chaouki, A., Steenhout, C., Vandenberghe, S., D’Asseler, Y., Raes, L., et al. (2025) · European Journal of Nuclear Medicine and Molecular Imaging · doi:10.1007/s00259-025-07672-7 · Cited by 6
“…image quality criteria can be subdivided into subjective assessments, such as those provided by certified readers, and objective quantitative measures, which, for example, evaluate SUV quantification in enhanced scans or in phantom datasets where a theoretical ground truth is available [23, 24].”
Boanova, L. G., Altmayer, S., Watte, G., Raupp, A. A., Francisco, M. Z., Oliveira, G. S. D., Hochhegger, B., & Andrade, R. G. F. (2023) · Cancers · doi:10.3390/cancers15225403 · Cited by 6
Editorial on Special Issue “Quantitative PET and SPECT”
van Velden, F. V., & de Geus-Oei, L. D. (2022) · Diagnostics · doi:10.3390/diagnostics12081989 · Cited by 2
“The quantitative accuracy and interpretation of PET images are influenced by many factors, which are summarized in the review of Rogasch and colleagues, emphasizing the need to implement quality control and standardized imaging protocols [2].”
BackgroundKapsoritakis, N., Tsitoura, F., Stathaki, M. I., Bourogianni, O., Georgoulias, P., Barmparis, G. D., Bertsias, A., Tsironis, G. P., & Koukouraki, S. I. (2025) · Cancers · doi:10.3390/cancers17203353 · Cited by 5
“SUVmean is now less commonly used for treatment response assessment in routine practice [43].”
Shanmugiah, J., & Kim, J. S. (2026) · Nuclear Medicine and Molecular Imaging · doi:10.1007/s13139-026-00988-8 · Cited by 8
“This phenomenon systematically under-estimates radioactivity concentrations in small structures, especially when lesion diameters are less than two to three times the system’s FWHM [62].”
Dondi, F., Bellini, P., Cossandi, M., Camoni, L., Rinaldi, R., Viganò, G. L., & Bertagna, F. (2025) · Diagnostics · doi:10.3390/diagnostics15131626 · Cited by 4
“Additionally, when focusing on the semiquantitative evaluation of PLC, a high variability of SUV and SUV ratio values between different papers has been reported, a fact that, as mentioned, may be related to the different scanners used [80].”
Influence of Covariates on 18F-FDG PET/CT Diagnostic Accuracy for Liver Metastasis
Habouzit, V., Flaus, A., Phelip, J., Grange, S., Roy, B. L., Grange, R., & Prévôt, N. (2024) · Diagnostics · doi:10.3390/diagnostics14141466 · Cited by 3
“As a metabolic imaging technique, its diagnostic accuracy may be influenced not only by technical parameters and lesion size but also by patient-related factors [7].”
BackgroundGavriilidis, P., Mottaghy, F. M., Koole, M. J. B., van de Weijer, T., Mitea, C., van der Pol, J. A. J., van Nijnatten, T. J. A., Jansen, F. P., & Wierts, R. (2025) · European Journal of Nuclear Medicine and Molecular Imaging · doi:10.1007/s00259-024-07061-6 · Cited by 5
Currie, G. M., & Bailey, D. L. (2026) · Seminars in Nuclear Medicine · doi:10.1053/j.semnuclmed.2026.02.002 · Cited by 3
Functional pituitary adenoma imaging
Hesse, L. M., & Haberbosch, L. (2026) · Reviews in Endocrine and Metabolic Disorders · doi:10.1007/s11154-026-10063-4 · Cited by 3
Neuber, C., Niedenzu, L., Schulze, S., et al. (2025) · International Journal of Molecular Sciences · doi:10.3390/ijms26062582 · Cited by 2
“Cellular activity in the bone defect area was investigated by PET/CT imaging after i.v. injection of [ 18 F]FDG. [ 18 F]FDG accumulation in tissues is mainly dependent on cellular glucose uptake by glucose transporters (GLUT) 1 and 3 [31].”
Self-citationLi, L., Cui, F., Tian, R., Jiang, M., Zou, L., Li, X., & Su, M. (2025) · Annals of Hematology · doi:10.1007/s00277-025-06420-z · Cited by 2
The Role of PET Image Quantification in Modern Radiation Therapy
Abdelrahman, A., & Naqa, I. E. (2025) · PET Clinics · doi:10.1016/j.cpet.2025.07.008 · Cited by 1
Nakajo, M., Hirahara, D., Hirahara, M., Eizuru, Y., Tani, A., Kanzaki, F., Takumi, K., Kamimura, K., & Yoshiura, T. (2025) · Clinical Radiology · doi:10.1016/j.crad.2025.107187 · Cited by 2
Radiotracers for imaging of schizophrenia
Mohammadgholi, M., & Hosseinimehr, S. J. (2026) · Bioorganic Chemistry · doi:10.1016/j.bioorg.2026.109532 · Cited by 1
Khattar, N., Matuskey, D., Gallezot, J., Naganawa, M., Holmes, S. E., Sadabad, F. E., Mayeli, M., Esterlis, I., van Dyck, C. H., Mecca, A. P., et al. (2026) · Journal of Cerebral Blood Flow & Metabolism · doi:10.1177/0271678x261441071 · Cited by 3
Positronenemissionstomographie in der Onkologie
Czerner, C. P., Derlin, T., Bengel, F. M., & Weiberg, D. (2023) · Die Radiologie · doi:10.1007/s00117-023-01174-z · Cited by 1
“Als Maß für die Aktivitätsverteilung hat sich der standardisierte Uptake-Wert („standardized uptake value“ [SUV]) etabliert [3].”
BackgroundUeda, T., Yamashita, K., Kawazoe, R., Sayawaki, Y., Morisawa, Y., Kamezaki, R., Ikeda, R., Shiraishi, S., Uchiyama, Y., & Ito, S. (2024) · PubMed Central · doi:10.22038/aojnmb.2024.74875.1522 · Cited by 3
“…parameters of positron emission tomography (PET) include the random coincidence coefficient, scattering coincidence coefficient, γ-ray attenuation, spatial resolution, correspondence between PET and computed tomography (CT) images, and correction of radioactivity based on PET values (4).”
MethodJiménez-Ortega, E., Agüera, R., Ureba, A., Balcerzyk, M., Wals-Zurita, A., Gómez, F. J. G., & Leal, A. (2022) · Tomography · doi:10.3390/tomography8020090 · Cited by 1
“Beyond visual evaluation, the definition of the therapeutic target and the prescription dose based on parameters such as the standardized uptake value (SUV) require numerical values and standardization of imaging procedures [2,13].”
MethodKhattar, N., Matuskey, D., Gallezot, J., Naganawa, M., Holmes, S. E., Sadabad, F. E., Mayeli, M., Esterlis, I., van Dyck, C. H., Mecca, A. P., et al. (2025) · bioRxiv (Cold Spring Harbor Laboratory) · doi:10.1101/2025.10.15.682460 · Cited by 1
Emialyanenko, E. V., & Paddubny, K. V. (2022) · Sakharov Readings: Environmental Problems of the XXI Century · doi:10.46646/sakh-2022-2-268-271
Positronenemissionstomographie in der Onkologie
Czerner, C. P., Derlin, T., Bengel, F. M., & Weiberg, D. (2022) · Die Onkologie · doi:10.1007/s00761-022-01262-0
“Als Maß für die Aktivitätsverteilung hat sich der standardisierte Uptake-Wert („standardized uptake value“ [SUV]) etabliert [3].”
BackgroundPET imaging of atherosclerosis: artificial intelligence applications and recent advancements
Rizwan, S., Ayubcha, C., Al‐Daoud, O., Al-Atout, M., Amiruddin, R., Werner, T. J., & Alavi, A. A. (2025) · Nuclear Medicine Communications · doi:10.1097/mnm.0000000000001973
“Notably, these factors can exert differential influences on radiotracer distribution, especially in the context of studies involving [18F]FDG [69].”
Rubini, D., Nardone, V., Altini, C., Battisti, C., Ferrari, C., Reginelli, A., Gagliardi, F., Rubini, G., & Cappabianca, S. (2025) · Life · doi:10.3390/life15091392 · Cited by 1
“Interpretation of 18F-FDG PET/CT images in routine clinical practice primarily relies on visual criteria, while quantitative parameters provide complementary information [14].”
InfluentialTam, T., Naing, T. K. P., Elzubeir, L., Swords, F., Dhatariya, K., Barbara, R., & Ahluwalia, R. (2025) · Clinical Endocrinology · doi:10.1111/cen.70060
van Elferen, I., Vaz, S. C., Nelemans, P. J., Wierts, R., van de Weijer, T., Smidt, M. L., Mottaghy, F. M., & van Nijnatten, T. J. A. (2025) · Nuclear Medicine Communications · doi:10.1097/mnm.0000000000002091
van Leeuwen, G. L., Schuurmann, R. C. L., Tsoumpas, C., et al. (2026) · Frontiers in Nuclear Medicine · doi:10.3389/fnume.2025.1672054
Radiomics and Artificial Intelligence for personalized treatment of HPV-induced cancers
Niyoteka, S. (2023) · theses.fr (ABES) · doi:10.70675/307e872ezea33z470az8362z2fa498f30500
C-DCA: Cold-Diffusion Based Domain Adaptation for Pediatric Fast-Scan Pet Denoising
Yang, J., Hu, J., He, X., Hu, Z., Zhang, Y., & Hu, Y. (2026) · IEEE International Conference on Acoustics Speech and Signal Processing · doi:10.1109/icassp55912.2026.11464764
Fedrigo, R., Harsini, S., Murtha, L., Vasconcelos, J. P. S., Uribe, C., Wilson, D. C., Bénard, F., Alberts, I., Martineau, P., & Loree, J. M. (2026) · Neuroendocrinology · doi:10.1159/000552968
Lan, W., Vrakidis, K. D., Bharkhada, D., Linder, P. M., Yaqub, M. M., la Fougère, C., Boellaard, R., & Schmidt, F. P. (2026) · medRxiv · doi:10.64898/2026.07.30.26358859
Self-citationSources of Variability in Normative Cerebral [ 18 F]FDG-PET imagingPreprint
de Souza, G. S., Povala, G., Peixoto, G. G. S., Coutinho, A. M., Bieger, A., Aranha, M. R., Bastiani, M. A. D., Zimmer, E. R., Borelli, W. V., & Souza, L. W. (2026) · bioRxiv (Cold Spring Harbor Laboratory) · doi:10.64898/2026.07.30.741623
“These effects, driven by scanner manufacturers, hardware generations, and reconstruction algorithms, may directly influence quantitative SUVr measurements and hinder the development of robust normative frameworks [4,8 – 11].”
Lee, N., Yoon, H., & Yoo, I. R. (2026) · Diagnostics · doi:10.3390/diagnostics16182910
“Second, SUVmax is not a transferable number: it varies with scanner model, reconstruction algorithm, iteration and subset settings, use of point-spread-function modeling and time-of-flight, uptake time, blood glucose level, and multiple patient-and acquisition-related factors [16,18,20].”
Benetti, E. D., Preckel, T., Linhananta, A., Baldassi, B., Komarov, B., Poladyan, H., Freitas, V., Reznik, A., & Bubon, O. (2026) · Frontiers in Oncology · doi:10.3389/fonc.2026.1880803
18F-FDG PET/CT in Oncology Biologic, Technical, and Quantitative Foundations for Interpretation
Hasani, N., Mohseny, A., Patel, D., Sitek, A., Ghesani, M., & Farhadi, F. (2026) · Radiologic Clinics of North America · doi:10.1016/j.rcl.2026.07.006
Peeters, E., van Genugten, E. A. J., Stormezand, G. N., Schmiedehausen, K., Margolin, K. A., Postow, M. A., Heskamp, S., Herpen, C. M. L., Westdorp, H., & Aarntzen, E. H. J. G. (2026) · Research Square · doi:10.21203/rs.3.rs-10831511/v1
Sourcing good data: from image acquisition to segmentation
Borgheresi, A., Mariotti, F., & Agostini, A. (2025) · Elsevier eBooks · doi:10.1016/b978-0-443-29242-2.00007-0
Metadata
- Authors
- Rogasch, J. M. M., Hofheinz, F., van Heek, L., Voltin, C.-A., Boellaard, R., & Kobe, C.
- Affiliations
- Humboldt-Universität zu Berlin (DE)
- Helmholtz-Zentrum Dresden-Rossendorf (DE)
- University of Cologne (DE)
- Amsterdam University Medical Centers (NL)
- Corresponding author
- Kobe, Carsten
- Venue
- Diagnostics
- Publisher
- MDPI AG
- Published
- 2022-02-10
- Volume
- 12
- Issue
- 2
- Pages
- 451
- ISSN
- 2075-4418 (ISSN-L)
- PMC
- PMC8871060
- OpenAlex
- W4211063369
- Cited by
- 57
- References
- 239
- Citations by year
- 2026: 17 · 2025: 21 · 2024: 4 · 2023: 10 · 2022: 5
- FWCI
- 1.66
- Type
- journal article
- Language
- en
- Open access
- gold
- doi.org
- Licence
- Locations
- Diagnostics (publishedVersion, cc-by)
- PubMed Central (publishedVersion, cc-by)
- PubMed (publishedVersion)
- Kölner Universitäts PublikationsServer (Universität zu Köln) (publishedVersion)
- Pure Amsterdam UMC (publishedVersion, cc-by)
- Amsterdam UMC (VU Amsterdam) - Institutional Repository (publishedVersion, other-oa)
- DOAJ (DOAJ: Directory of Open Access Journals) (submittedVersion, cc-by-sa)
- Data Archiving and Networked Services (DANS) (submittedVersion, other-oa)
- Funders
- Deutsche Forschungsgemeinschaft
- Berlin Institute of Health
- Topics
- Health Sciences › Medicine › Radiology, Nuclear Medicine and Imaging › Medical Imaging Techniques and Applications
- Health Sciences › Medicine › Radiology, Nuclear Medicine and Imaging › Cardiac Imaging and Diagnostics
- Health Sciences › Medicine › Radiology, Nuclear Medicine and Imaging › Advanced MRI Techniques and Applications
- Keywords
- positron emission tomography, quantitative accuracy, image interpretation, PET quantification
About these checks
Registry, retraction, Cites and statistics results are computed, not judged, with one exception: a printed reference that no index lists is read once by a model before it counts as a citation error. Claims are extracted by a model and kept only when their quote appears verbatim in the text; each cited source is then checked, with a model’s help, for whether it says what the claim relies on. Those verdicts can be wrong — read the claim’s quote and the cited source before relying on one.
The claim verdicts this report counts are experimental: their accuracy is not yet measured.
A language model drew the claims from the paper on 2026-10-10, under version 3 of the claim definition (model deepseek-v4.1-flash, prompt extract-v3).
A second model labelled each claim on 2026-10-10 (model jev-1.13-20260917, definition revision gold-guideline-v0.2).
Cited sources are checked with a language model’s help (gpt-6-sol).
Statistics and arithmetic are recomputed, not judged.
Confidence bands are shown only for fields calibrated on our annotated test set. None is calibrated yet, so no band is shown.
What counts as a claim ›How we measure confidence ›How we check this ›
Are you an author, or do you see a problem with this page? Request a review
Data sources
Bibliographic data: Semantic Scholar, OpenAlex, Crossref.
Contains information from the Semantic Scholar Academic Graph Datasets, made available under the ODC Attribution License (ODC-BY 1.0).
Semantic Scholar’s data is described in: Kinney, R., et al. (2023). The Semantic Scholar Open Data Platform. arXiv:2301.10140.
