

A Powerful Paradigm for Cardiovascular Risk Stratification Using Multiclass, Multi-Label, and Ensemble-Based Machine Learning Paradigms: A Narrative Review
Open accessThe DOI matches its Crossref record; 262 of the 263 references it cites were found in a registry or an index.
Abstract
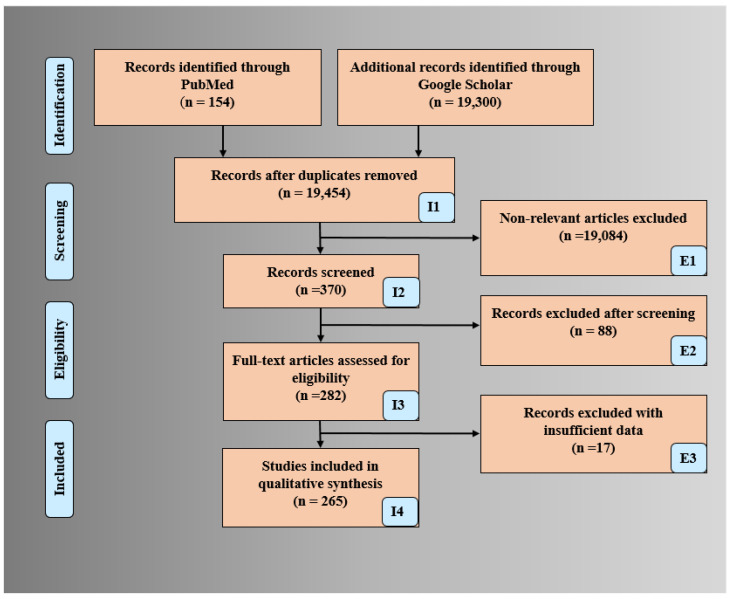
Background and Motivation: Cardiovascular disease (CVD) causes the highest mortality globally. With escalating healthcare costs, early non-invasive CVD risk assessment is vital. Conventional methods have shown poor performance compared to more recent and fast-evolving Artificial Intelligence (AI) methods. The proposed study reviews the three most recent paradigms for CVD risk assessment, namely multiclass, multi-label, and ensemble-based methods in (i) office-based and (ii) stress-test laboratories. Methods: A total of 265 CVD-based studies were selected using the preferred reporting items for systematic reviews and meta-analyses (PRISMA) model. Due to its popularity and recent development, the study analyzed the above three paradigms using machine learning (ML) frameworks. We review comprehensively these three methods using attributes, such as architecture, applications, pro-and-cons, scientific validation, clinical evaluation, and AI risk-of-bias (RoB) in the CVD framework. These ML techniques were then extended under mobile and cloud-based infrastructure. Findings: Most popular biomarkers used were office-based, laboratory-based, image-based phenotypes, and medication usage. Surrogate carotid scanning for coronary artery risk prediction had shown promising results. Ground truth (GT) selection for AI-based training along with scientific and clinical validation is very important for CVD stratification to avoid RoB. It was observed that the most popular classification paradigm is multiclass followed by the ensemble, and multi-label. The use of deep learning techniques in CVD risk stratification is in a very early stage of development. Mobile and cloud-based AI technologies are more likely to be the future. Conclusions: AI-based methods for CVD risk assessment are most promising and successful. Choice of GT is most vital in AI-based models to prevent the RoB. The amalgamation of image-based strategies with conventional risk factors provides the highest stability when using the three CVD paradigms in non-cloud and cloud-based frameworks.
Overview
The claims and statistics of this paper haven’t been checked yet.
Free: it reads the open-access text and checks the first 5 claims that cite a source we can check. Create a free account to check every claim.
Integrity signals
Registry
Cites
Statistics
Figures








Verification
Claims the paper makes
The claims and statistics of this paper haven’t been checked yet.
Free: it reads the open-access text and checks the first 5 claims that cite a source we can check. Create a free account to check every claim.
Claims other papers make about this one
Each is checked against this paper’s own text: does it say what the citing paper says it does?
The source backs part of the claim, not all of it — or backs it for a different population, condition or comparison.
In the citing paper
“The bias ranking is also explored by very limited researchers [144].”
From Artificial intelligence bias in medical system designs: a systematic review (2023) · cites this paper as [144]
Experimental — accuracy not yet measured
Self-check
Percentages, sums and reported differences re-computed from the paper’s own numbers.
The self-check needs the paper’s full text.
Citations
Cites
1 retracted
Pławiak, P., & Acharya, U. R. (2020) · Neural Computing and Applications · doi:10.1007/s00521-018-03980-2 · Cited by 248
RetractedXGBoost: A Scalable Tree Boosting System
Chen, T., & Guestrin, C. (2016) · Proceedings of the 22nd ACM SIGKDD International Conference on Knowledge Discovery and Data Mining · doi:10.1145/2939672.2939785 · Cited by 54,569
SMOTE synthetic minority over-sampling technique
Chawla, N. V., Bowyer, K. W., Hall, L. O., & Kegelmeyer, W. P. (2002) · Journal of Artificial Intelligence Research · doi:10.1613/jair.953 · Cited by 32,865
Yusuf, S., Hawken, S., Ôunpuu, S., Dans, T., Avezum, A., Lanas, F., McQueen, M., Budaj, A., Pais, P., Varigos, J., et al. (2004) · The Lancet · doi:10.1016/s0140-6736(04)17018-9 · Cited by 12,026
General Cardiovascular Risk Profile for Use in Primary Care: The Framingham Heart Study
D’Agostino, R. B., Vasan, R. S., Pencina, M. J., Wolf, P. A., Cobain, M., Massaro, J. M., & Kannel, W. B. (2008) · Circulation · doi:10.1161/circulationaha.107.699579 · Cited by 7,491
2019 ESC Guidelines for the diagnosis and management of chronic coronary syndromes
Knuuti, J., Wijns, W., Saraste, A., Capodanno, D., Barbato, E., Funck-Brentano, C., Prescott, E., Storey, R. F., Deaton, C., Cuisset, T., et al. (2020) · European Heart Journal · doi:10.1093/eurheartj/ehz425 · Cited by 7,166
A Survey on Bias and Fairness in Machine Learning
Mehrabi, N., Morstatter, F., Saxena, N., Lerman, K., & Galstyan, A. (2022) · ACM Computing Surveys · doi:10.1145/3457607 · Cited by 5,812
A Survey on Bias and Fairness in Machine Learning
Mehrabi, N., Morstatter, F., Saxena, N., Lerman, K., & Galstyan, A. (2019) · arXiv · doi:10.48550/arxiv.1908.09635 · Cited by 5,812
Estimation of ten-year risk of fatal cardiovascular disease in Europe: the SCORE project
Conroy, R. (2003) · European Heart Journal · doi:10.1016/s0195-668x(03)00114-3 · Cited by 5,290 · cited 1×
“…multiple conventional tools for assessment of risk due to CVD, namely (i) QRISK3 [21], (ii) Framingham risk score (FRS) [22], (iii) the systematic coronary risk evaluation score (SCORE) [23], (iv) the Reynolds risk score (RRS) [24], and (v) the atherosclerosis cardio-vascular disease (ASCVD) [25].”
Method2013 ACC/AHA Guideline on the Assessment of Cardiovascular Risk
Goff, D. C., Lloyd-Jones, D. M., Bennett, G., Coady, S., D’Agostino, R. B., Gibbons, R., Greenland, P., Lackland, D. T., Levy, D., O’Donnell, C. J., et al. (2014) · Journal of the American College of Cardiology · doi:10.1016/j.jacc.2013.11.005 · Cited by 4,945
2013 ESC guidelines on the management of stable coronary artery disease
Task Force Members, Montalescot, G., Sechtem, U., Achenbach, S., Andreotti, F., Arden, C., Budaj, A., Bugiardini, R., Crea, F., Cuisset, T., et al. (2013) · European Heart Journal · doi:10.1093/eurheartj/eht296 · Cited by 4,510
ML-KNN: A lazy learning approach to multi-label learning
Zhang, M.-L., & Zhou, Z.-H. (2007) · Pattern Recognition · doi:10.1016/j.patcog.2006.12.019 · Cited by 3,552
Heart rate variability: A review
Rajendra Acharya, U., Paul Joseph, K., Kannathal, N., Lim, C. M., & Suri, J. S. (2006) · Medical & Biological Engineering & Computing · doi:10.1007/s11517-006-0119-0 · Cited by 2,820 · cited 1×
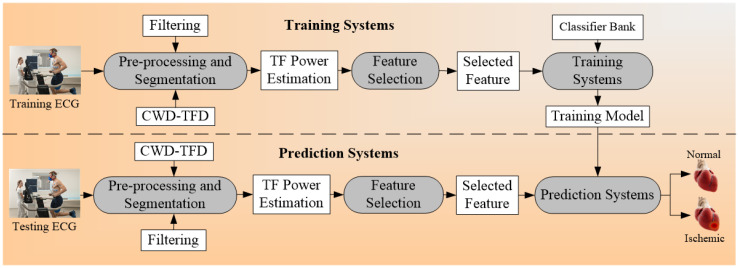
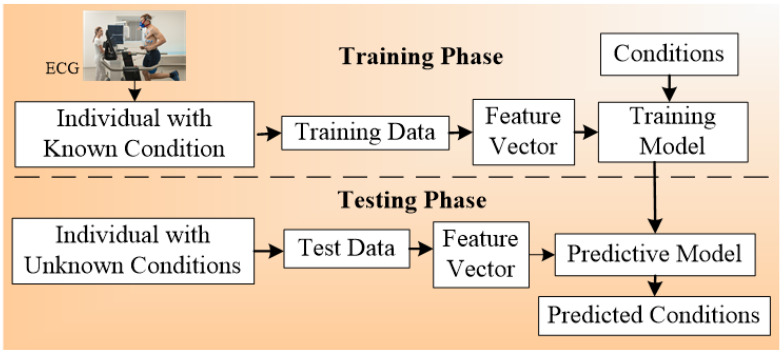
“The calculators used in the office-based scenario are conventional CVD calculators that use laboratory-based biomarkers (LBBM) and office-based biomarkers (OBBM) [17], while the CVD risk assessment in stress test centers uses electrocardiograms (ECG) [18–20].”
MethodSelf-citationGalar, M., Fernandez, A., Barrenechea, E., Bustince, H., & Herrera, F. (2012) · IEEE Transactions on Systems, Man, and Cybernetics, Part C (Applications and Reviews) · doi:10.1109/tsmcc.2011.2161285 · Cited by 2,794
Multi-Label Classification: An Overview
Tsoumakas, G., & Katakis, I. (2007) · International Journal of Data Warehousing and Mining · doi:10.4018/jdwm.2007070101 · Cited by 2,508
Rosengren, A., Hawken, S., Ôunpuu, S., Sliwa, K., Zubaid, M., Almahmeed, W. A., Blackett, K. N., Sitthi-amorn, C., Sato, H., & Yusuf, S. (2004) · The Lancet · doi:10.1016/s0140-6736(04)17019-0 · Cited by 2,414
Learning multi-label scene classification
Boutell, M. R., Luo, J., Shen, X., & Brown, C. M. (2004) · Pattern Recognition · doi:10.1016/j.patcog.2004.03.009 · Cited by 2,296
Classifier chains for multi-label classification
Read, J., Pfahringer, B., Holmes, G., & Frank, E. (2011) · Machine Learning · doi:10.1007/s10994-011-5256-5 · Cited by 2,289
Inflammation in Atherosclerosis
Libby, P., Ridker, P. M., & Hansson, G. K. (2009) · Journal of the American College of Cardiology · doi:10.1016/j.jacc.2009.09.009 · Cited by 2,228
xgboost: Extreme Gradient Boosting
Chen, T., He, T., Benesty, M., Khotilovich, V., Tang, Y., Cho, H., Chen, K., Mitchell, R., Cano, I., Zhou, T., et al. (2014) · CRAN: Contributed Packages · doi:10.32614/cran.package.xgboost · Cited by 2,025
(2010) · doi:10.5555/1756006.1859921 · Cited by 1,924
Ridker, P. M., Buring, J. E., Rifai, N., & Cook, N. R. (2007) · JAMA · doi:10.1001/jama.297.6.611 · Cited by 1,814
Mannheim Carotid Intima-Media Thickness and Plaque Consensus (2004–2006–2011)
Touboul, P.-J., Hennerici, M. G., Meairs, S., Adams, H., Amarenco, P., Bornstein, N., Csiba, L., Desvarieux, M., Ebrahim, S., Hernandez Hernandez, R., et al. (2012) · Cerebrovascular Diseases · doi:10.1159/000343145 · Cited by 1,801
Hippisley-Cox, J., Coupland, C., & Brindle, P. (2017) · BMJ · doi:10.1136/bmj.j2099 · Cited by 1,703
Tabas, I., Williams, K. J., & Borén, J. (2007) · Circulation · doi:10.1161/circulationaha.106.676890 · Cited by 1,399
Anderson, T. J., Grégoire, J., Pearson, G. J., Barry, A. R., Couture, P., Dawes, M., Francis, G. A., Genest, J., Grover, S., Gupta, M., et al. (2016) · Canadian Journal of Cardiology · doi:10.1016/j.cjca.2016.07.510 · Cited by 1,173
Kaptoge, S., Pennells, L., De Bacquer, D., Cooney, M. T., Kavousi, M., Stevens, G., Riley, L. M., Savin, S., Khan, T., Altay, S., et al. (2019) · The Lancet Global Health · doi:10.1016/s2214-109x(19)30318-3 · Cited by 1,167
DANN: a deep learning approach for annotating the pathogenicity of genetic variants
Quang, D., Chen, Y., & Xie, X. (2015) · Bioinformatics · doi:10.1093/bioinformatics/btu703 · Cited by 1,064
Cell Biology of Atherosclerosis
Ross, R. (1995) · Annual Review of Physiology · doi:10.1146/annurev.ph.57.030195.004043 · Cited by 1,003
Using recurrent neural network models for early detection of heart failure onset
Choi, E., Schuetz, A., Stewart, W. F., & Sun, J. (2017) · Journal of the American Medical Informatics Association · doi:10.1093/jamia/ocw112 · Cited by 928
Random k-Labelsets: An Ensemble Method for Multilabel Classification
Tsoumakas, G., & Vlahavas, I. (2007) · Lecture Notes in Computer Science · doi:10.1007/978-3-540-74958-5_38 · Cited by 871
Inflammation and plaque vulnerability
Hansson, G. K., Libby, P., & Tabas, I. (2015) · Journal of Internal Medicine · doi:10.1111/joim.12406 · Cited by 805
Anderson, T. J., Grégoire, J., Hegele, R. A., Couture, P., Mancini, G. B. J., McPherson, R., Francis, G. A., Poirier, P., Lau, D. C., Grover, S., et al. (2013) · Canadian Journal of Cardiology · doi:10.1016/j.cjca.2012.11.032 · Cited by 770
Epidemiology of Sudden Cardiac Death: Clinical and Research Implications
Chugh, S. S., Reinier, K., Teodorescu, C., Evanado, A., Kehr, E., Al Samara, M., Mariani, R., Gunson, K., & Jui, J. (2008) · Progress in Cardiovascular Diseases · doi:10.1016/j.pcad.2008.06.003 · Cited by 729
Cardiovascular Risk Prediction: Basic Concepts, Current Status, and Future Directions
Lloyd-Jones, D. M. (2010) · Circulation · doi:10.1161/circulationaha.109.849166 · Cited by 705 · cited 1×
“The CVD risk estimation at an early stage is very much important to reduce the mortality rate due to CVD [252,253].”
BackgroundMotwani, M., Dey, D., Berman, D. S., Germano, G., Achenbach, S., Al-Mallah, M. H., Andreini, D., Budoff, M. J., Cademartiri, F., Callister, T. Q., et al. (2016) · European Heart Journal · doi:10.1093/eurheartj/ehw188 · Cited by 692
Carotid Intima-Media Thickness and Plaque in Cardiovascular Risk Assessment
Naqvi, T. Z., & Lee, M.-S. (2014) · JACC: Cardiovascular Imaging · doi:10.1016/j.jcmg.2013.11.014 · Cited by 649
Cardiovascular Event Prediction by Machine Learning: The Multi-Ethnic Study of Atherosclerosis
Ambale-Venkatesh, B., Yang, X., Wu, C. O., Liu, K., Hundley, W. G., McClelland, R., Gomes, A. S., Folsom, A. R., Shea, S., Guallar, E., et al. (2017) · Circulation Research · doi:10.1161/circresaha.117.311312 · Cited by 639 · cited 8×
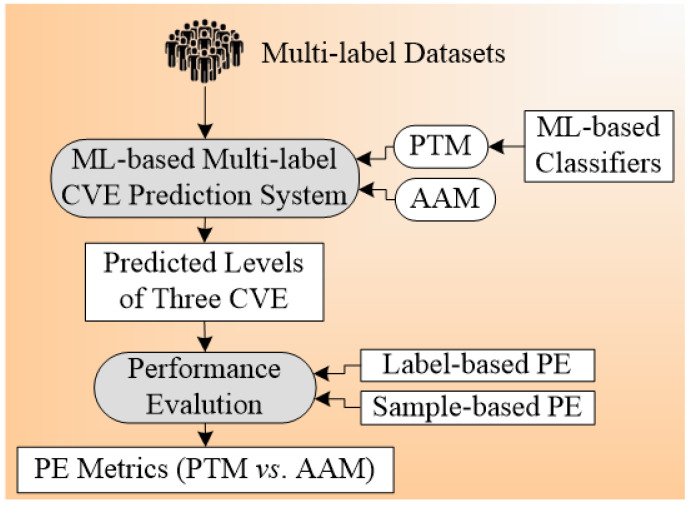
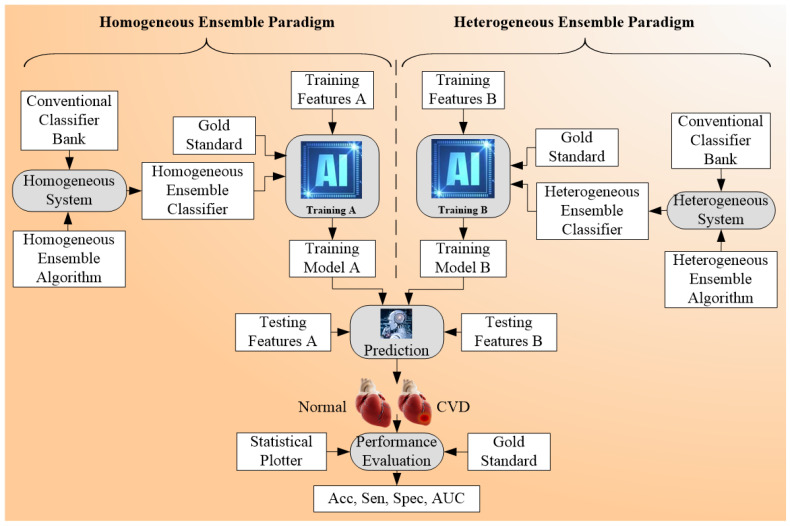
“[83 – 90], and ensemble (59”
BackgroundMethodInfluentialAutomated diagnosis of epileptic EEG using entropies
Acharya, U. R., Molinari, F., Sree, S. V., Chattopadhyay, S., Ng, K.-H., & Suri, J. S. (2012) · Biomedical Signal Processing and Control · doi:10.1016/j.bspc.2011.07.007 · Cited by 626
Self-citationAlaa, A. M., Bolton, T., Di Angelantonio, E., Rudd, J. H. F., & van der Schaar, M. (2019) · PLOS ONE · doi:10.1371/journal.pone.0213653 · Cited by 604
Ghosh, P., Azam, S., Jonkman, M., Karim, A., Shamrat, F. M. J. M., Ignatious, E., Shultana, S., Beeravolu, A. R., & De Boer, F. (2021) · IEEE Access · doi:10.1109/access.2021.3053759 · Cited by 581
Goldstein, B. A., Navar, A. M., & Carter, R. E. (2016) · European Heart Journal · doi:10.1093/eurheartj/ehw302 · Cited by 543
A Tutorial on Multilabel Learning
Gibaja, E., & Ventura, S. (2015) · ACM Computing Surveys · doi:10.1145/2716262 · Cited by 527
Morphological predictors of arterial remodeling in coronary atherosclerosis
Burke, A. P., Kolodgie, F. D., Farb, A., Weber, D., & Virmani, R. (2002) · Circulation · doi:10.1161/hc0302.102610 · Cited by 525 · cited 2×
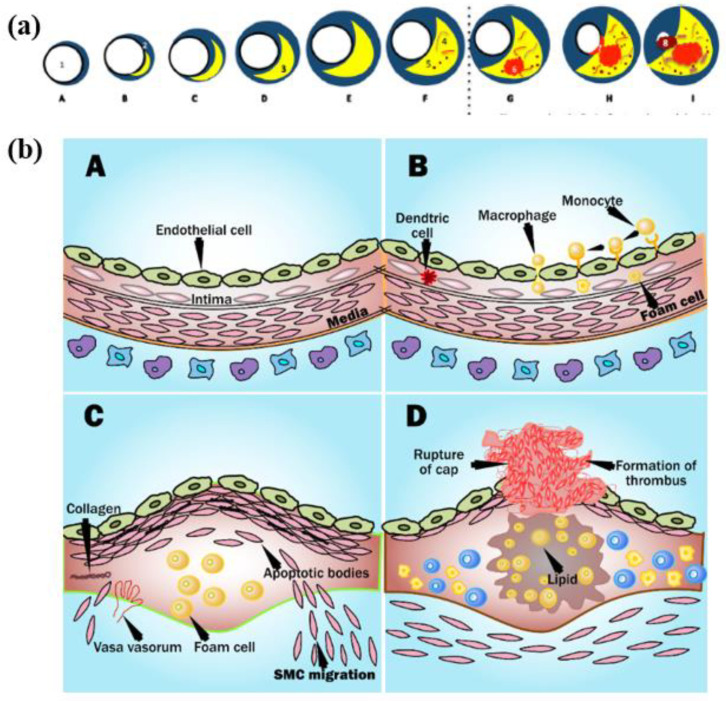
“…do remodeling by themselves [130]. by a fibrous cap The blood remains uninterrupted when the plaque is small as the arteries do remodeling However, when the plaques increase, the lipid-core volume decreases leading to structural stabilization of plaque (Figure 3a) [131]. by themselves [130].”
BackgroundPrimary prevention of cardiovascular disease: A review of contemporary guidance and literature
Stewart, J., Manmathan, G., & Wilkinson, P. (2017) · JRSM Cardiovascular Disease · doi:10.1177/2048004016687211 · Cited by 464
Oresko, J. J., Jin, Z., Cheng, J., Huang, S., Sun, Y., Duschl, H., & Cheng, A. C. (2010) · IEEE Transactions on Information Technology in Biomedicine · doi:10.1109/titb.2010.2047865 · Cited by 446
Cen, L.-P., Ji, J., Lin, J.-W., Ju, S.-T., Lin, H.-J., Li, T.-P., Wang, Y., Yang, J.-F., Liu, Y.-F., Tan, S., et al. (2021) · Nature Communications · doi:10.1038/s41467-021-25138-w · Cited by 346
A new machine learning technique for an accurate diagnosis of coronary artery disease
Abdar, M., Książek, W., Acharya, U. R., Tan, R.-S., Makarenkov, V., & Pławiak, P. (2019) · Computer Methods and Programs in Biomedicine · doi:10.1016/j.cmpb.2019.104992 · Cited by 342
Advances in Cardiac Signal Processing
(2007) · Springer eBooks · doi:10.1007/978-3-540-36675-1 · Cited by 336
Self-citationPathology of the Thin‐Cap Fibroatheroma: A Type of Vulnerable Plaque
VIRMANI, R., BURKE, A. P., KOLODGIE, F. D., & FARB, A. (2003) · Journal of Interventional Cardiology · doi:10.1034/j.1600-0854.2003.8042.x · Cited by 330
ACHARYA, U. R., SREE, S. V., ANG, P. C. A., YANTI, R., & SURI, J. S. (2012) · International Journal of Neural Systems · doi:10.1142/s0129065712500025 · Cited by 320
Self-citationDunbar, S. B., Khavjou, O. A., Bakas, T., Hunt, G., Kirch, R. A., Leib, A. R., Morrison, R. S., Poehler, D. C., Roger, V. L., & Whitsel, L. P. (2018) · Circulation · doi:10.1161/cir.0000000000000570 · Cited by 319
Automatic ECG Classification Using Continuous Wavelet Transform and Convolutional Neural Network
Wang, T., Lu, C., Sun, Y., Yang, M., Liu, C., & Ou, C. (2021) · Entropy · doi:10.3390/e23010119 · Cited by 308
A deep CNN based multi-class classification of Alzheimer's disease using MRI
Farooq, A., Anwar, S., Awais, M., & Rehman, S. (2017) · 2017 IEEE International Conference on Imaging Systems and Techniques (IST) · doi:10.1109/ist.2017.8261460 · Cited by 303
An improved ensemble learning approach for the prediction of heart disease risk
Mienye, I. D., Sun, Y., & Wang, Z. (2020) · Informatics in Medicine Unlocked · doi:10.1016/j.imu.2020.100402 · Cited by 288
Cuadrado-Godia, E., Dwivedi, P., Sharma, S., Ois Santiago, A., Roquer Gonzalez, J., Balcells, M., Laird, J., Turk, M., Suri, H. S., Nicolaides, A., et al. (2018) · Journal of Stroke · doi:10.5853/jos.2017.02922 · Cited by 286
Self-citationTandel, G. S., Balestrieri, A., Jujaray, T., Khanna, N. N., Saba, L., & Suri, J. S. (2020) · Computers in Biology and Medicine · doi:10.1016/j.compbiomed.2020.103804 · Cited by 255
Self-citationYe, C., Fu, T., Hao, S., Zhang, Y., Wang, O., Jin, B., Xia, M., Liu, M., Zhou, X., Wu, Q., et al. (2018) · Journal of Medical Internet Research · doi:10.2196/jmir.9268 · Cited by 250 · cited 4×
“…GBM, GBDT, LR, BPNN, DT [98,99,104,109], GB [99], Adaboost ensemble [100], ANN [101,104], GNB, LDA, LR, QDA, AdaBoost [105,113,118], XGBoost [102,118 ensemble SVM [104], CART [106], bagging, VS, LASSO, boosting, Bassian, MARS, logistic [107], ensemble boosting [80], ensemble learning, deep…”
InfluentialRim, T. H., Lee, C. J., Tham, Y.-C., Cheung, N., Yu, M., Lee, G., Kim, Y., Ting, D. S. W., Chong, C. C. Y., Choi, Y. S., et al. (2021) · The Lancet Digital Health · doi:10.1016/s2589-7500(21)00043-1 · Cited by 234
Machine Learning Outperforms ACC/AHA CVD Risk Calculator in MESA
Kakadiaris, I. A., Vrigkas, M., Yen, A. A., Kuznetsova, T., Budoff, M., & Naghavi, M. (2018) · Journal of the American Heart Association · doi:10.1161/jaha.118.009476 · Cited by 227 · cited 2×
“Recently, Kakadiaris et al. [62] perused this strategy using the machine learning paradigm.”
BackgroundMethodCardiovascular Manifestations of COVID-19 Infection
Magadum, A., & Kishore, R. (2020) · Cells · doi:10.3390/cells9112508 · Cited by 226
Giri, D., Rajendra Acharya, U., Martis, R. J., Vinitha Sree, S., Lim, T.-C., Ahamed, T., & Suri, J. S. (2013) · Knowledge-Based Systems · doi:10.1016/j.knosys.2012.08.011 · Cited by 221
Self-citationA Comparison of Multi-label Feature Selection Methods using the Problem Transformation Approach
Spolaôr, N., Cherman, E. A., Monard, M. C., & Lee, H. D. (2013) · Electronic Notes in Theoretical Computer Science · doi:10.1016/j.entcs.2013.02.010 · Cited by 219
Rajendra Acharya, U., Vinitha Sree, S., Alvin, A. P. C., & Suri, J. S. (2012) · Expert Systems with Applications · doi:10.1016/j.eswa.2012.02.040 · Cited by 211
Self-citationPrediction of Heart Disease Using Machine Learning Algorithms
Nikhar, S., & Karandikar, A. (2016) · International Journal of Advanced engineering Management and Science · Cited by 203
Deep Multi-Scale Fusion Neural Network for Multi-Class Arrhythmia Detection
Wang, R., Fan, J., & Li, Y. (2020) · IEEE Journal of Biomedical and Health Informatics · doi:10.1109/jbhi.2020.2981526 · Cited by 201
Multi-label Classifier Performance Evaluation with Confusion Matrix
Krstinić, D., Braović, M., Šerić, L., & Božić-Štulić, D. (2020) · Computer Science & Information Technology · doi:10.5121/csit.2020.100801 · Cited by 200
Naing, N. N. (2003) · Europe PMC (PubMed Central) · Cited by 197
Mechanisms of plaque rupture mechanical and biologic interactions
Arroyo, L. (1999) · Cardiovascular Research · doi:10.1016/s0008-6363(98)00308-3 · Cited by 192
State-of-the-art review on deep learning in medical imaging
Suri, J. S. (2019) · Frontiers in Bioscience · doi:10.2741/4725 · Cited by 186
Self-citationHeart Disease Risk Prediction Using Machine Learning Classifiers with Attribute Evaluators
Reddy, K. V. V., Elamvazuthi, I., Aziz, A. B. A., Paramasivam, S., Chua, H. N., & Pranavanand, S. (2021) · Applied Sciences · doi:10.3390/app11188352 · Cited by 182
Multi-Label Active Learning-Based Machine Learning Model for Heart Disease Prediction
El-Hasnony, I. M., Elzeki, O. M., Alshehri, A., & Salem, H. (2022) · Sensors · doi:10.3390/s22031184 · Cited by 171
Dissanayake, K., & Johar, M. G. M. (2021) · Applied Computational Intelligence and Soft Computing · doi:10.1155/2021/5581806 · Cited by 170
Hedman, Å. K., Hage, C., Sharma, A. K., Brosnan, M. J., Buckbinder, L., Gan, L., Shah, S. J., Linde, C. M., Donal, E., Daubert, J., et al. (2020) · Heart · doi:10.1136/heartjnl-2019-315481 · Cited by 160
Self-citationExcess deaths in people with cardiovascular diseases during the COVID-19 pandemic
Banerjee, A., Chen, S., Pasea, L., Lai, A. G., Katsoulis, M., Denaxas, S., Nafilyan, V., Williams, B., Wong, W. K., Bakhai, A., et al. (2021) · European Journal of Preventive Cardiology · doi:10.1093/eurjpc/zwaa155 · Cited by 160
Improving the Accuracy for Analyzing Heart Diseases Prediction Based on the Ensemble Method
Gao, X.-Y., Amin Ali, A., Shaban Hassan, H., & Anwar, E. M. (2021) · Complexity · doi:10.1155/2021/6663455 · Cited by 159
Ding, C., Chen, P., & Jiao, J. (2018) · Accident Analysis & Prevention · doi:10.1016/j.aap.2017.12.026 · Cited by 157
Recent Advances in Breast Imaging, Mammography, and Computer-Aided Diagnosis of Breast Cancer
(2006) · SPIE eBooks · doi:10.1117/3.651880 · Cited by 155
Lui, H. W., & Chow, K. L. (2018) · Informatics in Medicine Unlocked · doi:10.1016/j.imu.2018.08.002 · Cited by 152
Soltan, A. A. S., Kouchaki, S., Zhu, T., Kiyasseh, D., Taylor, T., Hussain, Z. B., Peto, T., Brent, A. J., Eyre, D. W., & Clifton, D. A. (2021) · The Lancet Digital Health · doi:10.1016/s2589-7500(20)30274-0 · Cited by 150
Diagnosing Coronary Heart Disease using Ensemble Machine Learning
Kathleen, H., Julia, H., & George, J. (2016) · International Journal of Advanced Computer Science and Applications · doi:10.14569/ijacsa.2016.071004 · Cited by 147
Bos, J. M., Attia, Z. I., Albert, D. E., Noseworthy, P. A., Friedman, P. A., & Ackerman, M. J. (2021) · JAMA Cardiology · doi:10.1001/jamacardio.2020.7422 · Cited by 142
Kuppili, V., Biswas, M., Sreekumar, A., Suri, H. S., Saba, L., Edla, D. R., Marinho, R. T., Sanches, J., & Suri, J. S. (2017) · Journal of Medical Systems · doi:10.1007/s10916-017-0797-1 · Cited by 138
Self-citationChao, H., Shan, H., Homayounieh, F., Singh, R., Khera, R. D., Guo, H., Su, T., Wang, G., Kalra, M. K., & Yan, P. (2021) · Nature Communications · doi:10.1038/s41467-021-23235-4 · Cited by 137
Self-citationRelation between age and carotid artery intima‐medial thickness: a systematic review
van den Munckhof, I., Jones, H., Hopman, M. T. E., Graaf, J. D., Nyakayiru, J., van Dijk, B., Eijsvogels, T. M. H., & Thijssen, D. H. J. (2018) · Clinical Cardiology · doi:10.1002/clc.22934 · Cited by 133
Collins, D. R. J., Tompson, A., Onakpoya, I., Roberts, N. W., Ward, A. M., & Heneghan, C. J. (2017) · BMJ Open · doi:10.1136/bmjopen-2016-013650 · Cited by 132
Mercan, C., Aksoy, S., Mercan, E., Shapiro, L. G., Weaver, D. L., & Elmore, J. G. (2018) · IEEE Transactions on Medical Imaging · doi:10.1109/tmi.2017.2758580 · Cited by 132
Ensemble Deep Learning Models for Heart Disease Classification: A Case Study from Mexico
Baccouche, A., Garcia-Zapirain, B., Castillo Olea, C., & Elmaghraby, A. (2020) · Information · doi:10.3390/info11040207 · Cited by 129
Automatic diagnosis of multiple cardiac diseases from PCG signals using convolutional neural network
Baghel, N., Dutta, M. K., & Bürget, R. (2020) · Computer Methods and Programs in Biomedicine · doi:10.1016/j.cmpb.2020.105750 · Cited by 128
Speckle reduction in medical ultrasound images using an unbiased non-local means method
Sudeep, P. V., Palanisamy, P., Rajan, J., Baradaran, H., Saba, L., Gupta, A. K., & Suri, J. S. (2016) · Biomedical Signal Processing and Control · doi:10.1016/j.bspc.2016.03.001 · Cited by 124
Self-citationML-FOREST: A Multi-Label Tree Ensemble Method for Multi-Label Classification
Wu, Q., Tan, M., Song, H., Chen, J., & Ng, M. K. (2016) · IEEE Transactions on Knowledge and Data Engineering · doi:10.1109/tkde.2016.2581161 · Cited by 118
Multi-label Problem Transformation Methods: a Case Study
Cherman, E. A., Monard, M. C., & Metz, J. (2011) · CLEI electronic journal · doi:10.19153/cleiej.14.1.4 · Cited by 117
Inflammatory biomarkers of coronary heart disease
Zhao, R. (2016) · Frontiers in bioscience · doi:10.2741/4498 · Cited by 117
Velusamy, D., & Ramasamy, K. (2020) · Computer Methods and Programs in Biomedicine · doi:10.1016/j.cmpb.2020.105770 · Cited by 117
Sherazi, S. W. A., Bae, J., & Lee, J. Y. (2021) · PLoS ONE · doi:10.1371/journal.pone.0249338 · Cited by 115
Acharya, U. R., Joseph, K. P., Kannathal, N., Min, L. C., & Suri, J. S. (2007) · Springer eBooks · doi:10.1007/978-3-540-36675-1_5 · Cited by 113
Self-citationTeng, Z., Zhang, Y., Huang, Y., Feng, J., Yuan, J., Lu, Q., Sutcliffe, M. P. F., Brown, A. J., Jing, Z., & Gillard, J. H. (2014) · Acta Biomaterialia · doi:10.1016/j.actbio.2014.09.001 · Cited by 112
Bütün, E., Yıldırım, Ö., Talo, M., Tan, R., & Acharya, U. R. (2020) · Physica Medica · doi:10.1016/j.ejmp.2020.01.007 · Cited by 110
A hybrid cost-sensitive ensemble for heart disease prediction
Qi, Z., & Zhang, Z. (2021) · BMC Medical Informatics and Decision Making · doi:10.1186/s12911-021-01436-7 · Cited by 108
Special Issue on Ensemble Learning and Applications
Pintelas, P., & Livieris, I. E. (2020) · Algorithms · doi:10.3390/a13060140 · Cited by 106
A Novel Ensemble Learning Paradigm for Medical Diagnosis With Imbalanced Data
Liu, N., Xiao-mei, L., Qi, E., Xu, M., Li, L., & Gao, B. (2020) · IEEE Access · doi:10.1109/access.2020.3014362 · Cited by 106
Shrivastava, V. K., Londhe, N. D., Sonawane, R. S., & Suri, J. S. (2015) · Expert Systems with Applications · doi:10.1016/j.eswa.2015.03.014 · Cited by 104
Self-citationMachine Learning Adds to Clinical and CAC Assessments in Predicting 10-Year CHD and CVD Deaths
Nakanishi, R., Slomka, P. J., Rios, R., Betancur, J., Blaha, M. J., Nasir, K., Miedema, M. D., Rumberger, J. A., Gransar, H., Shaw, L. J., et al. (2021) · JACC: Cardiovascular Imaging · doi:10.1016/j.jcmg.2020.08.024 · Cited by 102
Prediction of heart disease using ensemble learning and Particle Swarm Optimization
Yekkala, I., Dixit, S., & Jabbar, M. A. (2017) · International Conference On Smart Technologies For Smart Nation (SmartTechCon) · doi:10.1109/smarttechcon.2017.8358460 · Cited by 100
Araki, T., Ikeda, N., Shukla, D., Jain, P. K., Londhe, N. D., Shrivastava, V. K., Banchhor, S. K., Saba, L., Nicolaides, A. N., Shafique, S., et al. (2016) · Computer Methods and Programs in Biomedicine · doi:10.1016/j.cmpb.2016.02.004 · Cited by 98
Self-citationStochastic Modeling for Medical Image Analysis
El-Baz, A., Gimel’farb, G., & Suri, J. S. (2015) · CRC Press eBooks · doi:10.1201/b19253 · Cited by 98
Self-citationOlier, I., Ortega‐Martorell, S., Pieroni, M., & Lip, G. Y. H. (2021) · Cardiovascular Research · doi:10.1093/cvr/cvab169 · Cited by 94
Boi, A., Jamthikar, A. D., Saba, L., Gupta, D., Sharma, A., Loi, B., Laird, J. R., Khanna, N. N., & Suri, J. S. (2018) · Current Atherosclerosis Reports · doi:10.1007/s11883-018-0736-8 · Cited by 92
Self-citationDeyama, J., Nakamura, T., Takishima, I., Fujioka, D., Kawabata, K., Obata, J., Watanabe, K., Watanabe, Y., Saitō, Y., Mishina, H., et al. (2013) · Circulation Journal · doi:10.1253/circj.cj-12-1529 · Cited by 87
Jamthikar, A. D., Gupta, D., Mantella, L. E., Saba, L., Laird, J. R., Johri, A. M., & Suri, J. S. (2020) · International journal of cardiac imaging · doi:10.1007/s10554-020-02099-7 · Cited by 87
Self-citationStein, J. H., Korcarz, C. E., & Post, W. S. (2009) · Preventive Cardiology · doi:10.1111/j.1751-7141.2008.00021.x · Cited by 86
Cardiovascular disease detection using a new ensemble classifier
Esfahani, H. A., & Ghazanfari, M. (2017) · 2017 IEEE 4th International Conference on Knowledge-Based Engineering and Innovation (KBEI) · doi:10.1109/kbei.2017.8324946 · Cited by 86
Ribeiro, A. L. P., Paixão, G. M. M., Gomes, P. R., Ribeiro, M. H., Ribeiro, A. H., Canazart, J. A., Oliveira, D. M., Ferreira, M. P., Lima, E. M., Moraes, J. L. D., et al. (2019) · Journal of Electrocardiology · doi:10.1016/j.jelectrocard.2019.09.008 · Cited by 84
HARAM: A Hierarchical ARAM Neural Network for Large-Scale Text Classification
Benites, F., & Sapozhnikova, E. P. (2015) · IEEE ... International Conference on Data Mining workshops · doi:10.1109/icdmw.2015.14 · Cited by 83
Zarkogianni, K., Athanasiou, M., Thanopoulou, A. C., & Nikita, K. S. (2018) · IEEE Journal of Biomedical and Health Informatics · doi:10.1109/jbhi.2017.2765639 · Cited by 83
Mitchell, C., Korcarz, C. E., Gepner, A. D., Kaufman, J. D., Post, W. S., Tracy, R. P., Gassett, A. J., Ma, N., McClelland, R. L., & Stein, J. H. (2018) · Atherosclerosis · doi:10.1016/j.atherosclerosis.2018.06.005 · Cited by 82
New Concepts in Sudden Cardiac Arrest to Address an Intractable Epidemic
Narayan, S. M., Wang, P. J., & Daubert, J. P. (2019) · Journal of the American College of Cardiology · doi:10.1016/j.jacc.2018.09.083 · Cited by 82
Uddin, M. N., & Halder, R. K. (2021) · Informatics in Medicine Unlocked · doi:10.1016/j.imu.2021.100584 · Cited by 82
Chao, H., Shan, H., Homayounieh, F., Singh, R., Khera, R. D., Guo, H., Su, T., Wang, G., Kalra, M. K., & Yan, P. (2021) · RePEc: Research Papers in Economics · Cited by 81
Self-citationCardiovascular disease risk prediction models: challenges and perspectives
Farzadfar, F. (2019) · The Lancet Global Health · doi:10.1016/s2214-109x(19)30365-1 · Cited by 80
Jan, M. J., Awan, A. A., Khalid, M. S., & Nisar, S. (2018) · Research Reports in Clinical Cardiology · doi:10.2147/rrcc.s172035 · Cited by 78
A Review on Dimensionality Reduction for Multi-label Classification
Siblini, W., Kuntz, P., & Meyer, F. (2019) · IEEE Transactions on Knowledge and Data Engineering · doi:10.1109/tkde.2019.2940014 · Cited by 78
Review of imaging biomarkers for the vulnerable carotid plaque
Saba, L., Agarwal, N., Cau, R., Gerosa, C., Sanfilippo, R., Porcu, M., Montisci, R., Cerrone, G., Yang, Q., Balestrieri, A., et al. (2021) · JVS Vascular Science · doi:10.1016/j.jvssci.2021.03.001 · Cited by 77
Self-citationOn the Determination of Sample Size
Umbach, D. M. (2003) · Epidemiology · doi:10.1097/01.ede.0000044327.46102.64 · Cited by 75
Saba, L., Jain, P. K., Suri, H. S., Ikeda, N., Araki, T., Singh, B. K., Nicolaides, A. N., Shafique, S., Gupta, A. K., Laird, J. R., et al. (2017) · Journal of Medical Systems · doi:10.1007/s10916-017-0745-0 · Cited by 75
Self-citationMachine learning improves risk stratification after acute coronary syndrome
Myers, P. D., Scirica, B. M., & Stultz, C. M. (2017) · Scientific Reports · doi:10.1038/s41598-017-12951-x · Cited by 75
Gibson, W. J., Nafee, T., Travis, R. S., Yee, M., Kernéis, M., Ohman, M. E., & Gibson, C. M. (2019) · Journal of Thrombosis and Thrombolysis · doi:10.1007/s11239-019-01940-8 · Cited by 74
Acharya, U., Mookiah, M., Vinitha Sree, S., Yanti, R., Martis, R., Saba, L., Molinari, F., Guerriero, S., & Suri, J. (2012) · Ultraschall in der Medizin - European Journal of Ultrasound · doi:10.1055/s-0032-1330336 · Cited by 73
Self-citationLongato, E., Fadini, G. P., Sparacino, G., Avogaro, A., Tramontan, L., & Camillo, B. D. (2021) · IEEE Journal of Biomedical and Health Informatics · doi:10.1109/jbhi.2021.3065756 · Cited by 73
DeepMI: Deep multi-lead ECG fusion for identifying myocardial infarction and its occurrence-time
Tadesse, G. A., Javed, H. A., Weldemariam, K., Liu, Y., Liu, J., Chen, J., & Zhu, T. (2021) · Artificial Intelligence in Medicine · doi:10.1016/j.artmed.2021.102192 · Cited by 73
Ultrasound Imaging: Advances and Applications
(2012) · Springer eBooks · doi:10.1007/978-1-4614-1180-2 · Cited by 72
Johri, A. M., Behl, P., Hétu, M., Haqqi, M., Ewart, P., Day, A. G., Parfrey, B., & Matangi, M. F. (2015) · Echocardiography · doi:10.1111/echo.13007 · Cited by 71
Self-citationDamman, P., Hof, A. W. J. V. ’., ten Berg, J. M., Jukema, J. W., Appelman, Y., Liem, A. H., & de Winter, R. J. (2016) · Netherlands Heart Journal · doi:10.1007/s12471-016-0939-y · Cited by 71
State-of-the-Art Medical Image Registration Methodologies: A Survey
Khalifa, F., Beache, G. M., Gimel’farb, G., Suri, J. S., & El-Baz, A. S. (2011) · Springer eBooks · doi:10.1007/978-1-4419-8195-0_9 · Cited by 70
Self-citationEnhanced Evolutionary Feature Selection and Ensemble Method for Cardiovascular Disease Prediction
Prakash, J., V, & Karthikeyan, N. (2021) · Interdisciplinary Sciences Computational Life Sciences · doi:10.1007/s12539-021-00430-x · Cited by 70
Detection of coronary artery disease by reduced features and extreme learning machine
Singh, R. S., Saini, B. S., & Sunkaria, R. K. (2018) · Medicine and Pharmacy Reports · doi:10.15386/cjmed-882 · Cited by 69
Robust multi-label transfer feature learning for early diagnosis of Alzheimer’s disease
Initiative, A. D. N., Cheng, B., Liu, M., Zhang, D., & Shen, D. (2019) · Brain Imaging and Behavior · doi:10.1007/s11682-018-9846-8 · Cited by 69
Jain, P. K., Sharma, N., Saba, L., Paraskevas, K. I., Kalra, M. K., Johri, A. M., Laird, J. R., Nicolaides, A. N., & Suri, J. S. (2021) · Diagnostics · doi:10.3390/diagnostics11122257 · Cited by 69
Self-citationDisease prediction via Bayesian hyperparameter optimization and ensemble learning
Gao, L., & Ding, Y. (2020) · BMC Research Notes · doi:10.1186/s13104-020-05050-0 · Cited by 67
Current status of carotid ultrasound in atherosclerosis
Ho, S. S. Y. (2016) · Quantitative Imaging in Medicine and Surgery · doi:10.21037/qims.2016.05.03 · Cited by 65
Suri, J. S., Agarwal, S., Gupta, S., Puvvula, A., Viskovic, K., Suri, N., Alizad, A., El-Baz, A., Saba, L., Fatemi, M., et al. (2021) · IEEE Journal of Biomedical and Health Informatics · doi:10.1109/jbhi.2021.3103839 · Cited by 65
Self-citationMachine Learning Improves Cardiovascular Risk Definition for Young, Asymptomatic Individuals
Sánchez-Cabo, F., Rossello, X., Fuster, V., Benito, F., Manzano, J. P., Silla, J. C., Fernández-Alvira, J. M., Oliva, B., Fernández-Friera, L., López-Melgar, B., et al. (2020) · Journal of the American College of Cardiology · doi:10.1016/j.jacc.2020.08.017 · Cited by 63
Detection and classification of arrhythmia using an explainable deep learning model
Jo, Y., Kwon, J., Jeon, K., Cho, Y.-H., Shin, J. H., Lee, Y.-J., Jung, M., Ban, J., Kim, K., Lee, S. Y., et al. (2021) · Journal of Electrocardiology · doi:10.1016/j.jelectrocard.2021.06.006 · Cited by 63
Development of Health Parameter Model for Risk Prediction of CVD Using SVM
Unnikrishnan, P., Kumar, D. K., Poosapadi Arjunan, S., Kumar, H., Mitchell, P., & Kawasaki, R. (2016) · Computational and Mathematical Methods in Medicine · doi:10.1155/2016/3016245 · Cited by 62
Deep Learning Algorithm Classifies Heartbeat Events Based on Electrocardiogram Signals
Liang, Y., Yin, S., Tang, Q., Zheng, Z., Elgendi, M., & Chen, Z. (2020) · Frontiers in Physiology · doi:10.3389/fphys.2020.569050 · Cited by 62
Jain, P. K., Sharma, N., Saba, L., Paraskevas, K. I., Kalra, M. K., Johri, A. M., Nicolaides, A. N., & Suri, J. S. (2021) · International Angiology · doi:10.23736/s0392-9590.21.04771-4 · Cited by 62
Self-citationJamthikar, A. D., Gupta, D., Saba, L., Khanna, N. N., Viskovic, K., Mavrogeni, S., Laird, J. R., Sattar, N., Johri, A. M., Pareek, G., et al. (2020) · Computers in Biology and Medicine · doi:10.1016/j.compbiomed.2020.104043 · Cited by 61
Self-citationHinai, G. A., Jammoul, S., Vajihi, Z., & Afilalo, J. (2021) · European Heart Journal - Digital Health · doi:10.1093/ehjdh/ztab048 · Cited by 60
Huang, W., Ying, T. W., Chin, W. L. C., Baskaran, L., Marcus, O. E. H., Yeo, K. K., & Kiong, N. S. (2022) · Scientific Reports · doi:10.1038/s41598-021-04649-y · Cited by 60
Multi-Label ECG Signal Classification Based on Ensemble Classifier
Sun, Z., Wang, C., Zhao, Y., & Yan, C. (2020) · IEEE Access · doi:10.1109/access.2020.3004908 · Cited by 59
Jamthikar, A. D., Gupta, D., Puvvula, A., Johri, A. M., Khanna, N. N., Saba, L., Mavrogeni, S. I., Laird, J. R., Pareek, G., Miner, M. M., et al. (2020) · Rheumatology International · doi:10.1007/s00296-020-04691-5 · Cited by 58
Self-citationDetection of Cardiovascular Disease using Machine Learning Classification Models
Alalawi, H. H., & Alsuwat, M. S. (2021) · Zenodo (CERN European Organization for Nuclear Research) · doi:10.5281/zenodo.18591351 · Cited by 57
Konstantonis, G. D., Singh, K. V., Sfikakis, P. P., Jamthikar, A. D., Kitas, G. D., Gupta, S. K., Saba, L., Verrou, K., Khanna, N. N., Ruzsa, Z., et al. (2022) · Rheumatology International · doi:10.1007/s00296-021-05062-4 · Cited by 57
Self-citationKhanna, N. N., Jamthikar, A. D., Araki, T., Gupta, D., Piga, M., Saba, L., Carcassi, C., Nicolaides, A. N., Laird, J. R., Suri, H. S., et al. (2019) · Echocardiography · doi:10.1111/echo.14242 · Cited by 56
Self-citationTan, C., Chen, H., & Xia, C. (2008) · Biological Trace Element Research · doi:10.1007/s12011-008-8279-4 · Cited by 55
Jeong, B., Cho, H., Kim, J., Kwon, S. K., Hong, S., Lee, C., 이창식, Park, M. S., Hong, S., & Heo, T. (2020) · Diagnostics · doi:10.3390/diagnostics10060415 · Cited by 54
Rezaei-Ravari, M., Eftekhari, M., & Saberi-Movahed, F. (2020) · Engineering Applications of Artificial Intelligence · doi:10.1016/j.engappai.2020.104062 · Cited by 54
Wang, H., Liu, X., Lv, B., Yang, F., & Hong, Y. (2014) · PLoS ONE · doi:10.1371/journal.pone.0099565 · Cited by 53
Patel, A. K., Suri, H. S., Singh, J., Kumar, D., Shafique, S., Nicolaides, A. N., Jain, S. K., Saba, L., Gupta, A. K., Laird, J. R., et al. (2016) · Current Atherosclerosis Reports · doi:10.1007/s11883-016-0635-9 · Cited by 50
Self-citationCarotid Intraplaque-Hemorrhage Volume and Its Association with Cerebrovascular Events
Saba, L., Micheletti, G., Brinjikji, W., Garofalo, P., Montisci, R., Balestrieri, A., Suri, J. S., DeMarco, J. K., Lanzino, G. S., & Sanfilippo, R. (2019) · American Journal of Neuroradiology · doi:10.3174/ajnr.a6189 · Cited by 50
Self-citationZamzmi, G., Hsu, L., Li, W., Sachdev, V., & Antani, S. (2020) · IEEE Reviews in Biomedical Engineering · doi:10.1109/rbme.2020.2988295 · Cited by 49
Risk Stratification of Sudden Cardiac Death in Patients with Heart Failure: An update
Masarone, D., Limongelli, G., Ammendola, E., Verrengia, M., Gravino, R., & Pacileo, G. (2018) · Journal of Clinical Medicine · doi:10.3390/jcm7110436 · Cited by 48
Castelyn, G., Laranjo, L., Schreier, G., & Gallego, B. (2021) · International Journal of Medical Informatics · doi:10.1016/j.ijmedinf.2021.104620 · Cited by 48
Saba, L., Banchhor, S. K., Araki, T., Višković, K., Londhe, N. D., Laird, J. R., Suri, H. S., & Suri, J. S. (2018) · Indian Heart Journal · doi:10.1016/j.ihj.2018.01.024 · Cited by 47
Self-citationBanchhor, S. K., Londhe, N. D., Araki, T., Saba, L., Radeva, P., Khanna, N. N., & Suri, J. S. (2018) · Computers in Biology and Medicine · doi:10.1016/j.compbiomed.2018.08.017 · Cited by 47
Self-citationAngelaki, E., Marketou, M. E., Barmparis, G. D., Patrianakos, A. P., Vardas, P. E., PARTHENAKIS, F. I., & Tsironis, G. P. (2021) · Journal of Clinical Hypertension · doi:10.1111/jch.14200 · Cited by 47
Explainable machine-learning predictions for complications after pediatric congenital heart surgery
Zeng, X., Hu, Y., Shu, L., Li, J., Duan, H., Shu, Q., & Li, H. (2021) · Scientific Reports · doi:10.1038/s41598-021-96721-w · Cited by 47
Intelligence System for Diagnosis Level of Coronary Heart Disease with K-Star Algorithm
Wiharto, W., Kusnanto, H., & Herianto, H. (2016) · Healthcare Informatics Research · doi:10.4258/hir.2016.22.1.30 · Cited by 46
Symmetrical Compression Distance for Arrhythmia Discrimination in Cloud-Based Big-Data Services
Lillo-Castellano, J. M., Mora-Jiménez, I., Mozos, R. S., Chavarría-Asso, F., Cano-Gonzalez, A., García-Alberola, A., & Rojo‐Álvarez, J. L. (2015) · IEEE Journal of Biomedical and Health Informatics · doi:10.1109/jbhi.2015.2412175 · Cited by 45
Cardiovascular disease diagnosis using cross-domain transfer learning
Tadesse, G. A., Zhu, T., Liu, Y., Zhou, Y., Chen, J., Tian, M., & Clifton, D. A. (2019) · Annual International Conference of the IEEE Engineering in Medicine and Biology Society (EMBC) · doi:10.1109/embc.2019.8857737 · Cited by 45
Cuadrado‐Godia, E., Jamthikar, A. D., Gupta, D., Khanna, N. N., Araki, T., Maniruzzaman, M., Saba, L., Nicolaides, A. N., Sharma, A., Omerzu, T., et al. (2019) · Computers in Biology and Medicine · doi:10.1016/j.compbiomed.2019.03.020 · Cited by 43
Self-citationParagliola, G., & Coronato, A. (2020) · Journal of Biomedical Informatics · doi:10.1016/j.jbi.2020.103648 · Cited by 43
Acharya, U. R., Mookiah, M. R. K., Sree, S. V., Yanti, R., Martis, R. J., Saba, L., Molinari, F., Guerriero, S., & Suri, J. S. (2013) · Springer eBooks · doi:10.1007/978-1-4614-8633-6_27 · Cited by 42
Self-citationLow-cost preventive screening using carotid ultrasound in patients with diabetes
Suri, J. S. (2020) · Frontiers in bioscience · doi:10.2741/4850 · Cited by 40
Self-citationChu, H., Chen, L., Yang, X., Qiu, X., Qiao, Z., Song, X., Zhao, E., Zhou, J., Zhang, W., Mehmood, A., et al. (2021) · Frontiers in Psychology · doi:10.3389/fpsyg.2021.645418 · Cited by 40
Performance Evaluation of Time-Frequency Distributions for ECG Signal Analysis
Hussein, A. F., Hashim, S. J., Aziz, A. F. A., Rokhani, F. Z., & Adnan, W. A. W. (2017) · Journal of Medical Systems · doi:10.1007/s10916-017-0871-8 · Cited by 39
Prediction Model Using Machine Learning for Mortality in Patients with Heart Failure
Negassa, A., Selim, A. M., Zolty, R., & Patel, S. R. (2021) · The American Journal of Cardiology · doi:10.1016/j.amjcard.2021.05.044 · Cited by 39
Jamthikar, A., Gupta, D., Johri, A. M., Mantella, L. E., Saba, L., & Suri, J. S. (2022) · Computers in Biology and Medicine · doi:10.1016/j.compbiomed.2021.105102 · Cited by 39
Self-citationApplication of machine learning in liver transplantation: a review
Tran, J., Sharma, D., Gotlieb, N., Xu, W., & Bhat, M. (2022) · Hepatology International · doi:10.1007/s12072-021-10291-7 · Cited by 39
Jamthikar, A. D., Gupta, D., Mantella, L. E., Saba, L., Johri, A. M., & Suri, J. S. (2022) · IEEE Transactions on Instrumentation and Measurement · doi:10.1109/tim.2021.3139693 · Cited by 39
Self-citationShandilya, S., Ward, K., Kurz, M. C., & Najarian, K. (2012) · BMC Medical Informatics and Decision Making · doi:10.1186/1472-6947-12-116 · Cited by 38
Gooty, V. D., Sinaiko, A. R., Ryder, J. R., Dengel, D. R., Jacobs, D. R., & Steinberger, J. (2018) · Metabolic Syndrome and Related Disorders · doi:10.1089/met.2017.0149 · Cited by 38
A novel multi-class approach for early-stage prediction of sudden cardiac death
Devi, R., Tyagi, H. K., & Kumar, D. (2019) · Journal of Applied Biomedicine · doi:10.1016/j.bbe.2019.05.011 · Cited by 38
A Low-cost, Low-energy Wearable ECG System with Cloud-Based Arrhythmia Detection
Huda, N., Khan, S. N., Abid, R., Shuvo, S. B., Labib, M. M., & Hasan, T. (2020) · IEEE Region 10 Symposium (TENSYMP) · doi:10.1109/tensymp50017.2020.9230619 · Cited by 38
Mehrang, S., Lahdenoja, O., Kaisti, M., Tadi, M. J., Hurnanen, T., Airola, A., Knuutila, T., Jaakkola, J., Jaakkola, S., Vasankari, T., et al. (2020) · IEEE Sensors Journal · doi:10.1109/jsen.2020.2981334 · Cited by 36
Carotid plaque imaging profiling in subjects with risk factors (diabetes and hypertension)
Porcu, M., Mannelli, L. D. C., Melis, M., Suri, J. S., Gerosa, C., Cerrone, G., Defazio, G., Faa, G., & Saba, L. (2020) · Cardiovascular Diagnosis and Therapy · doi:10.21037/cdt.2020.01.13 · Cited by 34
Self-citationEvaluation of mHealth Applications Related to Cardiovascular Diseases: a Systematic Review
Villarreal, V., & Berbey-Álvarez, A. (2020) · Acta Informatica Medica · doi:10.5455/aim.2020.28.130-137 · Cited by 34
Jamthikar, A. D., Gupta, D., Johri, A. M., Mantella, L. E., Saba, L., Kolluri, R., Sharma, A., Viswanathan, V., Nicolaides, A. N., & Suri, J. S. (2020) · Journal of Medical Systems · doi:10.1007/s10916-020-01675-7 · Cited by 34
Self-citationEder, S. J., Nicholson, A. A., Stefańczyk, M., Pieniak, M., Molina, J. M., Pešout, O., Binter, J., Smela, P., Scharnowski, F., & Steyrl, D. (2021) · Frontiers in Psychology · doi:10.3389/fpsyg.2021.647956 · Cited by 34
Johri, A. M., Mantella, L. E., Jamthikar, A. D., Saba, L., Laird, J. R., & Suri, J. S. (2021) · International journal of cardiac imaging · doi:10.1007/s10554-021-02294-0 · Cited by 34
Self-citationECG criteria for the detection of high-risk cardiovascular conditions in master athletes
Panhuyzen-Goedkoop, N. M., Wellens, H. J. J., Verbeek, A. L. M., Jorstad, H. T., Smeets, J. L. R. M., & Peters, R. J. G. (2020) · European Journal of Preventive Cardiology · doi:10.1177/2047487319901060 · Cited by 33
A Hybrid Feature Selection and Extraction Methods for Sleep Apnea Detection Using Bio-Signals
Li, X., Ling, S. H., & Su, S. W. (2020) · Sensors · doi:10.3390/s20154323 · Cited by 33
Saba, L., Ikeda, N., Deidda, M., Araki, T., Molinari, F., Meiburger, K. M., Acharya, U. R., Nagashima, Y., Mercuro, G., Nakano, M., et al. (2013) · Diabetes Research and Clinical Practice · doi:10.1016/j.diabres.2013.03.032 · Cited by 31
Self-citationGuo, L., Jin, B., Yu, R., Yao, C., Sun, C., & Huang, D. (2016) · IEEE Access · doi:10.1109/access.2016.2578638 · Cited by 31
Buss, V. H., Leesong, S., Barr, M. L., Varnfield, M., & Harris, M. (2020) · Journal of Medical Internet Research · doi:10.2196/21159 · Cited by 31
Superharmonic Imaging for Medical Ultrasound: a Review
Londhe, N. D., & Suri, J. S. (2016) · Journal of Medical Systems · doi:10.1007/s10916-016-0635-x · Cited by 30
Self-citationJamthikar, A. D., Puvvula, A., Gupta, D., Johri, A. M., Nambi, V., Khanna, N. N., Saba, L., Mavrogeni, S. I., Laird, J. R., Pareek, G., et al. (2021) · International Angiology · doi:10.23736/s0392-9590.20.04538-1 · Cited by 30
Self-citationIkeda, N., Araki, T., Sugi, K., Nakamura, M., Deidda, M., Molinari, F., Meiburger, K. M., Acharya, U. R., Saba, L., Bassareo, P. P., et al. (2014) · Current Atherosclerosis Reports · doi:10.1007/s11883-013-0393-x · Cited by 29
Self-citationCombined Femoral and Carotid Plaque Burden Identifies Obstructive Coronary Artery Disease in Women
Colledanchise, K. N., Mantella, L. E., Bullen, M., Hétu, M., Abunassar, J. G., & Johri, A. M. (2019) · Journal of the American Society of Echocardiography · doi:10.1016/j.echo.2019.07.024 · Cited by 29
Self-citationViswanathan, V., Jamthikar, A. D., Gupta, D., Puvvula, A., Khanna, N. N., Saba, L., Višković, K., Mavrogeni, S. I., Turk, M., Laird, J. R., et al. (2020) · International Angiology · doi:10.23736/s0392-9590.20.04338-2 · Cited by 29
Self-citation
Research works printed but not linked: 4
- Saba, L., and Suri, J.S. (2013). Multi-Detector CT Imaging: Principles, Head, Neck, and Vascular Systems, CRC Press.
- Lo, 2013, Generalized k-labelsets ensemble for multi-label and cost-sensitive classification, IEEE Trans. Knowl. Data Eng., 26, 1679
- Zuluaga, M.A., Cardoso, M.J., and Ourselin, S. (2020). Automatic right ventricle segmentation using multi-label fusion in cardiac MRI. arXiv.
- Puvar, 2021, Heart Disease Detection using Ensemble Learning Approach, Int. Res. J. Eng. Technol. (IRJET), 8, 2395-0072
Cited by
Economics of artificial intelligence in healthcare: Diagnosis vs. treatment
Khanna, N. N., Maindarkar, M. A., Viswanathan, V., Fernandes, J. F. E., Paul, S., Bhagawati, M., Ahluwalia, P., Ruzsa, Z., Sharma, A., Kolluri, R., et al. (2022) · Healthcare · doi:10.3390/healthcare10122493 · Cited by 347
“AI technological development improves existing systems, especially medical imaging [9,14] and coronary artery disease diagnosis [15,16], reducing human error, increasing patient care overall, and making doctors’ responsibilities easier [17].”
BackgroundSelf-citationCai, Y., Cai, Y.-Q., Tang, L.-Y., Wang, Y.-H., Gong, M., Jing, T.-C., Li, H.-J., Li-Ling, J., Hu, W., Yin, Z., et al. (2024) · BMC Medicine · doi:10.1186/s12916-024-03273-7 · Cited by 122
Suri, J. S., Bhagawati, M., Agarwal, S., Paul, S., Pandey, A., Gupta, S. K., Saba, L., Paraskevas, K. I., Khanna, N. N., Laird, J. R., et al. (2022) · IEEE Access · doi:10.1109/access.2022.3232561 · Cited by 99
Self-citationJain, P. K., Dubey, A., Saba, L., Khanna, N. N., Laird, J. R., Nicolaides, A. N., Fouda, M. M., Suri, J. S., & Sharma, N. (2022) · Journal of Cardiovascular Development and Disease · doi:10.3390/jcdd9100326 · Cited by 80
Self-citationArtificial intelligence bias in medical system designs: a systematic review
Kumar, A., Aelgani, V., Vohra, R., Gupta, S. K., Bhagawati, M., Paul, S., Saba, L., Suri, N., Khanna, N. N., Laird, J. R., et al. (2023) · Multimedia Tools and Applications · doi:10.1007/s11042-023-16029-x · Cited by 65
Self-citation
Metadata
- Authors
- Suri, J. S., Bhagawati, M., Paul, S., Protogerou, A. D., Sfikakis, P. P., Kitas, G. D., Khanna, N. N., Ruzsa, Z., Sharma, A. M., Saxena, S., Faa, G., Laird, J. R., Johri, A. M., Kalra, M. K., Paraskevas, K. I., & Saba, L.
- Affiliations
- Stroke Diagnostic and Monitoring Division, AtheroPoint™, Roseville, CA 95661, USA
- North Eastern Hill University (IN)
- Research Unit Clinic, Laboratory of Pathophysiology, Department of Cardiovascular Prevention, National and Kapodistrian University of Athens, 11527 Athens, Greece
- National and Kapodistrian University of Athens (GR)
- University of Manchester (GB)
- Indraprastha Apollo Hospitals (IN)
- Department of Internal Medicines, Invasive Cardiology Division, University of Szeged, 6720 Szeged, Hungary
- University of Virginia (US)
- International Institute of Information Technology (IN)
- Azienda Ospedaliero-Universitaria Cagliari (IT)
- St. Helena Hospital (US)
- Queen's University (CA)
- Massachusetts General Hospital (US)
- Department of Vascular Surgery, Central Clinic of Athens, N. Iraklio, 14122 Athens, Greece
- Corresponding author
- Suri, Jasjit S.
- ORCID
- Venue
- Diagnostics
- Publisher
- MDPI AG
- Published
- 2022-03-16
- Volume
- 12
- Issue
- 3
- Pages
- 722
- ISSN
- 2075-4418 (ISSN-L)
- PMC
- PMC8947682
- OpenAlex
- W4220653406
- Cited by
- 55
- References
- 263
- Citations by year
- 2026: 6 · 2025: 12 · 2024: 17 · 2023: 14 · 2022: 6
- FWCI
- 1.80
- Type
- journal article
- Language
- en
- Open access
- gold
- doi.org
- Licence
- Locations
- Diagnostics (publishedVersion, cc-by)
- PubMed Central (publishedVersion, cc-by)
- PubMed (publishedVersion)
- SZTE Publicatio Repozitórium (University of Szeged) (acceptedVersion, other-oa)
- DOAJ (DOAJ: Directory of Open Access Journals) (submittedVersion, cc-by-sa)
- UNICA IRIS Institutional Research Information System (University of Cagliari) (submittedVersion, other-oa)
- Topics
- Health Sciences › Health Professions › Health Information Management › Artificial Intelligence in Healthcare
- Health Sciences › Medicine › Health Informatics › Artificial Intelligence in Healthcare and Education
- Physical Sciences › Computer Science › Artificial Intelligence › Machine Learning in Healthcare
- Keywords
- cardiovascular risk stratification, cardiovascular disease risk assessment, multi-class classification, multi-label classification, ensemble learning, artificial intelligence in cardiology, risk of bias, deep learning
About these checks
Registry, retraction, Cites and statistics results are computed, not judged, with one exception: a printed reference that no index lists is read once by a model before it counts as a citation error. Claims are extracted by a model and kept only when their quote appears verbatim in the text; each cited source is then checked, with a model’s help, for whether it says what the claim relies on. Those verdicts can be wrong — read the claim’s quote and the cited source before relying on one.
Statistics and arithmetic are recomputed, not judged.
Confidence bands are shown only for fields calibrated on our annotated test set. None is calibrated yet, so no band is shown.
What counts as a claim ›How we measure confidence ›How we check this ›
Are you an author, or do you see a problem with this page? Request a review
Data sources
Bibliographic data: Semantic Scholar, OpenAlex, Crossref.
Contains information from the Semantic Scholar Academic Graph Datasets, made available under the ODC Attribution License (ODC-BY 1.0).
Semantic Scholar’s data is described in: Kinney, R., et al. (2023). The Semantic Scholar Open Data Platform. arXiv:2301.10140.
