

The DOI matches its Crossref record; 61 of the 61 references it cites were found in a registry or an index.
Microalgae as Functional Ingredients in Savory Food Products: Application to Wheat Crackers
Open accessAbstract
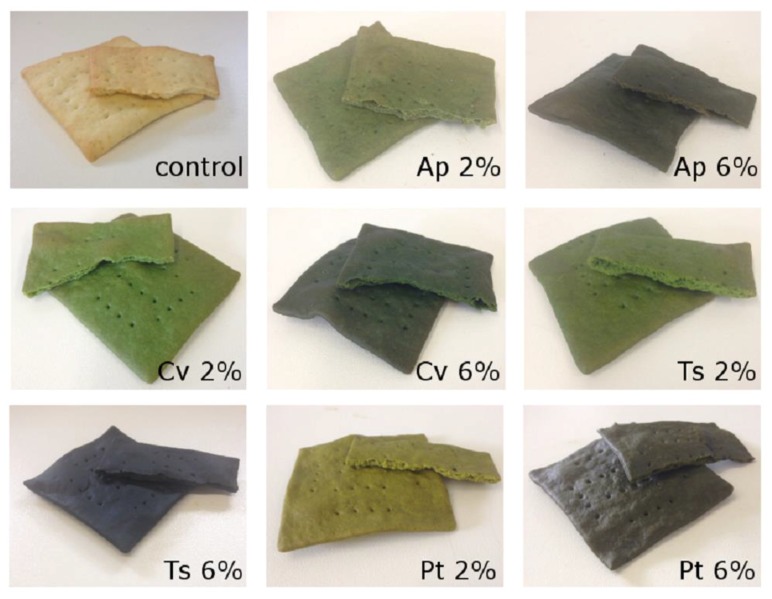
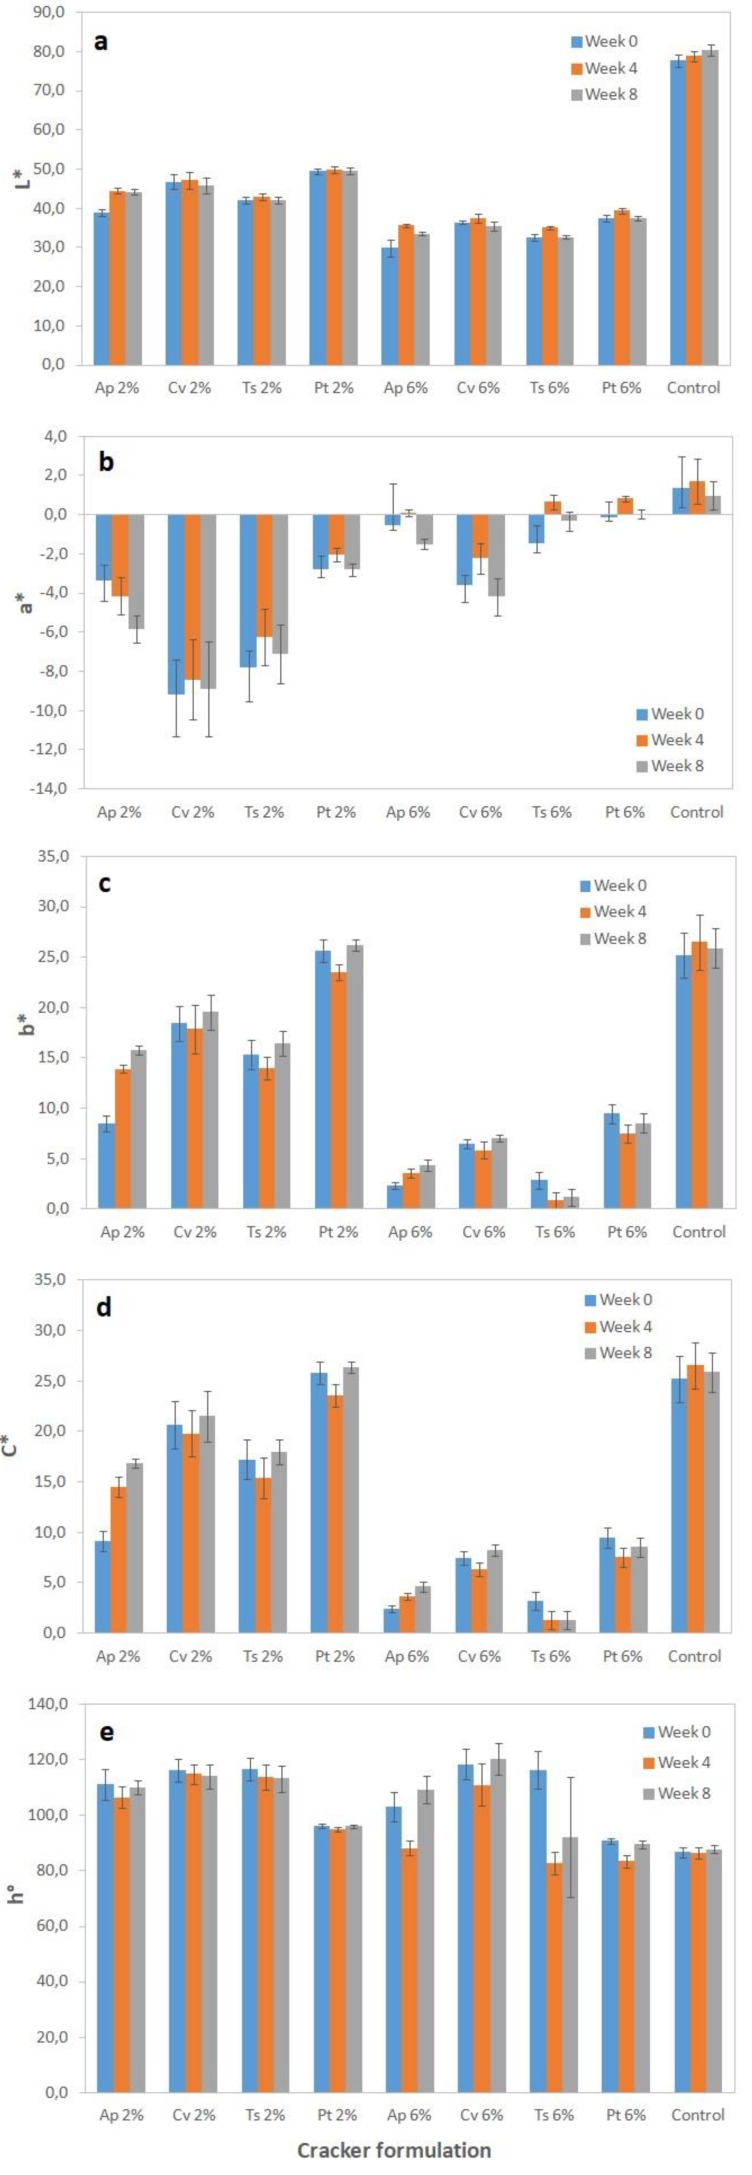
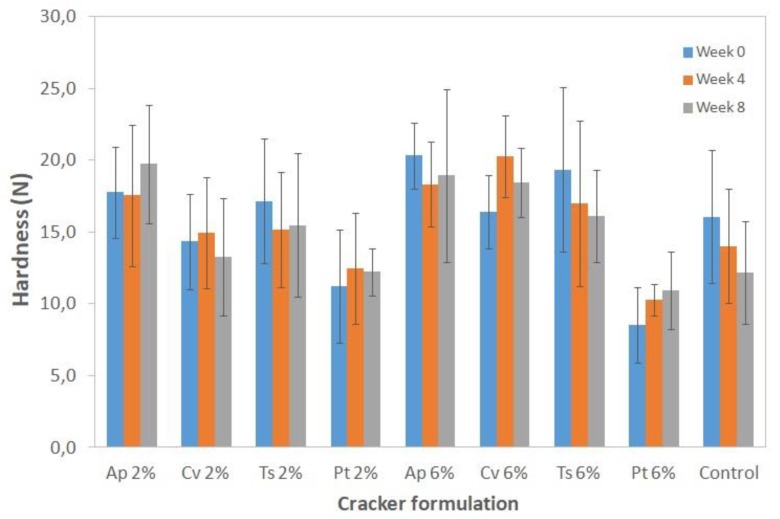
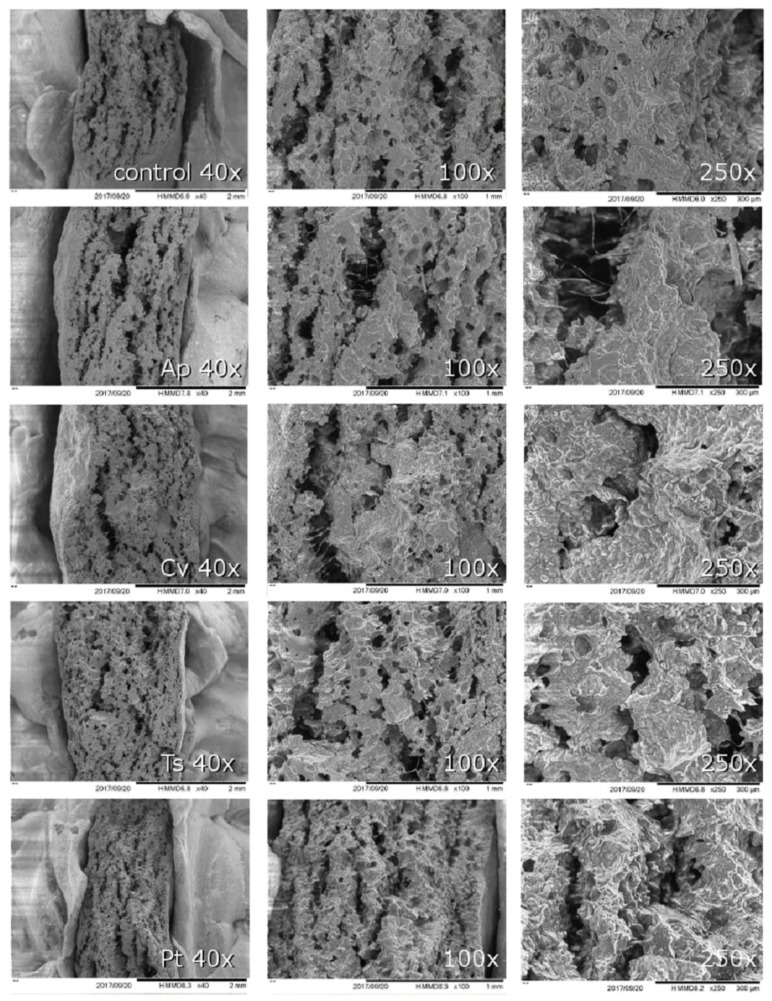
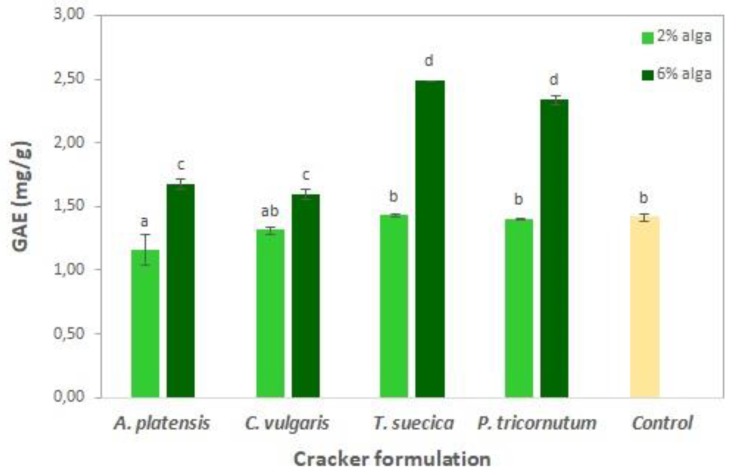
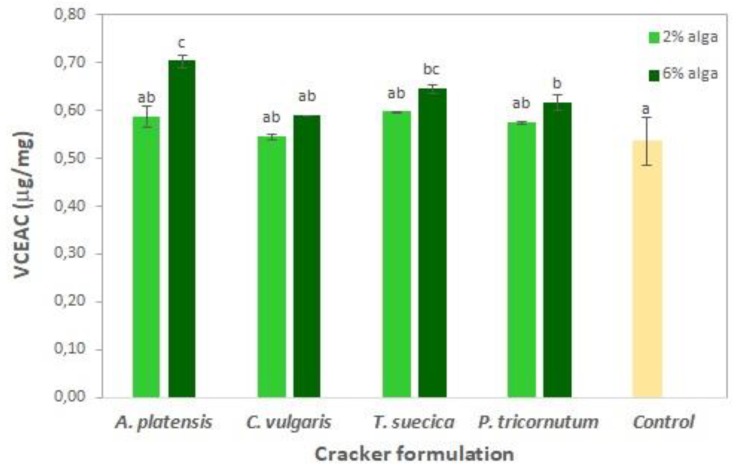
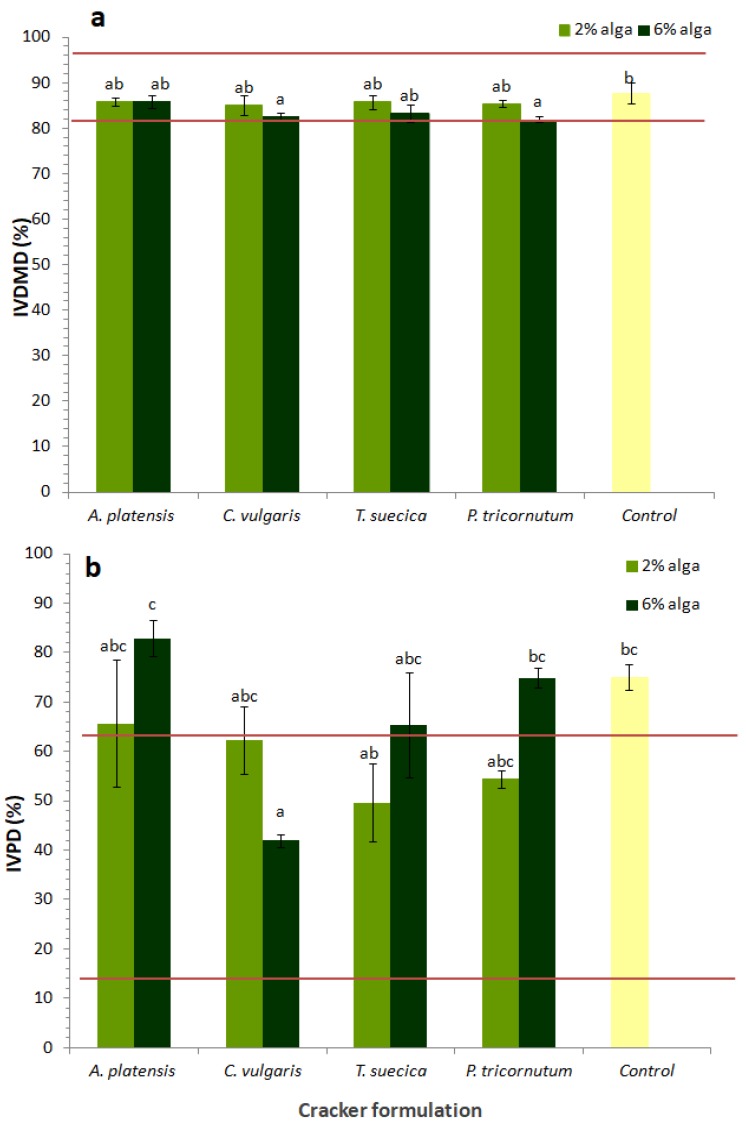
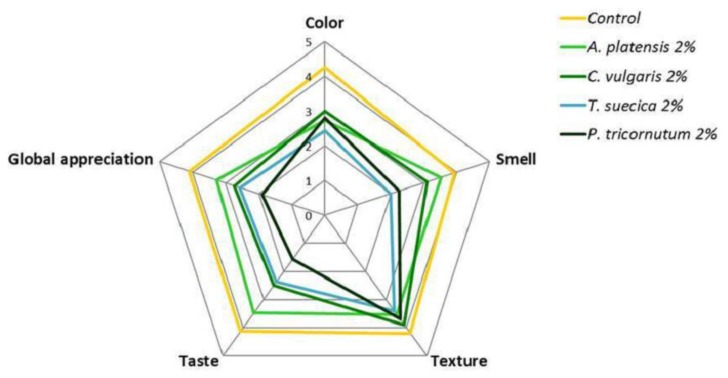
Crackers are widely consumed snack foods and there is an increasing trend in adding functional ingredients to their composition. In the present work, the dried biomasses of four microalgae strains—Arthrospira platensis F&M-C256, Chlorella vulgaris Allma, Tetraselmis suecica F&M-M33, and Phaeodactylum tricornutum F&M-M40—were used as a source of proteins, antioxidants, and other bioactive molecules in artisanal wheat crackers. Two incorporation levels were tested: 2% (w/w) and 6% (w/w). The impact of microalgae addition was evaluated in terms of physical properties, biochemical composition, antioxidant activity, in vitro digestibility, and sensory characteristics. Microalgae crackers presented stable color and texture throughout eight weeks of storage. Microalgae crackers were slightly thinner and lighter than the control but presented a similar density in agreement with scanning electron microscope images, indicating that gas retention was not greatly affected by microalgae addition. Regarding biochemical composition, 6% A. platensis and C. vulgaris crackers presented a significantly higher protein content (13.2–13.5%), for which they could be claimed to be a “source of protein” according to the Regulation (EC) No. 1924/2006. A. platensis crackers showed the highest antioxidant activity and attained better sensory analysis scores. T. suecica and P. tricornutum crackers showed high phenolic content and antioxidant activity but attained low sensory scores mainly because of their unattractive fishy off-flavor.
Overview
The claims and statistics of this paper haven’t been checked yet.
Run the check — free, no account needed. It reads the open-access text and checks the sources it cites.
Integrity signals
Registry
Cites
Statistics
Figures
Verification
Claims the paper makes
The claims and statistics of this paper haven’t been checked yet.
Run the check — free, no account needed. It reads the open-access text and checks the sources it cites.
Claims other papers make about this one
Each is checked against this paper’s own text: does it say what the citing paper says it does?
The cited source doesn’t support the claim as written.
In the citing paper
“On the other hand, research carried out by El Nakib et al. [34] demonstrated that the nutritional content of biscuits might be improved by adding certain percentages of spirulina to the foods that schoolchildren eat for snacks. The percentages tested were 0%, 5%, 10%, and 15%. It also revealed an increase in fatty acids, such as omega-3, omega-6, omega-7, and omega-9, with omega-6 containing the”
From Trends and Technological Advancements in the Possible Food Applications of Spirulina and Their Health Benefits: A Review. (2022) · cites this paper as [83]
Checked by a reasoning model — may be wrong.
Experimental — accuracy not yet measuredThe source backs part of the claim, not all of it — or backs it for a different population, condition or comparison.
In the citing paper
“The quantity of protein that could be digested in the treated samples was 11.9 g/100 g of biscuits. This proportion is much greater than the one found in the control sample, which had a protein content of 9.8% and a digestible protein content of 7.3 g/100 g of biscuits.”
From Trends and Technological Advancements in the Possible Food Applications of Spirulina and Their Health Benefits: A Review. (2022) · cites this paper as [83]
Experimental — accuracy not yet measuredThe source backs part of the claim, not all of it — or backs it for a different population, condition or comparison.
In the citing paper
“As a result, these additions are regarded as a source of protein, since the biscuit that was loaded with the spirulina alga A. platensis had the strongest antioxidant activity and received the highest score in the sensory evaluation [83].”
From Trends and Technological Advancements in the Possible Food Applications of Spirulina and Their Health Benefits: A Review. (2022) · cites this paper as [83]
Experimental — accuracy not yet measuredThe source backs part of the claim, not all of it — or backs it for a different population, condition or comparison.
In the citing paper
“In addition, Batista et al. [83] revealed that when estimating the amount of total phenols in biscuits enriched with spirulina algae, the addition of spirulina by 2% did not give any significant differences compared to the control sample, as the amount of phenols was 1.4 mg gallic acid/g, while the content of phenolics increased significantly to 1.6–1.7 mg gallic acid/g when spirulina was increa”
From Trends and Technological Advancements in the Possible Food Applications of Spirulina and Their Health Benefits: A Review. (2022) · cites this paper as [83]
Experimental — accuracy not yet measuredThe source backs part of the claim, not all of it — or backs it for a different population, condition or comparison.
In the citing paper
“Numerous minerals, including potassium phosphate, potassium sulfate, sodium (sodium carbonate, sodium bicarbonate, sodium nitrate, and sodium chloride), phosphorous (potassium phosphate), calcium (calcium chloride), magnesium (hydrated magnesium sulfate), iron (ferrous sulfate hydrate), and EDTA, are required for the growth of spirulina and must be present in the culture medium [44].”
From Tendencies Affecting the Growth and Cultivation of Genus Spirulina: An Investigative Review on Current Trends (2022) · cites this paper as [44]
Experimental — accuracy not yet measured
The source backs part of the claim, not all of it — or backs it for a different population, condition or comparison.
In the citing paper
“In order to carry out photosynthesis, the medium in which the algae is grown must have carbon. Because spirulina contains 47% of the carbon that is required for its growth, the medium in which it is grown has a very high concentration of sodium bicarbonate (10.8 g/L) and sodium carbonate (7.6 g/L) [44].”
From Tendencies Affecting the Growth and Cultivation of Genus Spirulina: An Investigative Review on Current Trends (2022) · cites this paper as [44]
Experimental — accuracy not yet measuredThe source backs part of the claim, not all of it — or backs it for a different population, condition or comparison.
In the citing paper
“Despite the fact that the spirulina medium has modest concentrations of iron (2 mg/L), it has a rather significant quantity of iron (0.58–1.8 g/kg) in its biomass [44].”
From Tendencies Affecting the Growth and Cultivation of Genus Spirulina: An Investigative Review on Current Trends (2022) · cites this paper as [44]
Experimental — accuracy not yet measuredThe cited source says what the claim attributes to it.
In the citing paper
“Batista et al. [83] were able to boost the protein availability in the biscuit samples by adding A. platensis as a high protein food source.”
From Trends and Technological Advancements in the Possible Food Applications of Spirulina and Their Health Benefits: A Review. (2022) · cites this paper as [83]
The cited source says what the claim attributes to it.
In the citing paper
“The incorporation of 6% each of spirulina and Chlorella resulted in significantly increased protein content (13.2–13.5%) [83].”
From Trends and Technological Advancements in the Possible Food Applications of Spirulina and Their Health Benefits: A Review. (2022) · cites this paper as [83]
The check wasn’t confident either way, so it gives no verdict — never disputed.
In the citing paper
“At a temperature of 30 °C, it was observed that using urea as a source of nitrogen in spirulina made its absorption by the spirulina easier, which resulted in an increase in biomass, but had no effect on the chlorophyll content [14,44].”
From Tendencies Affecting the Growth and Cultivation of Genus Spirulina: An Investigative Review on Current Trends (2022) · cites this paper as [44]
Experimental — accuracy not yet measuredThe check wasn’t confident either way, so it gives no verdict — never disputed.
In the citing paper
“It was determined to be 0.78 g/L (based on dry weight), and after 40 h of cultivation, the growth rate increased to 0.82 g/L after sodium bicarbonate was added.”
From Tendencies Affecting the Growth and Cultivation of Genus Spirulina: An Investigative Review on Current Trends (2022) · cites this paper as [44]
Experimental — accuracy not yet measuredThe check wasn’t confident either way, so it gives no verdict — never disputed.
In the citing paper
“Growth variables such as light intensity, temperature, pH, and salinity can have a major influence on the lipid and pigment content in cells of spirulina, which determines the composition of nutrients in spirulina biomass and is dependent on these growing parameters [1,44].”
From Tendencies Affecting the Growth and Cultivation of Genus Spirulina: An Investigative Review on Current Trends (2022) · cites this paper as [44]
Experimental — accuracy not yet measuredThe check wasn’t confident either way, so it gives no verdict — never disputed.
In the citing paper
“At a pH range of 8.0–8.3, the biomass of Spirulina spp. that was grown in saltwater with urea was 7.35 g (dry weight)/m2/day. This was a lower value than the biomass of Spirulina spp. that was grown in seawater with sodium bicarbonate (NaHCO3), which was 8.14 g/m2/day [14,44].”
From Tendencies Affecting the Growth and Cultivation of Genus Spirulina: An Investigative Review on Current Trends (2022) · cites this paper as [44]
Experimental — accuracy not yet measuredThe check wasn’t confident either way, so it gives no verdict — never disputed.
In the citing paper
“It was found that the nitrogen content of 2.5 g/L was ideal for the medium, and that urea was a superior source of nitrogen to either ammonium or nitrate as a fertilizer ingredient.”
From Tendencies Affecting the Growth and Cultivation of Genus Spirulina: An Investigative Review on Current Trends (2022) · cites this paper as [44]
Experimental — accuracy not yet measuredThe check wasn’t confident either way, so it gives no verdict — never disputed.
In the citing paper
“increasing the phosphate concentration to 250 mg/L in the form of potassium phosphate K2HPO4 boosted the production of biomass [44].”
From Tendencies Affecting the Growth and Cultivation of Genus Spirulina: An Investigative Review on Current Trends (2022) · cites this paper as [44]
Experimental — accuracy not yet measuredThe check wasn’t confident either way, so it gives no verdict — never disputed.
In the citing paper
“Spirulina does not grow below 17 °C, but it does not perish above 38 °C. The optimal temperature for growth is 35 °C, but temperatures that are higher than 38 °C either prevent or disrupt its growth [1,44].”
From Tendencies Affecting the Growth and Cultivation of Genus Spirulina: An Investigative Review on Current Trends (2022) · cites this paper as [44]
Experimental — accuracy not yet measuredThe check wasn’t confident either way, so it gives no verdict — never disputed.
In the citing paper
“After 21 days of batch cultivation (1.21 g/L), higher dry weights were reported for 20% of the regular Zarrouk medium compared to 0.84 g/L for the Zarrouk-modified medium.”
From Tendencies Affecting the Growth and Cultivation of Genus Spirulina: An Investigative Review on Current Trends (2022) · cites this paper as [44]
Experimental — accuracy not yet measuredThe check wasn’t confident either way, so it gives no verdict — never disputed.
In the citing paper
“The characteristics of the water quality contributed to the mass production of algae and had a double effect by affecting the solubility of added nutrients in the agricultural media and the accumulation of some heavy metals by the algae while they were in the growth stage. In addition, the water quality characteristics had an effect on the mass production of algae [44,45,46].”
From Tendencies Affecting the Growth and Cultivation of Genus Spirulina: An Investigative Review on Current Trends (2022) · cites this paper as [44]
Experimental — accuracy not yet measuredThe check wasn’t confident either way, so it gives no verdict — never disputed.
In the citing paper
“Due to the high nutrient and salt requirements of spirulina, it can only be naturally cultivated in salt lakes [44,45,46].”
From Tendencies Affecting the Growth and Cultivation of Genus Spirulina: An Investigative Review on Current Trends (2022) · cites this paper as [44]
Experimental — accuracy not yet measuredThe check wasn’t confident either way, so it gives no verdict — never disputed.
In the citing paper
“Spirulina has the ability to grow and adapt in environments with high salt, and it can be cultivated in salinities ranging from 10 to 40 psi without experiencing substantial changes in its biomass dry weight, chemical composition, or fatty acid levels [44,45,53].”
From Tendencies Affecting the Growth and Cultivation of Genus Spirulina: An Investigative Review on Current Trends (2022) · cites this paper as [44]
Experimental — accuracy not yet measuredIn the citing paper
“Batista et al. [142] reported that cookies made with 2% (w/w) Arthrospira achieved positive results regarding their flavor.”
From Challenges in Functional Food Products with the Incorporation of Some Microalgae (2024) · cites this paper as [142]
Self-check
Percentages, sums and reported differences re-computed from the paper’s own numbers.
The self-check needs the paper’s full text.
Citations
Cites
PROTEIN MEASUREMENT WITH THE FOLIN PHENOL REAGENT
Lowry, O. H., Rosebrough, N., Farr, A. L., & Randall, R. (1951) · Journal of Biological Chemistry · doi:10.1016/s0021-9258(19)52451-6 · Cited by 316,394
Guillard, R. R., & Ryther, J. (1962) · Canadian Journal of Microbiology (print) · doi:10.1139/m62-029 · Cited by 7,663
Micro-algae as a source of protein
Becker, E. W. (2007) · Biotechnology Advances · doi:10.1016/j.biotechadv.2006.11.002 · Cited by 2,311
Algae as nutritional and functional food sources: revisiting our understanding.
Wells, M. L., Potin, P., Craigie, J. S., Raven, J. A., Merchant, S. S., Helliwell, K. E., Smith, A. G., Camire, M. E., & Brawley, S. H. (2017) · Journal of Applied Phycology · doi:10.1007/s10811-016-0974-5 · Cited by 1,562
Outdoor cultivation of microalgae for carotenoid production: Current state and perspectives
Del Campo, J. A., García-González, M., & Guerrero, M. G. (2007) · Applied Microbiology and Biotechnology · doi:10.1007/s00253-007-0844-9 · Cited by 739
Trends in Microalgae Incorporation Into Innovative Food Products With Potential Health Benefits
Caporgno, M. P., & Mathys, A. (2018) · Frontiers in Nutrition · doi:10.3389/fnut.2018.00058 · Cited by 639
Innovative natural functional ingredients from microalgae
Plaza, M., Herrero, M., Cifuentes, A., & Ibáñez, E. (2009) · Journal of Agricultural and Food Chemistry · doi:10.1021/jf901070g · Cited by 509
Salt reduction in the United Kingdom: a successful experiment in public health
He, F. J., Brinsden, H. C., & MacGregor, G. A. (2014) · Journal of Human Hypertension · doi:10.1038/jhh.2013.105 · Cited by 456
Comparison of microalgal biomass profiles as novel functional ingredient for food products
Batista, A. P., Gouveia, L., Bandarra, N. M., Franco, J. M., & Raymundo, A. (2013) · Algal Research · doi:10.1016/j.algal.2013.01.004 · Cited by 450
Self-citationA Potential Commercial Source of Fucoxanthin Extracted from the Microalga Phaeodactylum tricornutum
Kim, S. M., Jung, Y.-J., Kwon, O.-N., Cha, K. H., Um, B.-H., Chung, D., & Pan, C.-H. (2012) · Applied Biochemistry and Biotechnology · doi:10.1007/s12010-012-9602-2 · Cited by 417
Batista, A. P., Niccolai, A., Fradinho, P., Fragoso, S., Bursic, I., Rodolfi, L., Biondi, N., Tredici, M. R., Sousa, I., & Raymundo, A. (2017) · Algal Research · doi:10.1016/j.algal.2017.07.017 · Cited by 407
Microalgae of interest as food source: biochemical composition and digestibility.
Niccolai, A., Chini Zittelli, G., Rodolfi, L., Biondi, N., & Tredici, M. R. (2019) · Algal Research · doi:10.1016/j.algal.2019.101617 · Cited by 403
Self-citationGanesan, P., Kumar, C. S., & Bhaskar, N. (2008) · Bioresource Technology · doi:10.1016/j.biortech.2007.07.005 · Cited by 393
Microalgae as Healthy Ingredients for Functional Food: A Review
Matos, J., Cardoso, C., Bandarra, N. M., & Afonso, C. (2017) · Food & Function · doi:10.1039/c7fo00409e · Cited by 393
Anti-Obesity Activity of the Marine Carotenoid Fucoxanthin
Gammone, M. A., & D’Orazio, N. (2015) · Marine Drugs · doi:10.3390/md13042196 · Cited by 323
Spirulina for snack enrichment: Nutritional, physical and sensory evaluations
Lucas, B. F., de Morais, M. G., Santos, T. D., & Costa, J. A. V. (2017) · LWT · doi:10.1016/j.lwt.2017.12.032 · Cited by 289
Sensory Methods of Texture and Viscosity Measurement
Bourne, M. C. (2002) · Elsevier eBooks · doi:10.1016/b978-012119062-0/50007-3 · Cited by 276
Fradique, M., Batista, A. P., Nunes, M. C., Gouveia, L., Bandarra, N. M., & Raymundo, A. (2010) · Journal of the Science of Food and Agriculture · doi:10.1002/jsfa.3999 · Cited by 274
Self-citationEffects of Spirulina Biomass on the Technological and Nutritional Quality of Bread Wheat Pasta
Rodríguez De Marco, E., Steffolani, M. E., Martínez, C. S., & León, A. E. (2014) · LWT - Food Science and Technology · doi:10.1016/j.lwt.2014.02.054 · Cited by 257
Spirulina in Health Care Management
Kulshrestha, A., Zacharia, A., Jarouliya, U., Jadaun, P., Prasad, G., & Bisen, P. (2008) · Current Pharmaceutical Biotechnology · doi:10.2174/138920108785915111 · Cited by 238
Development of gluten-free cracker snacks using pulse flours and fractions
Han, J., Janz, J. A. M., & Gerlat, M. (2009) · Food Research International · doi:10.1016/j.foodres.2009.07.015 · Cited by 211
Chlorella vulgaris biomass used as colouring source in traditional butter cookies
Gouveia, L., Batista, A. P., Miranda, A., Empis, J., & Raymundo, A. (2007) · Innovative Food Science & Emerging Technologies · doi:10.1016/j.ifset.2007.03.026 · Cited by 195
Self-citationMuys, M., Sui, Y., Schwaiger, B., Lesueur, C., Vandenheuvel, D., Vermeir, P., & Vlaeminck, S. E. (2019) · Bioresource Technology · doi:10.1016/j.biortech.2018.12.059 · Cited by 175
Tredici, M. R., Bassi, N., Prussi, M., Biondi, N., Rodolfi, L., Zittelli, G. C., & Sampietro, G. (2015) · Applied Energy · doi:10.1016/j.apenergy.2015.01.086 · Cited by 166
Self-citationRajauria, G., Jaiswal, A. K., Abu‐Ghannam, N., & Gupta, S. (2012) · Journal of Food Biochemistry · doi:10.1111/j.1745-4514.2012.00663.x · Cited by 160
Isochrysis galbana and Diacronema vlkianum biomass incorporation in pasta products as PUFA’s source
Fradique, M., Batista, A. P., Nunes, M. C., Gouveia, L., Bandarra, N. M., & Raymundo, A. (2012) · LWT · doi:10.1016/j.lwt.2012.05.006 · Cited by 156
Self-citationHarvest of Arthrospira platensis from Lake Kossorom (Chad) and its household usage among the Kanembu
Abdulqader, G., Barsanti, L. A., & Tredici, M. R. (2000) · Journal of Applied Phycology · doi:10.1023/a:1008177925799 · Cited by 154
Self-citationAntioxidant properties and lipid composition of selected microalgae
BANSKOTA, A. H., Sperker, S. A., Stefanova, R., McGinn, P. J., & O’Leary, S. J. B. (2018) · Journal of Applied Phycology · doi:10.1007/s10811-018-1523-1 · Cited by 154
Critical Evaluation of Crispy and Crunchy Textures: A Review
Tunick, M. H., Onwulata, C. I., Thomas, A. E., Phillips, J. G., Mukhopadhyay, S., Sheen, S., Liu, C., Latona, N. P., Pimentel, M. R., & Cooke, P. H. (2012) · International Journal of Food Properties · doi:10.1080/10942912.2011.573116 · Cited by 150
Optimization of a process for high fibre and high protein biscuit
Singh, P., Singh, R., Jha, A., Rasane, P., & Gautam, A. (2013) · Journal of Food Science and Technology · doi:10.1007/s13197-013-1139-z · Cited by 143
Wang, Y., Zhang, M., & Mujumdar, A. S. (2012) · LWT - Food Science and Technology · doi:10.1016/j.lwt.2011.12.011 · Cited by 140
Quality assessment of gluten-free crackers based on buckwheat flour
Sedej, I., Sakač, M. B., Mandić, A., Mišan, A. Č., Pestorić, M., Šimurina, O., & Čanadanović‐Brunet, J. M. (2010) · LWT · doi:10.1016/j.lwt.2010.11.010 · Cited by 132
Impact of Chlorella vulgaris on the rheology of wheat flour dough and bread texture
Graça, C., Fradinho, P., de Sousa, I. M. N., & Raymundo, A. (2017) · LWT · doi:10.1016/j.lwt.2017.11.024 · Cited by 132
Self-citationFunctional biscuits with PUFA‐ω3 from Isochrysis galbana
Gouveia, L., Coutinho, C., Mendonça, E., Batista, A. P., Sousa, I., Bandarra, N. M., & Raymundo, A. (2008) · Journal of the Science of Food and Agriculture · doi:10.1002/jsfa.3166 · Cited by 126
Self-citationGarcía‐Segovia, P., Pagán, M. J., Lara, I. F., & Martı́nez-Monzó, J. (2017) · Food Science and Technology International · doi:10.1177/1082013217700259 · Cited by 123
Development of new green processes for the recovery of bioactives from Phaeodactylum tricornutum
Gilbert‐López, B., Barranco, A., Herrero, M., Cifuentes, A., & Ibáñez, E. (2016) · Food Research International · doi:10.1016/j.foodres.2016.04.022 · Cited by 120
Abiusi, F., Sampietro, G., Marturano, G., Biondi, N., Rodolfi, L., D’Ottavio, M., & Tredici, M. R. (2013) · Biotechnology and Bioengineering · doi:10.1002/bit.25014 · Cited by 116
Self-citationLactic acid fermentation of Arthrospira platensis (spirulina) biomass for probiotic-based products
Niccolai, A., Shannon, E., Abu‐Ghannam, N., Biondi, N., Rodolfi, L., & Tredici, M. R. (2018) · Journal of Applied Phycology · doi:10.1007/s10811-018-1602-3 · Cited by 103
Self-citationKweon, M., Slade, L., Levine, H., & Gannon, D. (2013) · Critical Reviews in Food Science and Nutrition · doi:10.1080/10408398.2011.578469 · Cited by 97
El‐Baky, H. H. A., Baroty, G. S. E., & Ibrahem, E. A. (2015) · PubMed · doi:10.3305/nh.2015.32.1.8804 · Cited by 97
Köse, A., Ozen, M. O., Elibol, M., & Öncel, S. Ş. (2017) · 3 Biotech · doi:10.1007/s13205-017-0832-4 · Cited by 95
Arimi, J. M., Duggan, E., O’Sullivan, M. G., Lyng, J. G., & O’Riordan, D. (2010) · Food Research International · doi:10.1016/j.foodres.2010.05.004 · Cited by 87
Pérez‐López, P., González‐García, S., Ulloa, R., Sineiro, J., Feijóo, G., & Moreira, M. T. (2013) · Journal of Cleaner Production · doi:10.1016/j.jclepro.2013.07.028 · Cited by 86
Benjakul, S., & Karnjanapratum, S. (2018) · Food Chemistry · doi:10.1016/j.foodchem.2018.03.124 · Cited by 82
An immune-enhancing water-soluble α-glucan from Chlorella vulgaris and structural characteristics
Tabarsa, M., Shin, I., Lee, J. H., Surayot, U., Park, W., & You, S. (2015) · Food Science and Biotechnology · doi:10.1007/s10068-015-0255-0 · Cited by 78
A MATHEMATICAL MODEL OF CRUNCHINESS/CRISPNESS LOSS IN BREAKFAST CEREALS1
Peleg, M. (1994) · Journal of Texture Studies · doi:10.1111/j.1745-4603.1994.tb00770.x · Cited by 76
Manohar, R. S., & Rao, P. H. (2002) · Food Research International · doi:10.1016/s0963-9969(02)00083-2 · Cited by 67
Nunes, M. C., Fernandes, I., Vasco, I., de Sousa, I. M. N., & Raymundo, A. (2020) · Foods · doi:10.3390/foods9050579 · Cited by 66
Self-citationMicroalgae biomass interaction in biopolymer gelled systems
Batista, A. P., Nunes, M. C., Raymundo, A., Gouveia, L., de Sousa, I. M. N., Cordobes, F., Guerrero, A. F., & Franco, J. M. (2010) · Food Hydrocolloids · doi:10.1016/j.foodhyd.2010.09.018 · Cited by 63
Self-citationAndersen, R. A. (2013) · Handbook of Microalgal Culture · doi:10.1002/9781118567166.ch1 · Cited by 62
Santana‐Casiano, J. M., González‐Dávila, M., González, A. G., Rico, M., López, A., & Martel, A. (2013) · Marine Chemistry · doi:10.1016/j.marchem.2013.11.001 · Cited by 58
Maneerote, J., Noomhorm, A., & Takhar, P. S. (2008) · LWT · doi:10.1016/j.lwt.2008.11.012 · Cited by 54
Schmidt, C., Geweke, I., Struck, S., Zahn, S., & Rohm, H. (2017) · International Journal of Food Science & Technology · doi:10.1111/ijfs.13639 · Cited by 46
Carcea, M., Sorto, M., Batello, C., Narducci, V., Aguzzi, A., Azzini, E., Fantauzzi, P., Finotti, E., Gabrielli, P., Galli, V., et al. (2015) · LWT - Food Science and Technology · doi:10.1016/j.lwt.2014.10.039 · Cited by 45
Marco, E. R. D., Steffolani, M. E., Martínez, M. L., & León, A. E. (2017) · International Journal of Food Science & Technology · doi:10.1111/ijfs.13609 · Cited by 45
In vitro toxicity of microalgal and cyanobacterial strains of interest as food source
Niccolai, A., Bigagli, E., Biondi, N., Rodolfi, L., Cinci, L., Luceri, C., & Tredici, M. R. (2016) · Journal of Applied Phycology · doi:10.1007/s10811-016-0924-2 · Cited by 39
Self-citationBigagli, E., Cinci, L., Niccolai, A., Tredici, M. R., Biondi, N., Rodolfi, L., Lodovici, M., D’Ambrosio, M., Mori, G., & Luceri, C. (2017) · Food Research International · doi:10.1016/j.foodres.2017.09.011 · Cited by 34
Self-citationWhole Grain Saltine Crackers: Formulation, Processing, and Quality Improvements
Li, J., Hou, G. G., & Chen, Z. (2013) · Cereal Foods World · doi:10.1094/cfw-58-4-0180 · Cited by 13
(2016) · Elsevier eBooks · doi:10.1016/c2015-0-01401-0 · Cited by 6
Formulation and evaluation of snack crackers made with peanut flour
Howard, B. M., McWatters, K. H., Saalia, F. K., & Hashim, I. B. (2009) · Cereal Foods World · Cited by 4
Formulation and Evaluation of Snack Crackers Made with Peanut Flour
McWatters (2009) · Cereal Foods World · doi:10.1094/cfw-54-4-0166 · Cited by 3
Research works printed but not linked: 3
- Zarrouk, C. (1966). Contribution à l’étude d’une cyanophycée. Influence de divers facteurs physiques et chimiques sur la croissance et la photosynthèse de Spirulina maxima (Setch et Gardner) Geitler. [Ph.D. Thesis, Université de Paris].
- Bolanho, 2014, Antioxidant and nutritional potential of cookies enriched with Spirulina platensis and sources of fibre, J. Food Nutr. Res., 53, 171
- Abraços, L.M.C. (2017). Estudo de ingredientes da Salvia sclareoides—Um contributo para o desenvolvimento de um novo suplemento alimentar. [Master’s Thesis, Faculdade de Ciências da Universidade de Lisboa].
Cited by
Sorted by citations
Carotenoids and Chlorophylls as Antioxidants
Pérez-Gálvez, A., Viera, I., & Roca, M. (2020) · Antioxidants · doi:10.3390/antiox9060505 · Cited by 519
Spirulina for the Food and Functional Food Industries
Lafarga, T., Fernández-Sevilla, J. M., González-López, C., & Acién-Fernández, F. G. (2020) · Food Research International · doi:10.1016/j.foodres.2020.109356 · Cited by 417
Microalgae as Sources of High-Quality Protein for Human Food and Protein Supplements
Wang, Y., Tibbetts, S. M., & McGinn, P. J. (2021) · Foods · doi:10.3390/foods10123002 · Cited by 360
Antioxidant Compounds from Microalgae: A Review
Coulombier, N., Jauffrais, T., & Lebouvier, N. (2021) · Marine Drugs · doi:10.3390/md19100549 · Cited by 291
The Potential and Challenge of Microalgae as Promising Future Food Sources
Chen, C., Tang, T., Shi, Q., Zhou, Z., & Fan, J. (2022) · Trends in Food Science & Technology · doi:10.1016/j.tifs.2022.06.016 · Cited by 229
Metadata
- Authors
- Batista, A. P., Niccolai, A., Bursic, I., Sousa, I., Raymundo, A., Rodolfi, L., Biondi, N., & Tredici, M. R.
- Affiliations
- University of Lisbon (PT)
- University of Florence (IT)
- LEAF—Linking Landscape, Environment, Agriculture and Food, Instituto Superior de Agronomia, Universidade de Lisboa, Tapada da Ajuda, 1349-017 Lisboa, Portugal
- Corresponding author
- Niccolai, Alberto
- ORCID
- Venue
- Foods
- Publisher
- MDPI AG
- Published
- 2019-11-23
- Volume
- 8
- Issue
- 12
- Pages
- 611
- ISSN
- 2304-8158 (ISSN-L)
- PMC
- PMC6963871
- OpenAlex
- W2989853209
- Cited by
- 203
- References
- 60
- Citations by year
- 2026: 23 · 2025: 37 · 2024: 48 · 2023: 38 · 2022: 22 · 2021: 19 · 2020: 16
- FWCI
- 12.70
- Type
- journal article
- Language
- en
- Open access
- gold
- dx.doi.org
- Licence
- Locations
- Foods (publishedVersion, cc-by)
- Europe PMC (PubMed Central) (publishedVersion, cc-by)
- PubMed Central (publishedVersion, cc-by)
- PubMed (publishedVersion)
- Florence Research (University of Florence) (submittedVersion, other-oa)
- Portuguese National Funding Agency for Science, Research and Technology (RCAAP Project by FCT) (submittedVersion, other-oa)
- Funders
- Fundação para a Ciência e a Tecnologia (UID/AGR/04129/2013)
- Topics
- Life Sciences › Agricultural and Biological Sciences › Aquatic Science › Seaweed-derived Bioactive Compounds
- Life Sciences › Agricultural and Biological Sciences › Food Science › Food Nutrient Composition and Product Development
- Life Sciences › Agricultural and Biological Sciences › Food Science › Seed and Plant Biochemistry
- Keywords
- microalgae, functional food ingredients, Spirulina platensis, Chlorella vulgaris, Tetraselmis suecica, Phaeodactylum tricornutum, protein content, antioxidant activity, phenolic compounds, in vitro digestibility, sensory evaluation, off-flavor, storage stability
About these checks
Registry, retraction, Cites and statistics results are computed, not judged, with one exception: a printed reference that no index lists is read once by a model before it counts as a citation error. Claims are extracted by a model and kept only when their quote appears verbatim in the text; each cited source is then checked, with a model’s help, for whether it says what the claim relies on. Those verdicts can be wrong — read the claim’s quote and the cited source before relying on one.
Statistics and arithmetic are recomputed, not judged.
Confidence bands are shown only for fields calibrated on our annotated test set. None is calibrated yet, so no band is shown.
What counts as a claim ›How we measure confidence ›How we check this ›
Are you an author, or do you see a problem with this page? Request a review
