

The DOI matches its Crossref record; 33 of the 35 references it cites were found in a registry or an index, and 2 are not checked yet; none of the 34 sources its claims cite is checked for support yet.
Exploring Personal Exposure to Airborne Microplastics across Various Work Environments in Pathum Thani Province, Thailand
Open accessAbstract
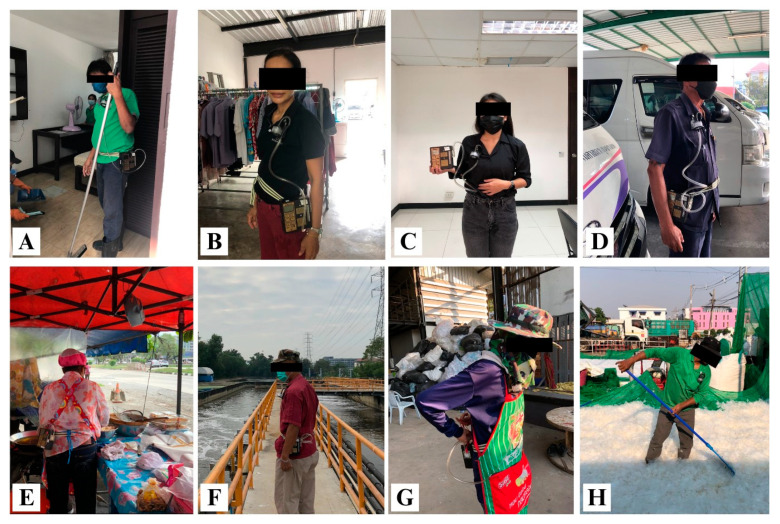
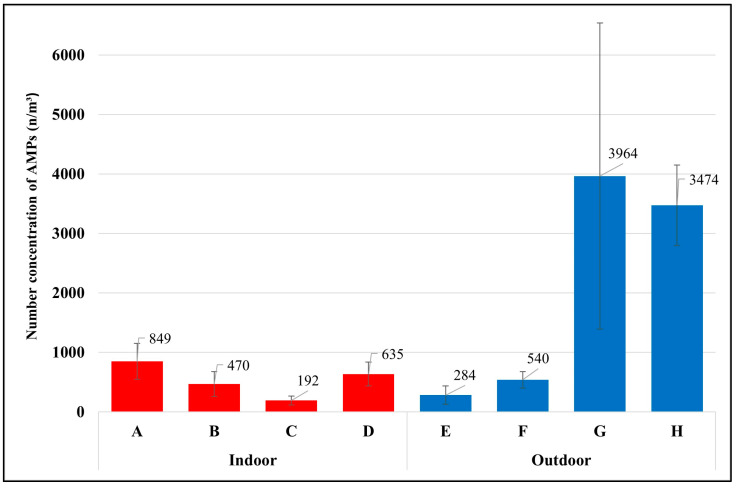
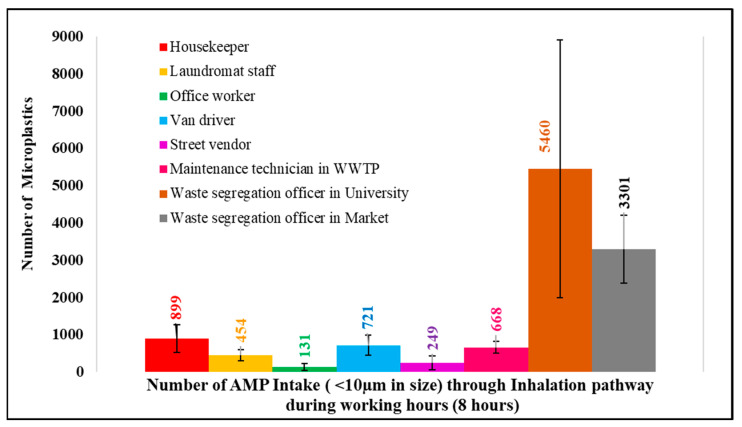
This study used personal air samplers to assess the concentration of airborne microplastics exposed by different occupational groups during their working hours. The personal air sampler was placed in the “breathing zone” of the worker during working hours to collect microplastic exposure data. Occupations examined included housekeepers, laundromat staff, office workers, van drivers, street vendors, maintenance technicians in wastewater treatment plants, and waste segregation officers in the university and market. The level of airborne microplastic exposure was found to be influenced by the daily activities and environmental conditions of the workplace. Waste segregation officers in the university and market exhibited the highest levels of exposure to airborne microplastics, at 3964 ± 2575 microplastics per cubic meter (n/m3) and 3474 ± 678 n/m3, respectively. Further analysis focused on airborne microplastics less than 10 µm in size which can be taken in through inhalation. During the 8 h working period, the waste segregation officer in the university recorded the highest 10 µm airborne microplastic intake, at 5460 pieces, followed by the waste segregation officer in the market at 3301 pieces, housekeepers at 899 pieces, van drivers at 721 pieces, maintenance technicians in WWTPs at 668 pieces, laundromat staff at 454 pieces, street vendors at 249 pieces, and office workers at 131 pieces.
Checked 2026-11-12 · 2 references not checked yet
Overview
AI snapshot
Written from the paper’s full text.
TL;DR
This study used personal air samplers to assess airborne microplastic exposure among eight occupational groups in Pathum Thani, Thailand, during working hours. Waste segregation officers had the highest exposure concentrations and estimated inhalation intake of microplastics <10 µm, while office workers had the lowest.
Key findings
- Waste segregation officers at the university and market had the highest airborne microplastic concentrations, at 3964 ± 2575 n/m³ and 3474 ± 678 n/m³, respectively; office workers had the lowest at 192 ± 73 n/m³.
- During the 8 h working period, estimated intake of microplastics <10 µm was highest for the university waste segregation officer (5460 pieces), followed by the market waste segregation officer (3301), housekeeper (899), van driver (721), WWTP maintenance technician (668), laundromat staff (454), street vendor (249), and office worker (131).
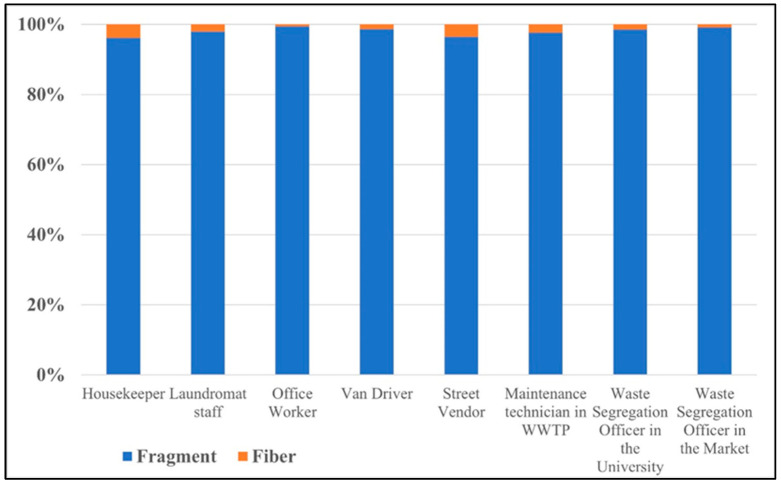
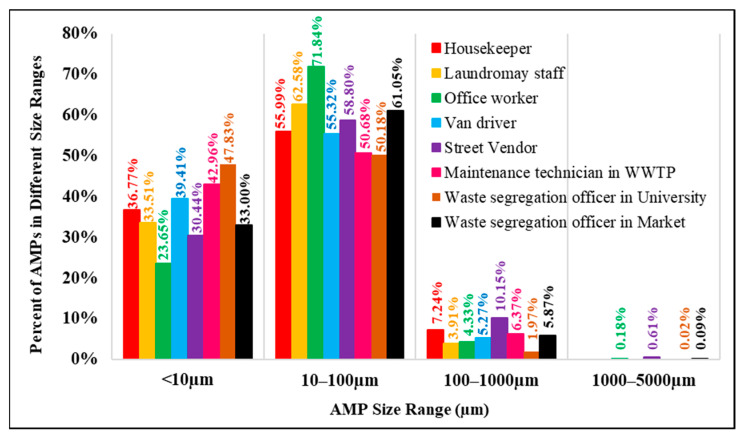
- Fragment-shaped microplastics accounted for 96.2%–99.5% of total airborne microplastics, while fibers accounted for 0.5%–3.8%; microplastics sized 10–100 µm dominated exposure (50.2%–71.8%), followed by <10 µm (23.6%–47.8%).
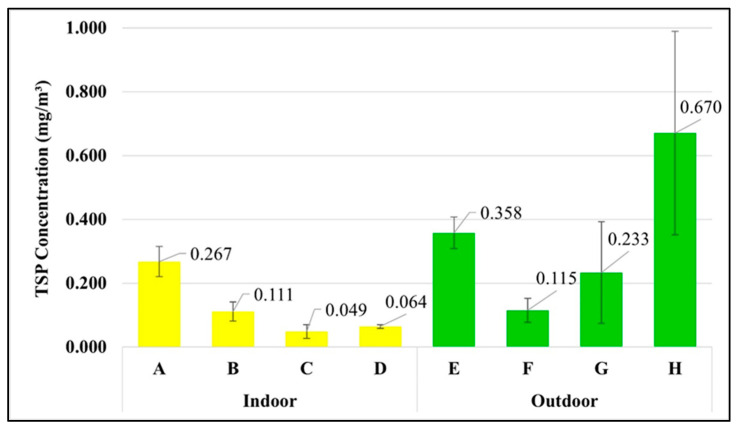
- The market waste segregation officer had the highest TSP exposure at 0.670 ± 0.319 mg/m³; all occupational TSP exposures complied with the OSHA 8 h permissible exposure limit of 15 mg/m³.
Methods
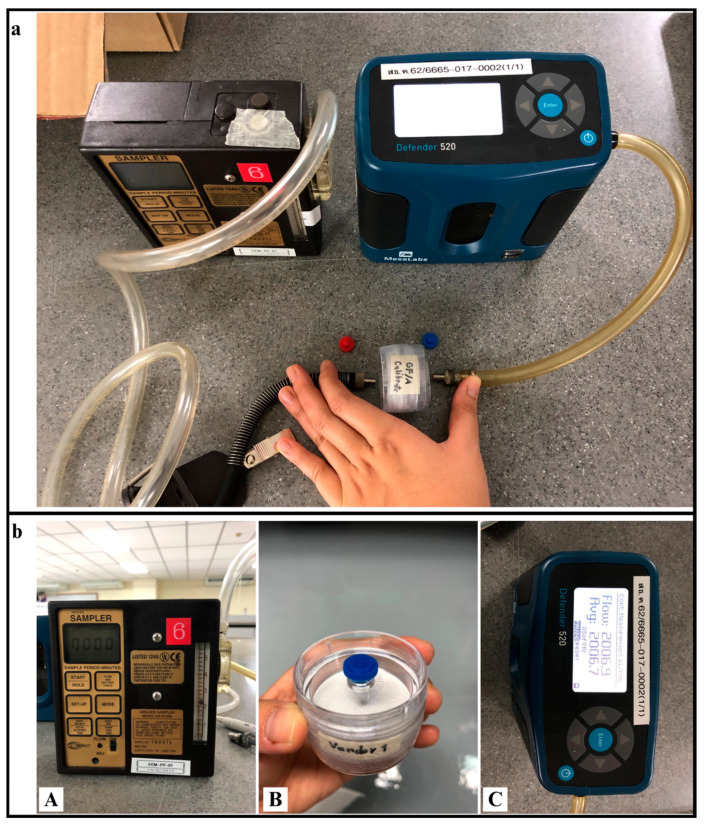
- Personal air samplers were placed in workers’ breathing zones and operated at 2 L/min for 8 h following NIOSH0500; three samples were collected per occupational group during December 2022–February 2023 (dry season) across eight indoor and outdoor workplaces.
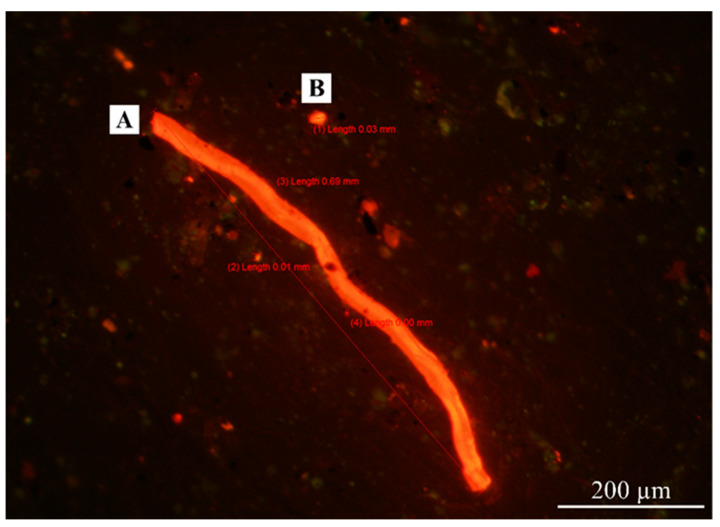
- Filters were analyzed gravimetrically for TSP, stained with Nile Red, inspected by fluorescence microscopy for shape and size ranges (<10 µm, 10–100 µm, 100–1000 µm, >1000 µm), and selected samples were analyzed by ATR-FTIR for polymer type.
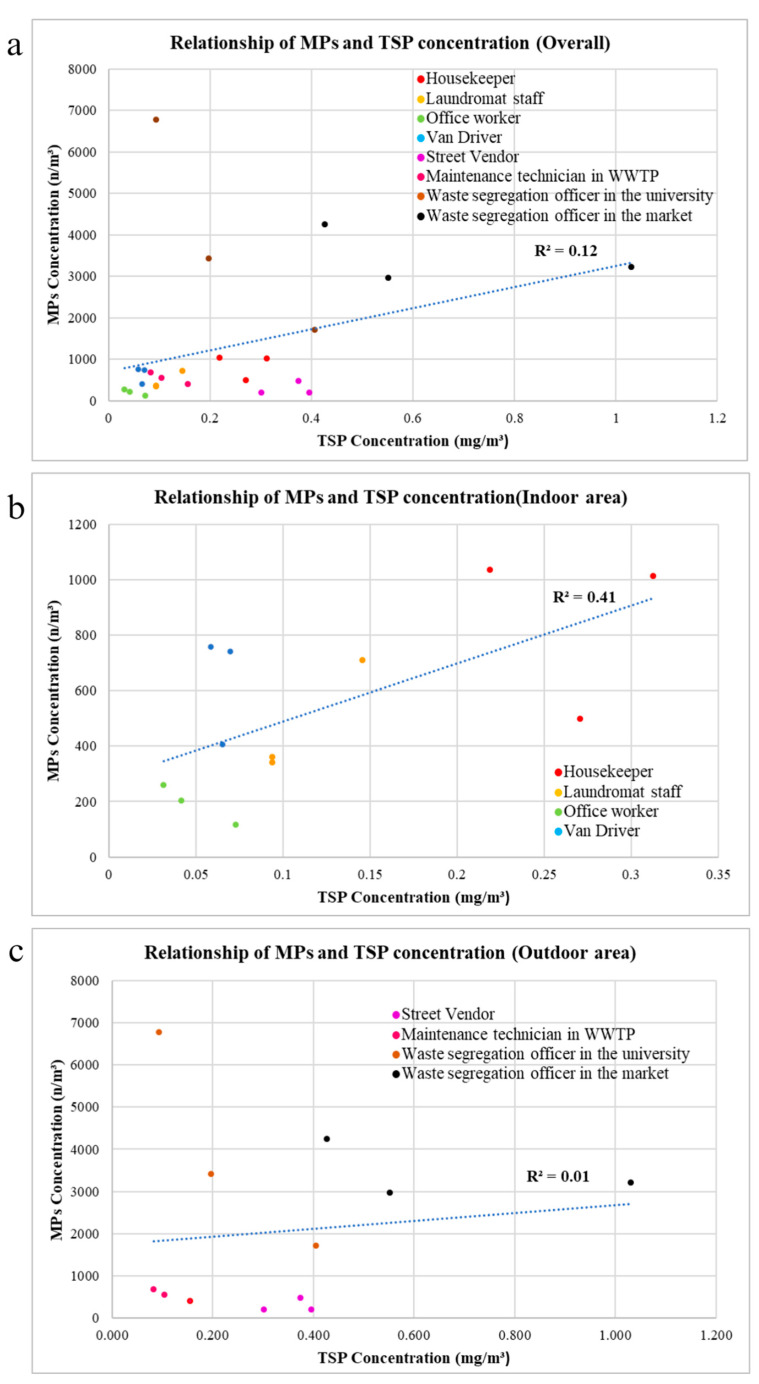
- Pearson correlation in SPSS was used to assess relationships between airborne microplastic concentrations and TSP or meteorological parameters.
Limitations
- Stated: environmental conditions were recorded only at the start of each sample collection, so more samples and environmental conditions are needed to investigate their effects on airborne microplastic concentrations.
- Stated: ATR-FTIR has a minimum detectable plastic size of approximately 10 µm, with significantly reduced accuracy for samples <50 µm; light scattering also challenged classification of non-fiber shapes, so other shapes were categorized as fragments.
- Evident from the text: only three samples were collected per occupational group, sampling was limited to one dry-season period, and the authors note that results could not be compared with prior studies because no prior research on airborne microplastic exposure was available.
Model-written summary. Check it against the paper before relying on it.
Integrity signals
Registry
Cites
Statistics
Figures
Verification
Claims the paper makes
35 Own result · 11 No full text of the sources · 9 Check pending · 6 Own interpretation · 3 Own method
A result the paper states — it cites no source for it, so there is none to check. The quote shows it is in the paper.
In the paper
“The two groups of waste segregation officers had the highest exposure to airborne microplastics because of their daily activities of working to process plastic waste.”
§ Exploring Personal Exposure to Airborne Microplastics across Various Work Environments in Pathum Thani Province, Thailand > 3. Results > 3.1. Concentration of AMPs in Different Occupational (Sample) Groups
plainstates a cause- Asserted: passes — The authors put it forward as true.
- Checkable: passes — It can be checked against evidence.
- Load-bearing: unclear — It is unclear whether the paper’s conclusions depend on it.
- Based: passes — The paper gives a reason why it holds.
A result the paper reports from its own data — it cites no other source for it, so there is none to check. The quote shows it is in the paper.
In the paper
“Waste segregation officers in the university and market exhibited the highest levels of exposure to airborne microplastics, at 3964 ± 2575 microplastics per cubic meter (n/m3) and 3474 ± 678 n/m3, respectively.”
- Also stated in: § 3.1. Concentration of AMPs in Different Occupational (Sample) Groups · plain
“The highest level of exposure to airborne microplastics was found with the waste segregation officer in the university, with 3964 ± 2575 microplastics per cubic meter (n/m3), and the waste segregation officer in the market (3474 ± 678 n/m3)”
§ Exploring Personal Exposure to Airborne Microplastics across Various Work Environments in Pathum Thani Province, Thailand > Abstract
plain- Asserted: passes — The authors put it forward as true.
- Checkable: passes — It can be checked against evidence.
- Load-bearing: passes — The paper’s conclusions depend on it.
- Based: passes — The paper gives a reason why it holds.
- Rests on an assumption: The personal air sampler placed in the breathing zone collects representative microplastic exposure data for the worker's working hours.
- Rests on an assumption: The dry season sampling period is representative of typical exposure.
- Also stated in: § 3.1. Concentration of AMPs in Different Occupational (Sample) Groups · plain
A result the paper reports from its own data — it cites no other source for it, so there is none to check. The quote shows it is in the paper.
In the paper
“which was lower than the average exposure of the indoor occupations (536 n/m3).”
§ Exploring Personal Exposure to Airborne Microplastics across Various Work Environments in Pathum Thani Province, Thailand > 3. Results > 3.1. Concentration of AMPs in Different Occupational (Sample) Groups
plain- Asserted: passes — The authors put it forward as true.
- Checkable: passes — It can be checked against evidence.
- Load-bearing: unclear — It is unclear whether the paper’s conclusions depend on it.
- Based: passes — The paper gives a reason why it holds.
A result the paper states — it cites no source for it, so there is none to check. The quote shows it is in the paper.
In the paper
“the average exposure of the outdoor occupations without waste segregation officers became 412 n/m3”
§ Exploring Personal Exposure to Airborne Microplastics across Various Work Environments in Pathum Thani Province, Thailand > 3. Results > 3.1. Concentration of AMPs in Different Occupational (Sample) Groups
plain- Asserted: passes — The authors put it forward as true.
- Checkable: passes — It can be checked against evidence.
- Load-bearing: unclear — It is unclear whether the paper’s conclusions depend on it.
- Based: passes — The paper gives a reason why it holds.
A result the paper reports from its own data — it cites no other source for it, so there is none to check. The quote shows it is in the paper.
In the paper
“A weak positive correlation (r = 0.33) was observed between the number concentration of airborne microplastics and temperature in all samples”
§ Exploring Personal Exposure to Airborne Microplastics across Various Work Environments in Pathum Thani Province, Thailand > 3. Results > 3.1. Concentration of AMPs in Different Occupational (Sample) Groups
plainstates an association- Asserted: passes — The authors put it forward as true.
- Checkable: passes — It can be checked against evidence.
- Load-bearing: unclear — It is unclear whether the paper’s conclusions depend on it.
- Based: passes — The paper gives a reason why it holds.
A result the paper states — it cites no source for it, so there is none to check. The quote shows it is in the paper.
In the paper
“These workers were working very close to the plastic blender (airborne microplastic source).”
§ Exploring Personal Exposure to Airborne Microplastics across Various Work Environments in Pathum Thani Province, Thailand > 3. Results > 3.1. Concentration of AMPs in Different Occupational (Sample) Groups
plain- Asserted: passes — The authors put it forward as true.
- Checkable: passes — It can be checked against evidence.
- Load-bearing: passes — The paper’s conclusions depend on it.
- Based: passes — The paper gives a reason why it holds.
A result the paper reports from its own data — it cites no other source for it, so there is none to check. The quote shows it is in the paper.
In the paper
“workers have higher exposure to fragment-shaped microplastics than fiber-shaped microplastics”
§ Exploring Personal Exposure to Airborne Microplastics across Various Work Environments in Pathum Thani Province, Thailand > 5. Conclusions
plainstates an association- Asserted: passes — The authors put it forward as true.
- Checkable: passes — It can be checked against evidence.
- Load-bearing: passes — The paper’s conclusions depend on it.
- Based: passes — The paper gives a reason why it holds.
A result the paper reports from its own data — it cites no other source for it, so there is none to check. The quote shows it is in the paper.
In the paper
“four types of polymers, i.e., PET, PES, SAN, and cellophane, were found in the indoor area”
§ Exploring Personal Exposure to Airborne Microplastics across Various Work Environments in Pathum Thani Province, Thailand > 5. Conclusions
plain- Asserted: passes — The authors put it forward as true.
- Checkable: passes — It can be checked against evidence.
- Load-bearing: unclear — It is unclear whether the paper’s conclusions depend on it.
- Based: passes — The paper gives a reason why it holds.
A result the paper reports from its own data — it cites no other source for it, so there is none to check. The quote shows it is in the paper.
In the paper
“The plastic types of SAN, PES, and cellophane were detected in the van driver sample.”
§ Exploring Personal Exposure to Airborne Microplastics across Various Work Environments in Pathum Thani Province, Thailand > 3. Results > 3.4. Type of AMPs at Difference Workplaces
plainSingle case- Asserted: passes — The authors put it forward as true.
- Checkable: passes — It can be checked against evidence.
- Load-bearing: unclear — It is unclear whether the paper’s conclusions depend on it.
- Based: passes — The paper gives a reason why it holds.
A result the paper reports from its own data — it cites no other source for it, so there is none to check. The quote shows it is in the paper.
In the paper
“PET, PES, and SAN are general polymers that were detected in both environments.”
§ Exploring Personal Exposure to Airborne Microplastics across Various Work Environments in Pathum Thani Province, Thailand > 3. Results > 3.4. Type of AMPs at Difference Workplaces
plain- Asserted: passes — The authors put it forward as true.
- Checkable: passes — It can be checked against evidence.
- Load-bearing: unclear — It is unclear whether the paper’s conclusions depend on it.
- Based: passes — The paper gives a reason why it holds.
- Probably not a substantial claim. 15
- It may state two separate claims as one. 16
- The quote only partly states this claim. 1
A result the paper reports from its own data — it cites no other source for it, so there is none to check. The quote shows it is in the paper.
In the paper
“The average temperature of all sample groups was 25 ± 3.7 °C, with a maximum of 31 °C and a minimum of 18 °C”
§ Exploring Personal Exposure to Airborne Microplastics across Various Work Environments in Pathum Thani Province, Thailand > 3. Results > 3.1. Concentration of AMPs in Different Occupational (Sample) Groups
plain- Asserted: passes — The authors put it forward as true.
- Checkable: passes — It can be checked against evidence.
- Load-bearing: fails — The paper’s conclusions may not depend on it.
- Based: passes — The paper gives a reason why it holds.
Probably not a substantial claim. The paper’s conclusions may not depend on it. It may state two separate claims as one.
A result the paper reports from its own data — it cites no other source for it, so there is none to check. The quote shows it is in the paper.
In the paper
“The highest level of exposure to airborne microplastics was found with the waste segregation officer in the university, with 3964 ± 2575 microplastics per cubic meter (n/m3), and the waste segregation officer in the market (3474 ± 678 n/m3), followed by the housekeeper (849 ± 303 n/m3), van driver (635 ± 199 n/m3), maintenance technician in WWTPs (540 ± 136 n/m3), laundromat staff (470 ± 206 n/m3)”
§ Exploring Personal Exposure to Airborne Microplastics across Various Work Environments in Pathum Thani Province, Thailand > 3. Results > 3.1. Concentration of AMPs in Different Occupational (Sample) Groups
plainstates an association- Asserted: passes — The authors put it forward as true.
- Checkable: passes — It can be checked against evidence.
- Load-bearing: passes — The paper’s conclusions depend on it.
- Based: passes — The paper gives a reason why it holds.
It may state two separate claims as one. The quote only partly states this claim.
- Rests on an assumption: The personal air sampler placed in the breathing zone collects representative microplastic exposure data for the worker's working hours.
- Rests on an assumption: The dry season sampling period is representative of typical exposure.
A result the paper reports from its own data — it cites no other source for it, so there is none to check. The quote shows it is in the paper.
In the paper
“During the 8 h working period, the waste segregation officer in the university recorded the highest 10 µm airborne microplastic intake, at 5460 pieces, followed by the waste segregation officer in the market at 3301 pieces, housekeepers at 899 pieces, van drivers at 721 pieces, maintenance technicians in WWTPs at 668 pieces, laundromat staff at 454 pieces, street vendors at 249 pieces, and office”
§ Exploring Personal Exposure to Airborne Microplastics across Various Work Environments in Pathum Thani Province, Thailand > Abstract
plain- Asserted: passes — The authors put it forward as true.
- Checkable: passes — It can be checked against evidence.
- Load-bearing: passes — The paper’s conclusions depend on it.
- Based: passes — The paper gives a reason why it holds.
It may state two separate claims as one.
- Rests on an assumption: The personal air sampler placed in the breathing zone collects representative microplastic exposure data for the worker's working hours.
- Rests on an assumption: The dry season sampling period is representative of typical exposure.
A result the paper reports from its own data — it cites no other source for it, so there is none to check. The quote shows it is in the paper.
In the paper
“the waste segregation officer in the university had a microplastic intake of 5460 pieces during working time, followed by the waste segregation officer in the market (3301 pieces) > the housekeeper (899 pieces) > the van driver (721 pieces) > the maintenance technician in WWTPs (668 pieces) > the laundromat staff (454 pieces) > the street vendor (249 pieces) > the office worker (131 pieces).”
§ Exploring Personal Exposure to Airborne Microplastics across Various Work Environments in Pathum Thani Province, Thailand > 5. Conclusions
plain- Asserted: passes — The authors put it forward as true.
- Checkable: passes — It can be checked against evidence.
- Load-bearing: passes — The paper’s conclusions depend on it.
- Based: passes — The paper gives a reason why it holds.
It may state two separate claims as one.
A result the paper reports from its own data — it cites no other source for it, so there is none to check. The quote shows it is in the paper.
In the paper
“Figure 6 shows that airborne microplastics with a size of 10 µm–100 µm dominated the total microplastics in our study; all workers were exposed to microplastics in this size range, accounting for 50.2% to 71.8% of all AMP exposure.”
§ Exploring Personal Exposure to Airborne Microplastics across Various Work Environments in Pathum Thani Province, Thailand > 3. Results > 3.3. Size of AMPs in Difference Workplaces
plain- Asserted: passes — The authors put it forward as true.
- Checkable: passes — It can be checked against evidence.
- Load-bearing: unclear — It is unclear whether the paper’s conclusions depend on it.
- Based: passes — The paper gives a reason why it holds.
It may state two separate claims as one.
A result the paper reports from its own data — it cites no other source for it, so there is none to check. The quote shows it is in the paper.
In the paper
“The second rank is airborne microplastics with a size of less than 10 µm, to which different groups are exposed from 23.6% to 47.8% of total AMP exposure.”
§ Exploring Personal Exposure to Airborne Microplastics across Various Work Environments in Pathum Thani Province, Thailand > 3. Results > 3.3. Size of AMPs in Difference Workplaces
plain- Asserted: passes — The authors put it forward as true.
- Checkable: passes — It can be checked against evidence.
- Load-bearing: unclear — It is unclear whether the paper’s conclusions depend on it.
- Based: passes — The paper gives a reason why it holds.
It may state two separate claims as one.
What the paper did — it cites no source for this, so there is none to check. The quote shows it is in the paper.
In the paper
“For the reliability of the data collection among different sample groups, this study collected samples three times from each occupational group (on different days of the week in the same week).”
§ Exploring Personal Exposure to Airborne Microplastics across Various Work Environments in Pathum Thani Province, Thailand > 2. Materials and Methods > 2.2. Sampling Method
plain- Asserted: passes — The authors put it forward as true.
- Checkable: passes — It can be checked against evidence.
- Load-bearing: passes — The paper’s conclusions depend on it.
- Based: passes — The paper gives a reason why it holds.
Probably not a substantial claim.
In the paper
“It proves helpful in identifying concealed microplastics and serves as a valuable preliminary step before further analysis using a fluorescence microscope.”
§ Exploring Personal Exposure to Airborne Microplastics across Various Work Environments in Pathum Thani Province, Thailand > 2. Materials and Methods > 2.3. Microplastic Identification Method
What the sources say
- Check pendingcites [12] Kang, H., Park, S., Lee, B., Ahn, J., and Kim, S. (2020). Modification of a Nile red staining method for microplastics analysis: A nile red plate method. Water, 12. source
- Not checked — no full text of the sourcecites [13] Fischer, 2016, Microplastic pollution in lakes and lake shoreline sediments—A case study on Lake Bolsena and Lake Chiusi (central Italy), Environ. Pollut. source
- Not matchedcites [14] Tamminga, 2017, Nile red staining as a subsidiary method for microplastic quantification: A comparison of three solvents and factors influencing application reliability, SDRP J. Earth Sci. Environ. Stud.
Couldn’t be matched to a paper in Crossref, so it can’t be checked.
plain- Asserted: passes — The authors put it forward as true.
- Checkable: passes — It can be checked against evidence.
- Load-bearing: fails — The paper’s conclusions may not depend on it.
- Based: passes — The paper gives a reason why it holds.
Probably not a substantial claim. The paper’s conclusions may not depend on it. It may state two separate claims as one.
In the paper
“The Nile Red staining technique (NR-S), involving the use of Nile Red (NR) dye to stain polymer particles, is a widely employed method for analyzing airborne microplastics (AMPs) in environmental samples [12,13,14].”
§ Exploring Personal Exposure to Airborne Microplastics across Various Work Environments in Pathum Thani Province, Thailand > 2. Materials and Methods > 2.3. Microplastic Identification Method
What the sources say
- Check pendingcites [12] Kang, H., Park, S., Lee, B., Ahn, J., and Kim, S. (2020). Modification of a Nile red staining method for microplastics analysis: A nile red plate method. Water, 12. source
- Not checked — no full text of the sourcecites [13] Fischer, 2016, Microplastic pollution in lakes and lake shoreline sediments—A case study on Lake Bolsena and Lake Chiusi (central Italy), Environ. Pollut. source
- Not matchedcites [14] Tamminga, 2017, Nile red staining as a subsidiary method for microplastic quantification: A comparison of three solvents and factors influencing application reliability, SDRP J. Earth Sci. Environ. Stud.
Couldn’t be matched to a paper in Crossref, so it can’t be checked.
plain- Asserted: passes — The authors put it forward as true.
- Checkable: passes — It can be checked against evidence.
- Load-bearing: fails — The paper’s conclusions may not depend on it.
- Based: passes — The paper gives a reason why it holds.
Probably not a substantial claim. The paper’s conclusions may not depend on it.
In the paper
“Additionally, airborne microplastics themselves possess physical mechanisms that can lead to toxicity in humans [8].”
§ Exploring Personal Exposure to Airborne Microplastics across Various Work Environments in Pathum Thani Province, Thailand > 1. Introduction
What the sources say
- Not checked — no full text of the sourcecites [8] Law, 1990, Solubility of polymeric organic fibers and manmade vitreous fibers in gambles solution, Inhal. Toxicol. source
plainstates a cause- Asserted: passes — The authors put it forward as true.
- Checkable: passes — It can be checked against evidence.
- Load-bearing: fails — The paper’s conclusions may not depend on it.
- Based: passes — The paper gives a reason why it holds.
Probably not a substantial claim. The paper’s conclusions may not depend on it.
In the paper
“Moreover, airborne microplastics, particularly in urban areas where metals and polycyclic aromatic hydrocarbons (PAHs) are generated from various emission sources, can absorb toxic pollutants on their hydrophobic surfaces [7].”
§ Exploring Personal Exposure to Airborne Microplastics across Various Work Environments in Pathum Thani Province, Thailand > 1. Introduction
What the sources say
- Not checked — no full text of the sourcecites [7] Endo, 2013, Desorption kinetics of hydrophobic organic contaminants from marine plastic pellets, Mar. Pollut. Bull. source
plainstates a cause- Asserted: passes — The authors put it forward as true.
- Checkable: passes — It can be checked against evidence.
- Load-bearing: fails — The paper’s conclusions may not depend on it.
- Based: passes — The paper gives a reason why it holds.
Probably not a substantial claim. The paper’s conclusions may not depend on it.
In the paper
“The atmosphere is one of the pathways in which microplastic pollutants exist as it is evident that microplastic fibers have been found in outdoor and indoor air [4,5].”
§ Exploring Personal Exposure to Airborne Microplastics across Various Work Environments in Pathum Thani Province, Thailand > 1. Introduction
What the sources say
- Not checked — no full text of the sourcecites [4] Gasperi, 2018, Microplastics in air: Are we breathing it in?, Curr. Opin. Environ. Sci. Health source
- Check pendingcites [5] Sarathana, D., and Winijkul, E. (2023). Concentrations of Airborne Microplastics during the Dry Season at Five Locations in Bangkok Metropolitan Region, Thailand. Atmosphere, 14. source
plain- Asserted: passes — The authors put it forward as true.
- Checkable: passes — It can be checked against evidence.
- Load-bearing: passes — The paper’s conclusions depend on it.
- Based: passes — The paper gives a reason why it holds.
It may state two separate claims as one.
In the paper
“Additionally, there is supporting evidence that all polymeric particles are smaller than 5.5 µm in size, and fibers with lengths ranging from 8.12 to 16.8 µm have been observed in human lung tissue [6].”
§ Exploring Personal Exposure to Airborne Microplastics across Various Work Environments in Pathum Thani Province, Thailand > 1. Introduction
What the sources say
- Not checked — no full text of the sourcecites [6] Ando, 2021, Presence of airborne microplastics in human lung tissue, J. Hazard. Mater. source
plain- Asserted: passes — The authors put it forward as true.
- Checkable: passes — It can be checked against evidence.
- Load-bearing: fails — The paper’s conclusions may not depend on it.
- Based: passes — The paper gives a reason why it holds.
Probably not a substantial claim. The paper’s conclusions may not depend on it. It may state two separate claims as one.
In the paper
“Prata (2018) investigated diseases found in workers from three types of industries—synthetic textile, flocking, and polyvinyl chloride industries—and reported symptoms among workers such as throat irritation, shortness of breath, cough, and chest pain. These symptoms, along with signs of chronic inflammation and irritation, may lead to lung fibrosis or even cancer [9,10].”
§ Exploring Personal Exposure to Airborne Microplastics across Various Work Environments in Pathum Thani Province, Thailand > 1. Introduction
What the sources say
hedgedstates a possible cause- Asserted: passes — The authors put it forward as true.
- Checkable: passes — It can be checked against evidence.
- Load-bearing: fails — The paper’s conclusions may not depend on it.
- Based: passes — The paper gives a reason why it holds.
Probably not a substantial claim. The paper’s conclusions may not depend on it. It may state two separate claims as one.
In the paper
“These substances have the potential to be harmful to human health, causing mutations, carcinogenic effects, and reproductive toxicity [4].”
§ Exploring Personal Exposure to Airborne Microplastics across Various Work Environments in Pathum Thani Province, Thailand > 1. Introduction
What the sources say
- Not checked — no full text of the sourcecites [4] Gasperi, 2018, Microplastics in air: Are we breathing it in?, Curr. Opin. Environ. Sci. Health source
hedgedstates a possible cause- Asserted: passes — The authors put it forward as true.
- Checkable: passes — It can be checked against evidence.
- Load-bearing: fails — The paper’s conclusions may not depend on it.
- Based: passes — The paper gives a reason why it holds.
Probably not a substantial claim. The paper’s conclusions may not depend on it. It may state two separate claims as one.
In the paper
“Some microplastics can evade the mucociliary clearance mechanisms of the lung, and they can be deposited in the respiratory system, particularly in people with impaired clearance mechanisms [4].”
§ Exploring Personal Exposure to Airborne Microplastics across Various Work Environments in Pathum Thani Province, Thailand > 1. Introduction
What the sources say
- Not checked — no full text of the sourcecites [4] Gasperi, 2018, Microplastics in air: Are we breathing it in?, Curr. Opin. Environ. Sci. Health source
plainstates a possible cause- Asserted: passes — The authors put it forward as true.
- Checkable: passes — It can be checked against evidence.
- Load-bearing: unclear — It is unclear whether the paper’s conclusions depend on it.
- Based: passes — The paper gives a reason why it holds.
It may state two separate claims as one.
In the paper
“Microplastics, ranging in size from 1 µm to 5 mm, present a significant challenge due to their persistence in the environment and potential adverse impacts on both human health and the well-being of our ecosystems [1].”
§ Exploring Personal Exposure to Airborne Microplastics across Various Work Environments in Pathum Thani Province, Thailand > 1. Introduction
What the sources say
- Not checked — no full text of the sourcecites [1] Waring, 2018, Plastic contamination of the food chain: A threat to human health?, Maturitas source
plain- Asserted: passes — The authors put it forward as true.
- Checkable: passes — It can be checked against evidence.
- Load-bearing: fails — The paper’s conclusions may not depend on it.
- Based: passes — The paper gives a reason why it holds.
Probably not a substantial claim. The paper’s conclusions may not depend on it. It may state two separate claims as one.
In the paper
“Generally, plastic polymers in the environment take a very long time to degrade via natural accelerants [18].”
§ Exploring Personal Exposure to Airborne Microplastics across Various Work Environments in Pathum Thani Province, Thailand > 3. Results > 3.1. Concentration of AMPs in Different Occupational (Sample) Groups
What the sources say
- Not checked — no full text of the sourcecites [18] Guo, 2019, The chemical behaviors of microplastics in marine environment: A review, Mar. Pollut. Bull. source
plain- Asserted: passes — The authors put it forward as true.
- Checkable: passes — It can be checked against evidence.
- Load-bearing: fails — The paper’s conclusions may not depend on it.
- Based: passes — The paper gives a reason why it holds.
Probably not a substantial claim. The paper’s conclusions may not depend on it.
A conclusion the paper draws from its own results — it cites no other source for it, so there is none to check. The quote shows it is in the paper.
In the paper
“Microplastics with a size < 10 µm should be a concern for the impacts on human health because they can escape the mucociliary clearance mechanisms of the lung and can be deposited in the respiratory system.”
§ Exploring Personal Exposure to Airborne Microplastics across Various Work Environments in Pathum Thani Province, Thailand > 3. Results > 3.3. Size of AMPs in Difference Workplaces
plainstates a cause- Asserted: passes — The authors put it forward as true.
- Checkable: passes — It can be checked against evidence.
- Load-bearing: unclear — It is unclear whether the paper’s conclusions depend on it.
- Based: passes — The paper gives a reason why it holds.
It may state two separate claims as one.
- Rests on an assumption: Microplastics <10 µm can escape the mucociliary clearance mechanisms of the lung and can be deposited in the respiratory system.
What the paper did — it cites no source for this, so there is none to check. The quote shows it is in the paper.
In the paper
“However, it is important to note that this study recorded environmental conditions only at the start of each sample collection.”
§ Exploring Personal Exposure to Airborne Microplastics across Various Work Environments in Pathum Thani Province, Thailand > 3. Results > 3.1. Concentration of AMPs in Different Occupational (Sample) Groups
plain- Asserted: passes — The authors put it forward as true.
- Checkable: passes — It can be checked against evidence.
- Load-bearing: passes — The paper’s conclusions depend on it.
- Based: passes — The paper gives a reason why it holds.
Probably not a substantial claim.
In the paper
“only microplastics smaller than 10 µm were considered for this calculation, as these particles are breathable and can deposit in the deep respiratory system, potentially causing impacting on health [10,31,32].”
§ Exploring Personal Exposure to Airborne Microplastics across Various Work Environments in Pathum Thani Province, Thailand > 4. Discussion
What the sources say
- Not checked — no full text of the sourcecites [10] Prata, 2018, Airborne microplastics: Consequences to human health?, Environ. Pollut. source
- Not checked — no full text of the sourcecites [31] Islam, 2023, How microplastics are transported and deposited in realistic upper airways?, Phys. Fluids source
- Check pendingcites [32] Mehmood, 2022, Why is inhalation the most discriminative route of microplastics exposure?, Environ. Sci. Pollut. Res. source
plainstates a possible cause- Asserted: passes — The authors put it forward as true.
- Checkable: passes — It can be checked against evidence.
- Load-bearing: passes — The paper’s conclusions depend on it.
- Based: passes — The paper gives a reason why it holds.
It may state two separate claims as one.
A claim is checked only against the cited paper’s full text, never its abstract, and none is available for its sources.
In the paper
“which may have originated from synthetic textiles or fabric tearing [4,22].”
§ Exploring Personal Exposure to Airborne Microplastics across Various Work Environments in Pathum Thani Province, Thailand > 3. Results > 3.2. Shapes of AMPs at Difference Workplaces
What the sources say
- Not checked — no full text of the sourcecites [4] Gasperi, 2018, Microplastics in air: Are we breathing it in?, Curr. Opin. Environ. Sci. Health source
- Not checked — no full text of the sourcecites [22] Browne, 2011, Accumulation of microplastic on shorelines woldwide: Sources and sinks, Environ. Sci. Technol. source
hedgedstates a possible cause- Asserted: passes — The authors put it forward as true.
- Checkable: passes — It can be checked against evidence.
- Load-bearing: fails — The paper’s conclusions may not depend on it.
- Based: passes — The paper gives a reason why it holds.
Probably not a substantial claim. The paper’s conclusions may not depend on it.
A claim is checked only against the cited paper’s full text, never its abstract, and none is available for its sources.
In the paper
“The limitation of ATR-FTIR spectroscopy is that the minimum size of plastic that can be detected is approximately 10 µm, and the accuracy is significantly reduced for samples sized < 50 µm [23,24,25].”
§ Exploring Personal Exposure to Airborne Microplastics across Various Work Environments in Pathum Thani Province, Thailand > 3. Results > 3.4. Type of AMPs at Difference Workplaces
What the sources say
- Not checked — no full text of the sourcecites [23] Chen, 2020, An overview of analytical methods for detecting microplastics in the atmosphere, TrAC Trends Anal. Chem. source
- Not checked — no full text of the sourcecites [24] Luo, 2022, A review of analytical methods and models used in atmospheric microplastic research, Sci. Total Environ. source
- Not checked — no full text of the sourcecites [25] Shim, 2016, Identification methods in microplastic analysis: A review, Anal. Methods source
plainstates a cause- Asserted: passes — The authors put it forward as true.
- Checkable: passes — It can be checked against evidence.
- Load-bearing: unclear — It is unclear whether the paper’s conclusions depend on it.
- Based: passes — The paper gives a reason why it holds.
It may state two separate claims as one.
In the paper
“These fragment microplastics are expected to be secondary microplastics resulting from plastic material degradation or microplastic fragmentation [20,21].”
§ Exploring Personal Exposure to Airborne Microplastics across Various Work Environments in Pathum Thani Province, Thailand > 3. Results > 3.2. Shapes of AMPs at Difference Workplaces
What the sources say
- Check pendingcites [20] Boucher, J., and Friot, D. (2017). Primary Microplastics in the Oceans: A Global Evaluation of Sources, IUCN International Union for Conservation of Nature. source
- Not checked — no full text of the sourcecites [21] Cole, 2011, Microplastics as contaminants in the marine environment: A review, Mar. Pollut. Bull. source
hedgedstates a possible cause- Asserted: passes — The authors put it forward as true.
- Checkable: passes — It can be checked against evidence.
- Load-bearing: fails — The paper’s conclusions may not depend on it.
- Based: passes — The paper gives a reason why it holds.
Probably not a substantial claim. The paper’s conclusions may not depend on it.
What the paper did — it cites no source for this, so there is none to check. The quote shows it is in the paper.
In the paper
“However, the light scattering of microplastic particles under the microscope posed a challenge in classifying plastic shapes other than fibers.”
§ Exploring Personal Exposure to Airborne Microplastics across Various Work Environments in Pathum Thani Province, Thailand > 3. Results > 3.2. Shapes of AMPs at Difference Workplaces
plainstates a cause- Asserted: passes — The authors put it forward as true.
- Checkable: passes — It can be checked against evidence.
- Load-bearing: fails — The paper’s conclusions may not depend on it.
- Based: passes — The paper gives a reason why it holds.
Probably not a substantial claim. The paper’s conclusions may not depend on it.
The paper relies on this without support.
Environmental exposure to airborne microplastics has not been studied extensively, and there is limited research on the quantity of inhaled microplastics in the human body.
“Environmental exposure to airborne microplastics has not been studied extensively, and there is limited research on the quantity of inhaled microplastics in the human body.”
The paper relies on this without support.
The personal air sampler placed in the breathing zone collects representative microplastic exposure data for the worker's working hours.
“The sampling device and GF/A with micropore 1.6 µm (Figure 2) was set in the “breathing zone” of the worker.”
The paper relies on this without support.
The FTIR database match correctly identifies polymer types.
“The polymer type was determined by identifying the polymer with the strongest match in the FTIR database.”
The paper relies on this without support.
The dry season sampling period is representative of typical exposure.
“Additionally, all samples in this study were collected during the same period (dry season), during December 2022 and February 2023”
The paper relies on this without support.
Microplastics <10 µm can escape the mucociliary clearance mechanisms of the lung and can be deposited in the respiratory system.
“they can escape the mucociliary clearance mechanisms of the lung and can be deposited in the respiratory system.”
The paper relies on this without support.
Microplastics larger than 100 µm can be removed by self-cleaning mechanisms of the human body and deposition by Earth’s gravity.
“they can be removed by self-cleaning mechanisms of the human body and deposition by Earth’s gravity.”
Self-check
Percentages, sums and reported differences re-computed from the paper’s own numbers.
Rated minor: it would not touch a result — a value no result rests on, a p-value that stays on the same side of the significance level, or a conflict that is clerical, resolved elsewhere in the paper, or outside its own findings.
In the paper
“131–5460 microplastics/8 h; or simply, multiply by three to make 24 h as 26.97 × 10²–16.38 × 10³ microplastics/day”
§ Exploring Personal Exposure to Airborne Microplastics across Various Work Environments in Pathum Thani Province, Thailand > 4. Discussion
Reported 2697 · recomputed 393
Citations
Cites
Microplastics as contaminants in the marine environment: A review
Cole, M., Lindeque, P., Halsband, C., & Galloway, T. S. (2011) · Marine Pollution Bulletin · doi:10.1016/j.marpolbul.2011.09.025 · Cited by 6,023
Accumulation of microplastic on shorelines woldwide: Sources and sinks
Browne, M. A., Crump, P., Niven, S. J., Teuten, E., Tonkin, A., Galloway, T., & Thompson, R. (2011) · Environmental Science & Technology · doi:10.1021/es201811s · Cited by 4,548
Airborne microplastics: consequences to human health?
Prata, J. C. (2018) · Environmental Pollution · doi:10.1016/j.envpol.2017.11.043 · Cited by 1,852
Microplastic contamination in an urban area: a case study in Greater Paris
Dris, R., Gasperi, J., Rocher, V., Saad, M., Renault, N., & Tassin, B. (2015) · Environmental Chemistry · doi:10.1071/en14167 · Cited by 1,764
A first overview of textile fibers, including microplastics, in indoor and outdoor environments
Dris, R., Gaspéri, J., Mirande-Bret, C., Mandin, C., Guerrouache, M., Langlois, V., & Tassin, B. (2016) · Environmental Pollution · doi:10.1016/j.envpol.2016.12.013 · Cited by 1,635
Presence of airborne microplastics in human lung tissue
Amato-Lourenço, L. F., Carvalho-Oliveira, R., Júnior, G. R., dos Santos Galvão, L., Ando, R. A., & Mauad, T. (2021) · Journal of Hazardous Materials · doi:10.1016/j.jhazmat.2021.126124 · Cited by 1,329
Anthropogenic contamination of tap water, beer, and sea salt
Kosuth, M., Mason, S. A., & Wattenberg, E. V. (2018) · PLoS ONE · doi:10.1371/journal.pone.0194970 · Cited by 1,257
Atmospheric microplastic deposition in an urban environment and an evaluation of transport
Wright, S. L., Ulke, J., Font, A., Chan, K. L. A., & Kelly, F. J. (2020) · Environment International · doi:10.1016/j.envint.2019.105411 · Cited by 1,222
Microplastics in air: are we breathing it in?
Gasperi, J., Wright, S. L., Dris, R., Collard, F., Mandin, C., Guerrouache, M., Langlois, V., Kelly, F. J., & Tassin, B. (2018) · Current Opinion in Environmental Science & Health · doi:10.1016/j.coesh.2017.10.002 · Cited by 1,080
Primary microplastics in the oceans: A global evaluation of sources
Boucher, J., & Friot, D. (2017) · doi:10.2305/iucn.ch.2017.01.en · Cited by 1,023
Research works printed but not linked: 1
- Aung, H.H., Sivakumar, A., Gholami, S.K., Venkateswaran, S.P., and Gorain, B. (2019). Nanotechnology-Based Targeted Drug Delivery Systems for Lung Cancer, Academic Press.
Cited by
Sorted by citations
Two new Later Stone Age sites from the Final Pleistocene in the Falémé Valley, eastern Senegal
Ndiaye, M., Lespez, L., Tribolo, C., Rassé, M., Hadjas, I., Davidoux, S., Huysecom, É., & Douze, K. (2024) · Monash University Research Portal (Monash University) · doi:10.3929/ethz-b-000667478 · Cited by 24,230
Zheng, K., Wang, P., Lou, X., Zhou, Z., Zhou, L., Hu, Y. M., Luan, Y., Quan, C., Fang, J., Zou, H., et al. (2024) · Environmental Pollution · doi:10.1016/j.envpol.2024.125074 · Cited by 46
First evidence of microplastic inhalation among free-ranging small cetaceans
Dziobak, M. K., Fahlman, A., Wells, R. S., Takeshita, R., Smith, C. R., Gray, A., Weinstein, J. E., & Hart, L. B. (2024) · PLoS ONE · doi:10.1371/journal.pone.0309377 · Cited by 26
Suspended airborne microplastics studies in Asia
Myat, Y. N., Kongpran, J., Vattanasit, U., & Tanaka, S. (2024) · Environmental Chemistry Letters · doi:10.1007/s10311-024-01778-4 · Cited by 15
Rahim, N. N. A., Peng, P. W. Y., Shahrir, N. F., Mahiyuddin, W. R. W., Zain, S. M. S. M., & Ismail, R. (2025) · Atmosphere · doi:10.3390/atmos16050515 · Cited by 13
Wang, J., Xie, L.-G., Wu, X., Zhao, Z.-G., Lu, Y., & Sun, H.-M. (2024) · Toxicology Research · doi:10.1093/toxres/tfae205 · Cited by 12
Ding, R., Xie, Y., Xiao, T., Wang, J., Chen, Q., Li, Y., Qin, J., Shen, H., & Bian, Q. (2025) · Environment International · doi:10.1016/j.envint.2025.109936 · Cited by 12
Sikder, K., Sharma, P., Varma, J., Islam, M. S., Pierre, N., Chinnadurai, J., Gangipangi, V. K., Tsai, P., Singh, H., Ponnusamy, V. K., et al. (2026) · Comprehensive physiology · doi:10.1002/cph4.70092 · Cited by 10
Campanale, C., Barlucchi, L., Piccardi, A., Nasa, J. L., Modugno, F., Rossi, M. D., & Palumbo, L. (2026) · Building and Environment · doi:10.1016/j.buildenv.2026.114567 · Cited by 8
McErlich, C., Goddard, F. W., Aves, A., Hardacre, C. J., Evangeliou, N., Hewitt, A. J., & Revell, L. E. (2025) · Geoscientific model development · doi:10.5194/gmd-18-8827-2025 · Cited by 7
Arina, N., Hanif, N. M., Hee, Y. Y., Ayoub, A. B., Rodzi, S. N. M., Haikal, S. A., Zakaria, Y., & Latif, M. T. (2025) · Atmospheric Pollution Research · doi:10.1016/j.apr.2025.102681 · Cited by 6
Shini, S., Navaneeth, A., Pillai, S. U., Balan, B. M., Ambatt, T. P., & Mohan, M. (2025) · Environmental Quality Management · doi:10.1002/tqem.70082 · Cited by 6
Insights into the Physical Fragmentation of Plastics into Airborne Microplastics
Adotey, E., Salthammer, T., & Morawska, L. (2026) · ACS ES&T Air · doi:10.1021/acsestair.5c00431 · Cited by 3
Mićunović, M. I., Budak, I., Vukelić, D., Koprivica, D. D., Kuzmanović, M., Agarski, B., & Puškar, T. (2024) · Applied Sciences · doi:10.3390/app14125169 · Cited by 3
Bandeira, O. A., de Araújo, L. B., da Rocha, A. F., Canedo, E. C. G., Barboza, V. V., Robazza, W. D. S., Müller, G. F., Teodózio, G. C., & Robazzi, M. L. D. C. C. (2026) · International Journal of Environmental Research and Public Health · doi:10.3390/ijerph23091113 · Cited by 2
A Trial Survey on Atmospheric/Airborne Microplastics Using Micro-Raman Spectroscopy (μRaman)
Sasaki, H., Takahashi, T., Futami, M., Endo, T., HIRANO, M., & Kotake, Y. (2024) · Journal of Environmental Chemistry · doi:10.5985/jec.34.61 · Cited by 2
Vasse, G. F., Vrisekoop, N., Klazen, J. A. Z., Vonk, J. M., & Melgert, B. N. (2026) · Environmental Research · doi:10.1016/j.envres.2026.125004 · Cited by 1
Das, A., Mishra, S., Bauri, K. P., & Tripathy, B. (2026) · Discover Environment · doi:10.1007/s44274-026-00897-9 · Cited by 1
A essencialidade da enfermagem e o desafio do uso de microplásticos em hospitais
Robazzi, M. L. D. C. C., & Freitas, P. S. (2025) · Advances in Nursing and Health · doi:10.5433/anh.2025v7.id52900
Al-Ani, M., Al-Ardah, A. H., Kuna, M., Smati, Z., Mohamed, A., Sliem, M. H., & Al-Qahtani, N. H. S. (2025) · doi:10.3390/materproc2025022005
Afitijagun, I. P., Edo, G. I., Orogu, J. O., Emumejaye, K., Iwanegbe, I., Oghroro, E. E. A., Owheruo, J. O., Yousif, E. A., Jikah, A. N., Igbuku, U. A., et al. (2026) · Journal of Materials Science Materials in Engineering · doi:10.1186/s40712-026-00533-7
Occupational Exposure to Microplastics: A Scoping Review
Lamas, M., Teixeira, F., Rodrigues, F., Oliveira, M., & Fernandes, V. C. (2026) · Studies in systems, decision and control · doi:10.1007/978-3-032-02045-1_16
The Effects of Microplastics and Nanoplastics (MNPs) on Chronic Airway Inflammation
Fragkou, P. C., Harfouch, R., Majumder, S., Das, M. C., Karamya, Z. A., Demokritou, P., & Skevaki, C. L. (2026) · Environment & Health · doi:10.1021/envhealth.5c00767
Akosile, C. N. (2026) · International journal of research and scientific innovation · doi:10.51244/ijrsi.2026.1307000298
Gou, W., Xie, Y., Xia, R., Gou, P., Cao, C., Luan, F.-J., Liu, B., & Li, Y. (2026) · Cardiovascular Toxicology · doi:10.1007/s12012-026-10180-1
Zaffar, M. I., Lim, F.-L., Sethupathi, S., & Muhamad, S. N. (2026) · IOP Conference Series Earth and Environmental Science · doi:10.1088/1755-1315/1662/1/012005
Cao, L., Wu, J., Wu, M., Zhuoqing, L. I., Qiu, C., Liu, Q., & Lei, M. (2026) · Environmental Monitoring and Assessment · doi:10.1007/s10661-026-15998-4
Metadata
- Authors
- Limsiriwong, K., & Winijkul, E.
- Affiliations
- Asian Institute of Technology (TH)
- Corresponding author
- Winijkul, Ekbordin
- Venue
- International Journal of Environmental Research and Public Health
- Publisher
- MDPI AG
- Published
- 2023-12-11
- Volume
- 20
- Issue
- 24
- Pages
- 7162
- ISSN
- 1660-4601 (ISSN-L)
- PMC
- PMC10743124
- OpenAlex
- W4389547646
- Cited by
- 27
- References
- 33
- Citations by year
- 2026: 13 · 2025: 7 · 2024: 7
- FWCI
- 1.72
- Type
- journal article
- Language
- en
- Open access
- gold
- doi.org
- Licence
- Locations
- International Journal of Environmental Research and Public Health (publishedVersion, cc-by)
- PubMed Central (publishedVersion, cc-by)
- PubMed (publishedVersion)
- RePEc: Research Papers in Economics (submittedVersion)
- Topics
- Physical Sciences › Environmental Science › Pollution › Microplastics and Plastic Pollution
- Physical Sciences › Environmental Science › Health, Toxicology and Mutagenesis › Air Quality and Health Impacts
- Physical Sciences › Environmental Science › Pollution › Pharmaceutical and Antibiotic Environmental Impacts
- Keywords
- airborne microplastics, occupational exposure, personal air sampling, inhalation exposure, waste sorting, wastewater treatment plant maintenance, housekeepers, street vendors, office workers, Pathum Thani
- MeSH terms
- Microplastics, Working Conditions, Air Pollutants, Occupational, Environmental Monitoring, Humans, Plastics, Thailand, Occupational Exposure
About these checks
Registry, retraction, Cites and statistics results are computed, not judged, with one exception: a printed reference that no index lists is read once by a model before it counts as a citation error. Claims are extracted by a model and kept only when their quote appears verbatim in the text; each cited source is then checked, with a model’s help, for whether it says what the claim relies on. Those verdicts can be wrong — read the claim’s quote and the cited source before relying on one.
A language model drew the claims from the paper on 2026-11-12, under version 3 of the claim definition (model deepseek-v4.1-flash, prompt extract-v3).
A second model labelled each claim on 2026-11-12 (model jev-1.13-20260917, definition revision gold-guideline-v0.2).
Statistics and arithmetic are recomputed, not judged.
Confidence bands are shown only for fields calibrated on our annotated test set. None is calibrated yet, so no band is shown.
What counts as a claim ›How we measure confidence ›How we check this ›
Are you an author, or do you see a problem with this page? Request a review
