

The DOI matches its Crossref record; 37 of the 38 references it cites were found in a registry or an index; none of the 18 sources its claims cite is checked for support yet.
Validity of the Polar H10 Sensor for Heart Rate Variability Analysis during Resting State and Incremental Exercise in Recreational Men and Women
Open accessAbstract
Heart rate variability (HRV) is frequently applied in sport-specific settings. The rising use of freely accessible applications for its recording requires validation processes to ensure accurate data. It is the aim of this study to compare the HRV data obtained by the Polar H10 sensor chest strap device and an electrocardiogram (ECG) with the focus on RR intervals and short-term scaling exponent alpha 1 of Detrended Fluctuation Analysis (DFA a1) as non-linear metric of HRV analysis. A group of 25 participants performed an exhaustive cycling ramp with measurements of HRV with both recording systems. Average time between heartbeats (RR), heart rate (HR) and DFA a1 were recorded before (PRE), during, and after (POST) the exercise test. High correlations were found for the resting conditions (PRE: r = 0.95, rc = 0.95, ICC3,1 = 0.95, POST: r = 0.86, rc = 0.84, ICC3,1 = 0.85) and for the incremental exercise (r > 0.93, rc > 0.93, ICC3,1 > 0.93). While PRE and POST comparisons revealed no differences, significant bias could be found during the exercise test for all variables (p < 0.001). For RR and HR, bias and limits of agreement (LoA) in the Bland–Altman analysis were minimal (RR: bias of 0.7 to 0.4 ms with LoA of 4.3 to −2.8 ms during low intensity and 1.3 to −0.5 ms during high intensity, HR: bias of −0.1 to −0.2 ms with LoA of 0.3 to −0.5 ms during low intensity and 0.4 to −0.7 ms during high intensity). DFA a1 showed wider bias and LoAs (bias of 0.9 to 8.6% with LoA of 11.6 to −9.9% during low intensity and 58.1 to −40.9% during high intensity). Linear HRV measurements derived from the Polar H10 chest strap device show strong agreement and small bias compared with ECG recordings and can be recommended for practitioners. However, with respect to DFA a1, values in the uncorrelated range and during higher exercise intensities tend to elicit higher bias and wider LoA.
Overview
AI snapshot
Written from the paper’s full text.
TL;DR
In 25 recreational men and women, the Polar H10 chest strap with Elite HRV showed near-perfect agreement with a 12-channel ECG for RR and HR at rest and during incremental cycling, with small bias despite significant exercise differences. DFA a1 agreement was high but weaker, with wider bias and limits of agreement, especially at higher exercise intensities.
Key findings
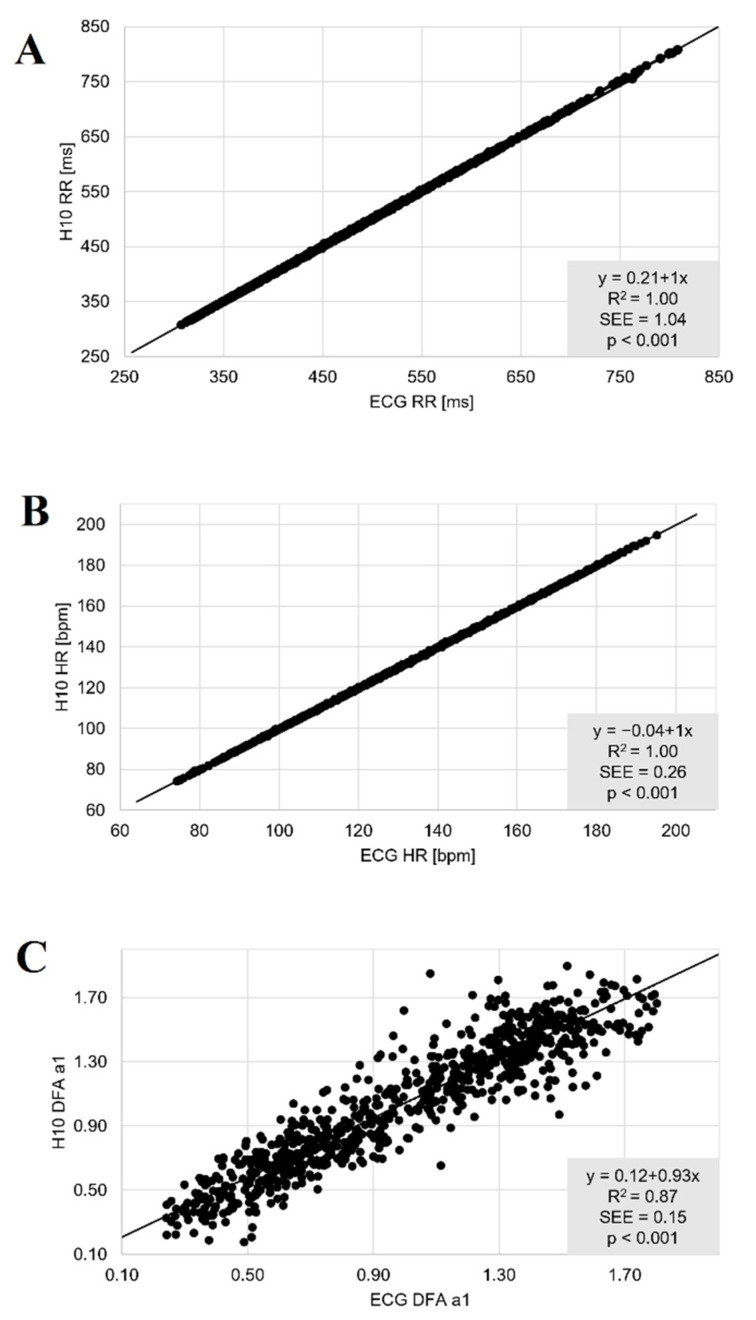
- Linear HRV measures showed near-perfect agreement: PRE/POST RR and HR had r = 1.00, rc = 1.00, ICC3,1 = 1.00, and incremental exercise also had r = 1.00, rc = 1.00, ICC3,1 = 1.00. Resting PRE/POST comparisons showed no significant differences, while exercise comparisons showed significant bias for all variables (p < 0.001).
- DFA a1 correlations were high but comparatively weaker: PRE/POST r > 0.86, rc > 0.84, ICC3,1 > 0.85; incremental exercise r > 0.93, rc > 0.93, ICC3,1 > 0.93, with significant differences during exercise (p < 0.001).
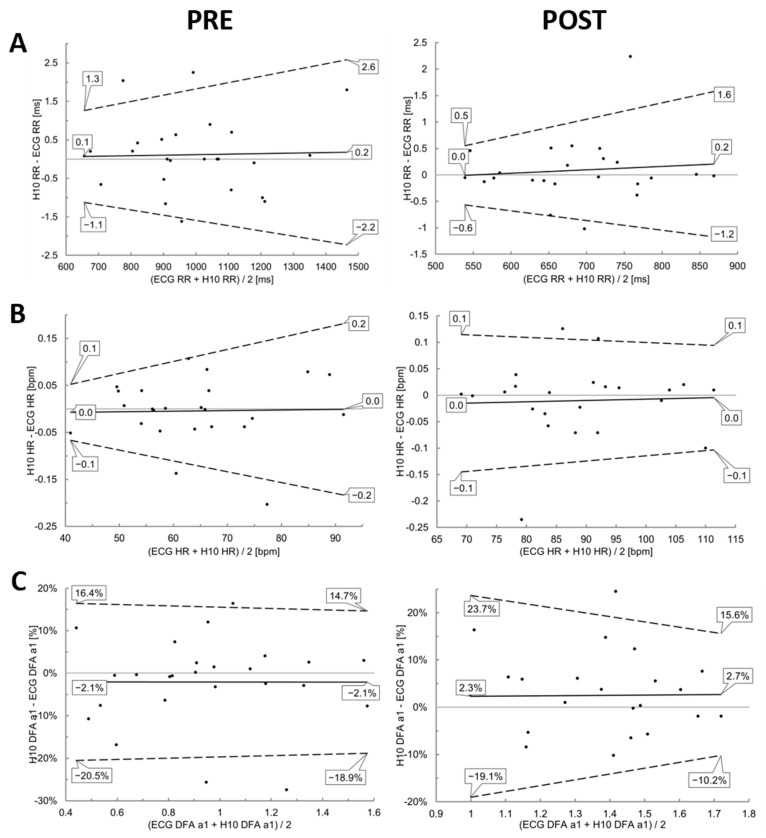
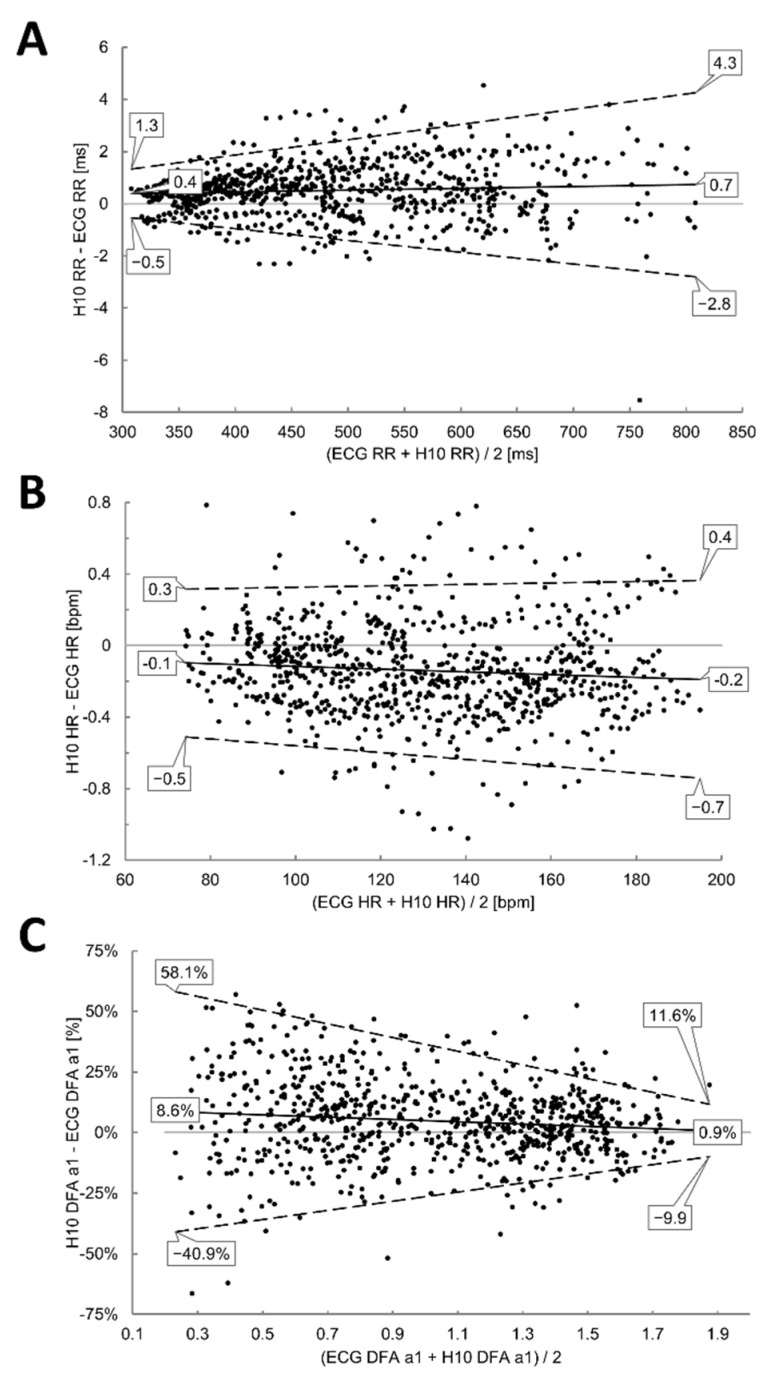
- DFA a1 bias and limits of agreement were wider than for linear measures: PRE bias −2.1%, POST bias 2.5%; during exercise, low intensity bias 0.9% with LoA 11.6 to −9.9%, and high intensity bias 8.6% with LoA 58.1 to −40.9%.
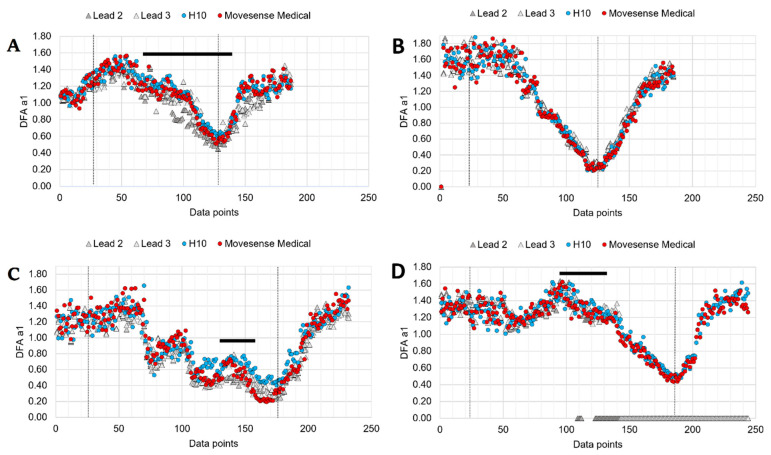
- DFA a1 index values were approximately 6% and 7.5% higher for Polar H10 at fixed values of 0.75 and 0.5 compared with ECG, so threshold boundaries were crossed at higher HRs when using Polar H10.
Methods
- Cross-sectional validation study: 25 participants (men n = 14, age 40 ± 14 years; women n = 11, age 34 ± 10 years) performed an exhaustive cycling ramp with simultaneous Polar H10/Elite HRV and 12-channel ECG recordings before (PRE), during, and after (POST) exercise.
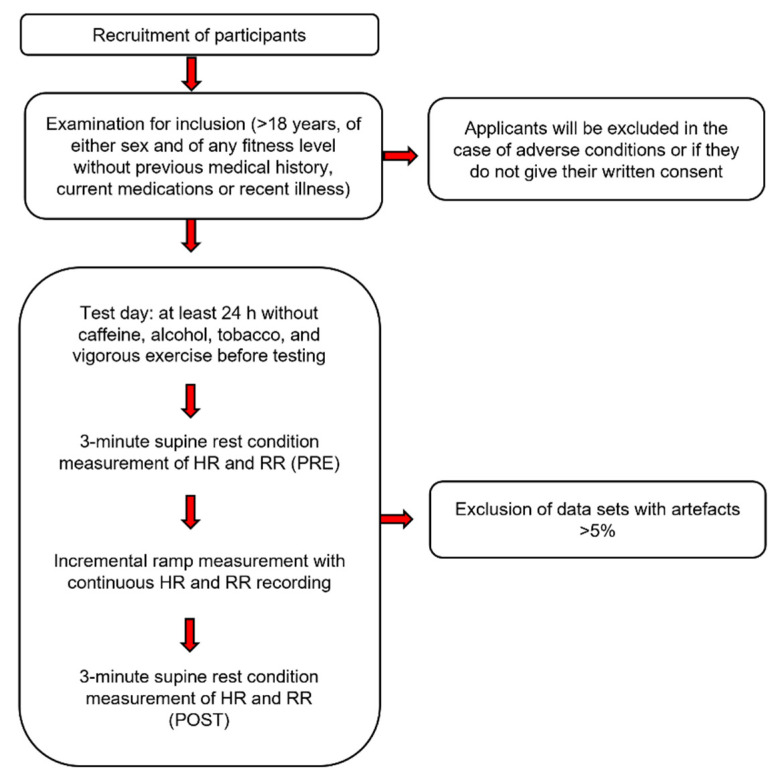
- RR, HR, and DFA a1 were analyzed in Kubios HRV Premium 3.5.0; resting analyses used a 2-min window, exercise used a 2-min moving window with 20-s grid, and datasets with artefacts >5% were excluded.
- Agreement was assessed with linear regression, Pearson’s r, Lin’s concordance correlation coefficient, ICC3,1, R², SEE, Bland–Altman LoA, paired t-test or Wilcoxon signed ranks test, and Cohen’s d, with significance at p ≤ 0.05.
Limitations
- Stated by the paper: the study did not group samples by individual personal characteristics; future studies could examine whether body composition, gender, age, or ventricular characteristics influence outcomes.
- Stated by the paper: the Polar H10 stores RR intervals but not ECG waveforms, so excessive artefacts cannot be identified or corrected, and noise cannot be differentiated from cardiac arrhythmia; five participants were excluded from exercise analysis and two from resting POST measurement due to artefacts >5%.
- Stated by the paper: raw data were analyzed with Kubios HRV Premium using automatic artefact correction, and the free standard Kubios version with threshold-based correction could yield slightly different results; the text also makes evident that device and lead placement differences prevent attributing discrepancies to a single variable.
Model-written summary. Check it against the paper before relying on it.
Integrity signals
Registry
Cites
Statistics
Figures
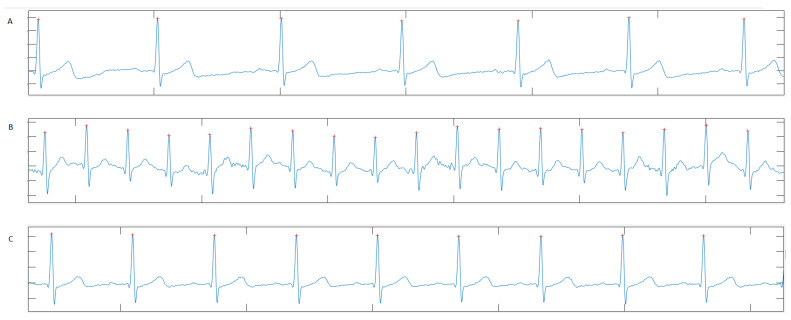
Verification
Claims the paper makes
14 Not checked yet · 14 Own result · 10 Own interpretation · 6 Own method · 2 No basis given
The paper states this without a source or data behind it here, so there is nothing to check it against. The quote shows it is in the paper.
In the paper
“However, the amount of deviation was variable, with some participants showing very close agreement between devices.”
§ Validity of the Polar H10 Sensor for Heart Rate Variability Analysis during Resting State and Incremental Exercise in Recreational Men and Women > 4. Discussions
plain- Asserted: passes — The authors put it forward as true.
- Checkable: passes — It can be checked against evidence.
- Load-bearing: unclear — It is unclear whether the paper’s conclusions depend on it.
- Based: passes — The paper gives a reason why it holds.
The paper states this without a source or data behind it here, so there is nothing to check it against. The quote shows it is in the paper.
In the paper
“Both threshold boundaries were crossed at higher HRs when using the Polar H10”
§ Validity of the Polar H10 Sensor for Heart Rate Variability Analysis during Resting State and Incremental Exercise in Recreational Men and Women > 4. Discussions
plaindirect- Asserted: passes — The authors put it forward as true.
- Checkable: passes — It can be checked against evidence.
- Load-bearing: passes — The paper’s conclusions depend on it.
- Based: passes — The paper gives a reason why it holds.
A result the paper reports from its own data — it cites no other source for it, so there is none to check. The quote shows it is in the paper.
In the paper
“and a bias of 0.2 to 0.0 ms with upper and lower LoA of 1.6 to 0.5 ms and −1.2 to −0.6 ms in POST”
§ Validity of the Polar H10 Sensor for Heart Rate Variability Analysis during Resting State and Incremental Exercise in Recreational Men and Women > 3. Results > 3.1. PRE and POST Analysis
plain- Asserted: passes — The authors put it forward as true.
- Checkable: passes — It can be checked against evidence.
- Load-bearing: unclear — It is unclear whether the paper’s conclusions depend on it.
- Based: passes — The paper gives a reason why it holds.
A result the paper reports from its own data — it cites no other source for it, so there is none to check. The quote shows it is in the paper.
In the paper
“The comparisons during resting state conditions PRE and POST showed nearly perfect correlations for the linear parameters RR and HR (r = 1.00, rc = 1.00, ICC3,1 = 1.00).”
§ Validity of the Polar H10 Sensor for Heart Rate Variability Analysis during Resting State and Incremental Exercise in Recreational Men and Women > 3. Results > 3.1. PRE and POST Analysis
plaincorrelational- Asserted: passes — The authors put it forward as true.
- Checkable: passes — It can be checked against evidence.
- Load-bearing: passes — The paper’s conclusions depend on it.
- Based: passes — The paper gives a reason why it holds.
A result the paper reports from its own data — it cites no other source for it, so there is none to check. The quote shows it is in the paper.
In the paper
“With respect to DFA a1 there was bias of −2.1% (upper LoA of 14.7 to 16.4% and lower LoA of −18.9 to −20.5%)”
§ Validity of the Polar H10 Sensor for Heart Rate Variability Analysis during Resting State and Incremental Exercise in Recreational Men and Women > 3. Results > 3.1. PRE and POST Analysis
plain- Asserted: passes — The authors put it forward as true.
- Checkable: passes — It can be checked against evidence.
- Load-bearing: unclear — It is unclear whether the paper’s conclusions depend on it.
- Based: passes — The paper gives a reason why it holds.
A result the paper reports from its own data — it cites no other source for it, so there is none to check. The quote shows it is in the paper.
In the paper
“Bland–Altman analysis revealed a mean difference of 0.2 to 0.1 ms for RR with upper LoA of 2.6 to 1.3 ms and lower LoA of −2.2 to −1.1 ms in PRE”
§ Validity of the Polar H10 Sensor for Heart Rate Variability Analysis during Resting State and Incremental Exercise in Recreational Men and Women > 3. Results > 3.1. PRE and POST Analysis
plain- Asserted: passes — The authors put it forward as true.
- Checkable: passes — It can be checked against evidence.
- Load-bearing: passes — The paper’s conclusions depend on it.
- Based: passes — The paper gives a reason why it holds.
A result the paper reports from its own data — it cites no other source for it, so there is none to check. The quote shows it is in the paper.
In the paper
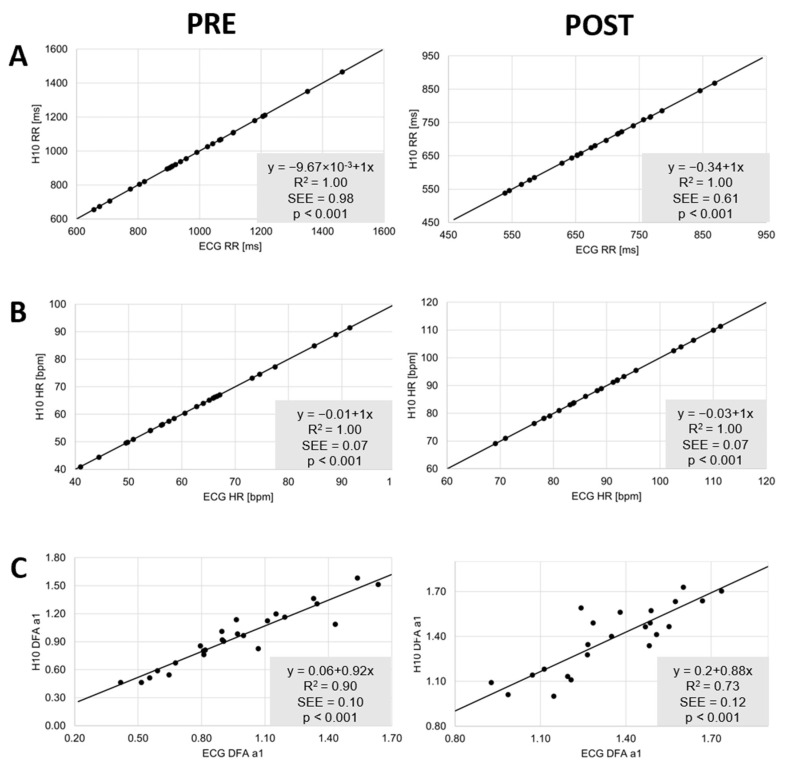
“Index values tended to be approximately 6% and 7.5% higher at the fixed values of 0.75 and 0.5 for Polar H10 in comparison to the ECG (Figure 5C)”
§ Validity of the Polar H10 Sensor for Heart Rate Variability Analysis during Resting State and Incremental Exercise in Recreational Men and Women > 4. Discussions
hedgedcorrelational- Asserted: passes — The authors put it forward as true.
- Checkable: passes — It can be checked against evidence.
- Load-bearing: passes — The paper’s conclusions depend on it.
- Based: passes — The paper gives a reason why it holds.
A result the paper reports from its own data — it cites no other source for it, so there is none to check. The quote shows it is in the paper.
In the paper
“There were no significant differences for both conditions and the three variables of interest (p > 0.05) (Table 1).”
§ Validity of the Polar H10 Sensor for Heart Rate Variability Analysis during Resting State and Incremental Exercise in Recreational Men and Women > 3. Results > 3.1. PRE and POST Analysis
plain- Asserted: passes — The authors put it forward as true.
- Checkable: passes — It can be checked against evidence.
- Load-bearing: passes — The paper’s conclusions depend on it.
- Based: passes — The paper gives a reason why it holds.
A result the paper reports from its own data — it cites no other source for it, so there is none to check. The quote shows it is in the paper.
In the paper
“and 2.5% for POST (upper LoA of 15.6 to 23.7% and lower LoA of −10.2 to −19.1%)”
§ Validity of the Polar H10 Sensor for Heart Rate Variability Analysis during Resting State and Incremental Exercise in Recreational Men and Women > 3. Results > 3.1. PRE and POST Analysis
plain- Asserted: passes — The authors put it forward as true.
- Checkable: passes — It can be checked against evidence.
- Load-bearing: unclear — It is unclear whether the paper’s conclusions depend on it.
- Based: passes — The paper gives a reason why it holds.
In the paper
“There were no differences observed in the results of the Polar H10 in comparison to the ECG when Kubios HRV software was used to obtain HRV data.”
§ Validity of the Polar H10 Sensor for Heart Rate Variability Analysis during Resting State and Incremental Exercise in Recreational Men and Women > 1. Introduction
What the sources say
- Not checked yetcites [10] Zabala, 2022, Validity and Reliability of Different Smartphones Applications to Measure HRV during Short and Ultra-Short Measurements in Elite Athletes, Comput. Methods Programs Biomed. source
plain- Asserted: passes — The authors put it forward as true.
- Checkable: passes — It can be checked against evidence.
- Load-bearing: unclear — It is unclear whether the paper’s conclusions depend on it.
- Based: passes — The paper gives a reason why it holds.
- It may state two separate claims as one. 11
- Probably not a substantial claim. 22
A result the paper reports from its own data — it cites no other source for it, so there is none to check. The quote shows it is in the paper.
In the paper
“DFA a1 showed wider bias (0.9 to 8.6%) and LoAs of 11.6 to −9.9% during low intensity and 58.1 to −40.9% during high intensity.”
§ Validity of the Polar H10 Sensor for Heart Rate Variability Analysis during Resting State and Incremental Exercise in Recreational Men and Women > 3. Results > 3.2. Incremental Exercise Analysis
plain- Asserted: passes — The authors put it forward as true.
- Checkable: passes — It can be checked against evidence.
- Load-bearing: passes — The paper’s conclusions depend on it.
- Based: passes — The paper gives a reason why it holds.
It may state two separate claims as one.
A result the paper reports from its own data — it cites no other source for it, so there is none to check. The quote shows it is in the paper.
In the paper
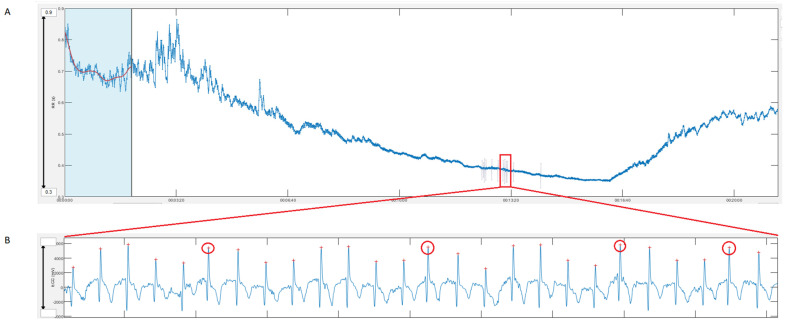
“Figure 7 illustrates this with an example of a female participant from the present study whose data during the incremental cycling ramp was excluded from validation analysis since artifact exceeded >5%. On closer examination of the parallel recorded ECG, these “artifacts” were classified as frequent atrial premature complexes (APCs)”
§ Validity of the Polar H10 Sensor for Heart Rate Variability Analysis during Resting State and Incremental Exercise in Recreational Men and Women > 4. Discussions
plaindirectSingle case- Asserted: passes — The authors put it forward as true.
- Checkable: passes — It can be checked against evidence.
- Load-bearing: fails — The paper’s conclusions may not depend on it.
- Based: passes — The paper gives a reason why it holds.
Probably not a substantial claim. The paper’s conclusions may not depend on it. It may state two separate claims as one.
A result the paper reports from its own data — it cites no other source for it, so there is none to check. The quote shows it is in the paper.
In the paper
“Although correlations were also high for DFA a1 (r > 0.86, rc > 0.84, ICC3,1 > 0.85), they were comparatively weaker”
§ Validity of the Polar H10 Sensor for Heart Rate Variability Analysis during Resting State and Incremental Exercise in Recreational Men and Women > 3. Results > 3.1. PRE and POST Analysis
plaincorrelational- Asserted: passes — The authors put it forward as true.
- Checkable: passes — It can be checked against evidence.
- Load-bearing: unclear — It is unclear whether the paper’s conclusions depend on it.
- Based: passes — The paper gives a reason why it holds.
It may state two separate claims as one.
A result the paper reports from its own data — it cites no other source for it, so there is none to check. The quote shows it is in the paper.
In the paper
“Bland–Altman plot for RR showed a mean difference of 0.7 to 0.4 ms with upper and lower LoA of 4.3 to −2.8 ms during low intensity and 1.3 to −0.5 ms during high intensity exercise.”
§ Validity of the Polar H10 Sensor for Heart Rate Variability Analysis during Resting State and Incremental Exercise in Recreational Men and Women > 3. Results > 3.2. Incremental Exercise Analysis
plain- Asserted: passes — The authors put it forward as true.
- Checkable: passes — It can be checked against evidence.
- Load-bearing: passes — The paper’s conclusions depend on it.
- Based: passes — The paper gives a reason why it holds.
It may state two separate claims as one.
A result the paper reports from its own data — it cites no other source for it, so there is none to check. The quote shows it is in the paper.
In the paper
“High correlations could be found during the incremental exercise test for the linear parameters (r = 1.00. rc = 1.00, ICC3,1 = 1.00), and DFA a1 (r > 0.93. rc > 0.93, ICC3,1 > 0.93), although with a statistically significant difference (p < 0.001)”
§ Validity of the Polar H10 Sensor for Heart Rate Variability Analysis during Resting State and Incremental Exercise in Recreational Men and Women > 3. Results > 3.2. Incremental Exercise Analysis
hedgedcorrelational- Asserted: passes — The authors put it forward as true.
- Checkable: passes — It can be checked against evidence.
- Load-bearing: passes — The paper’s conclusions depend on it.
- Based: passes — The paper gives a reason why it holds.
It may state two separate claims as one.
A result the paper reports from its own data — it cites no other source for it, so there is none to check. The quote shows it is in the paper.
In the paper
“The effects of high degrees of artifact correction are demonstrated, showing either data loss or HRV bias.”
§ Validity of the Polar H10 Sensor for Heart Rate Variability Analysis during Resting State and Incremental Exercise in Recreational Men and Women > 4. Discussions
boosteddirectn = 4- Asserted: passes — The authors put it forward as true.
- Checkable: passes — It can be checked against evidence.
- Load-bearing: unclear — It is unclear whether the paper’s conclusions depend on it.
- Based: passes — The paper gives a reason why it holds.
It may state two separate claims as one.
A result the paper reports from its own data — it cites no other source for it, so there is none to check. The quote shows it is in the paper.
In the paper
“Five participants were excluded from exercise analysis and two participants from resting POST measurement due to artefacts >5%.”
§ Validity of the Polar H10 Sensor for Heart Rate Variability Analysis during Resting State and Incremental Exercise in Recreational Men and Women > 3. Results
plaindirectn = 5- Asserted: passes — The authors put it forward as true.
- Checkable: passes — It can be checked against evidence.
- Load-bearing: fails — The paper’s conclusions may not depend on it.
- Based: passes — The paper gives a reason why it holds.
Probably not a substantial claim. The paper’s conclusions may not depend on it. It may state two separate claims as one.
None of the sources cited for this claim have been checked yet.
In the paper
“recent studies show the potential of this parameter to demarcate physiological threshold boundaries by means of fixed DFA a1 values at the aerobic (~0.75) and anaerobic threshold (~0.5) for usage in performance monitoring and exercise intensity distribution in endurance sports [16,17].”
§ Validity of the Polar H10 Sensor for Heart Rate Variability Analysis during Resting State and Incremental Exercise in Recreational Men and Women > 1. Introduction
What the sources say
- Not checked yetcites [16] Rogers, B., Giles, D., Draper, N., Mourot, L., and Gronwald, T. (2021). Detection of the Anaerobic Threshold in Endurance Sports: Validation of a New Method Using Correlation Properties of Heart Rate Variability. J. Funct. Morphol. Kinesiol., 6. source
- Not checked yetcites [17] Mateo-March, M., Moya-Ramón, M., Javaloyes, A., Sánchez-Muñoz, C., and Clemente-Suárez, V.J. (2022). Validity of Detrended Fluctuation Analysis of Heart Rate Variability to Determine Intensity Thresholds in Professional Cyclists. Eur. J. Sport Sci., 1–20. source
hedgedcorrelational- Asserted: passes — The authors put it forward as true.
- Checkable: passes — It can be checked against evidence.
- Load-bearing: passes — The paper’s conclusions depend on it.
- Based: passes — The paper gives a reason why it holds.
Probably not a substantial claim.
In the paper
“The gold standard measure for the quantification of RR intervals and assessment of HRV is the electrocardiogram (ECG) [7].”
§ Validity of the Polar H10 Sensor for Heart Rate Variability Analysis during Resting State and Incremental Exercise in Recreational Men and Women > 1. Introduction
What the sources say
- Not checked yetcites [7] Sammito, 2016, Reference Values for Time- and Frequency-Domain Heart Rate Variability Measures, Heart Rhythm. source
plain- Asserted: passes — The authors put it forward as true.
- Checkable: passes — It can be checked against evidence.
- Load-bearing: passes — The paper’s conclusions depend on it.
- Based: passes — The paper gives a reason why it holds.
Probably not a substantial claim.
In the paper
“In this report, there was a substantially better signal quality during high-intensity activities for the Polar H10 in comparison to a 3-lead ECG Holter monitor”
§ Validity of the Polar H10 Sensor for Heart Rate Variability Analysis during Resting State and Incremental Exercise in Recreational Men and Women > 1. Introduction
What the sources say
- Not checked yetcites [13] Schweizer, 2019, RR Interval Signal Quality of a Heart Rate Monitor and an ECG Holter at Rest and during Exercise, Eur. J. Appl. Physiol. source
plaincorrelationaln = 10- Asserted: passes — The authors put it forward as true.
- Checkable: passes — It can be checked against evidence.
- Load-bearing: fails — The paper’s conclusions may not depend on it.
- Based: passes — The paper gives a reason why it holds.
Probably not a substantial claim. The paper’s conclusions may not depend on it.
None of the sources cited for this claim have been checked yet.
In the paper
“However, it has become common practice to use mobile systems (e.g., apps, wearables) and chest straps for data recording, storage, analysis and/or export which offers superior practicability with respect to cost, ease to use, portability and interpretation [8,9,10].”
§ Validity of the Polar H10 Sensor for Heart Rate Variability Analysis during Resting State and Incremental Exercise in Recreational Men and Women > 1. Introduction
What the sources say
- Not checked yetcites [8] Perrotta, 2017, Validity of the Elite HRV Smartphone Application for Examining Heart Rate Variability in a Field-Based Setting, J. Strength Cond. Res. source
- Not checked yetcites [9] Dobbs, 2019, The Accuracy of Acquiring Heart Rate Variability from Portable Devices: A Systematic Review and Meta-Analysis, Sports Med. source
- Not checked yetcites [10] Zabala, 2022, Validity and Reliability of Different Smartphones Applications to Measure HRV during Short and Ultra-Short Measurements in Elite Athletes, Comput. Methods Programs Biomed. source
plain- Asserted: passes — The authors put it forward as true.
- Checkable: fails — It may be too vague to check against evidence.
- Load-bearing: fails — The paper’s conclusions may not depend on it.
- Based: passes — The paper gives a reason why it holds.
Probably not a substantial claim. It may be too vague to check against evidence. The paper’s conclusions may not depend on it.
None of the sources cited for this claim have been checked yet.
In the paper
“The non-linear short-term scaling exponent alpha 1 of Detrended Fluctuation Analysis (DFA a1) has shown its suitability to describe the complex cardiac autonomic regulation during various exercise intensities, modalities, and environmental conditions while possessing a wide dynamic range throughout all intensity zones in contrast to standard linear parameters [14,15].”
§ Validity of the Polar H10 Sensor for Heart Rate Variability Analysis during Resting State and Incremental Exercise in Recreational Men and Women > 1. Introduction
What the sources say
- Not checked yetcites [14] Gronwald, 2020, Correlation Properties of Heart Rate Variability during Endurance Exercise: A Systematic Review, Ann. Noninvasive Electrocardiol. source
- Not checked yetcites [15] Rogers, 2022, Fractal Correlation Properties of Heart Rate Variability as a Biomarker for Intensity Distribution and Training Prescription in Endurance Exercise: An Update, Front. Physiol. source
plain- Asserted: passes — The authors put it forward as true.
- Checkable: passes — It can be checked against evidence.
- Load-bearing: passes — The paper’s conclusions depend on it.
- Based: passes — The paper gives a reason why it holds.
Probably not a substantial claim. It may state two separate claims as one.
In the paper
“Additionally, exercise associated DFA a1 dynamics may also give insights about physiological status in terms of monitoring of fatigue during low-intensity exercise [18].”
§ Validity of the Polar H10 Sensor for Heart Rate Variability Analysis during Resting State and Incremental Exercise in Recreational Men and Women > 1. Introduction
What the sources say
- Not checked yetcites [18] Rogers, 2021, Fractal Correlation Properties of Heart Rate Variability as a Biomarker of Endurance Exercise Fatigue in Ultramarathon Runners, Physiol. Rep. source
hedgedconditional- Asserted: passes — The authors put it forward as true.
- Checkable: passes — It can be checked against evidence.
- Load-bearing: fails — The paper’s conclusions may not depend on it.
- Based: passes — The paper gives a reason why it holds.
Probably not a substantial claim. The paper’s conclusions may not depend on it.
In the paper
“The basic, cost-free “standard” version of Kubios HRV with an alternate threshold-based artifact correction method could lead to slightly different results than presented [24].”
§ Validity of the Polar H10 Sensor for Heart Rate Variability Analysis during Resting State and Incremental Exercise in Recreational Men and Women > 4. Discussions
What the sources say
- Not checked yetcites [24] Rogers, B., Giles, D., Draper, N., Mourot, L., and Gronwald, T. (2021). Influence of Artefact Correction and Recording Device Type on the Practical Application of a Non-Linear Heart Rate Variability Biomarker for Aerobic Threshold Determination. Sensors, 21. source
hedgedconditional- Asserted: passes — The authors put it forward as true.
- Checkable: passes — It can be checked against evidence.
- Load-bearing: fails — The paper’s conclusions may not depend on it.
- Based: passes — The paper gives a reason why it holds.
Probably not a substantial claim. The paper’s conclusions may not depend on it.
A conclusion the paper draws from its own results — it cites no other source for it, so there is none to check. The quote shows it is in the paper.
In the paper
“Hence, it is certainly plausible that some participants had either different or sub optimal signal strength using a chest strap device as opposed to ECG lead 2.”
§ Validity of the Polar H10 Sensor for Heart Rate Variability Analysis during Resting State and Incremental Exercise in Recreational Men and Women > 4. Discussions
hedgedconditional- Asserted: passes — The authors put it forward as true.
- Checkable: passes — It can be checked against evidence.
- Load-bearing: fails — The paper’s conclusions may not depend on it.
- Based: passes — The paper gives a reason why it holds.
Probably not a substantial claim. The paper’s conclusions may not depend on it.
What the paper did — it cites no source for this, so there is none to check. The quote shows it is in the paper.
In the paper
“It can be considered as a possible limitation that this study did not group the samples by their individual personal characteristics.”
§ Validity of the Polar H10 Sensor for Heart Rate Variability Analysis during Resting State and Incremental Exercise in Recreational Men and Women > 4. Discussions
hedged- Asserted: passes — The authors put it forward as true.
- Checkable: passes — It can be checked against evidence.
- Load-bearing: fails — The paper’s conclusions may not depend on it.
- Based: passes — The paper gives a reason why it holds.
Probably not a substantial claim. The paper’s conclusions may not depend on it.
In the paper
“Data sets with artefacts >5% were excluded from analysis based on [24].”
§ Validity of the Polar H10 Sensor for Heart Rate Variability Analysis during Resting State and Incremental Exercise in Recreational Men and Women > 2. Materials and Methods > 2.3. Data Processing
What the sources say
- Not checked yetcites [24] Rogers, B., Giles, D., Draper, N., Mourot, L., and Gronwald, T. (2021). Influence of Artefact Correction and Recording Device Type on the Practical Application of a Non-Linear Heart Rate Variability Biomarker for Aerobic Threshold Determination. Sensors, 21. source
plain- Asserted: passes — The authors put it forward as true.
- Checkable: passes — It can be checked against evidence.
- Load-bearing: passes — The paper’s conclusions depend on it.
- Based: passes — The paper gives a reason why it holds.
Probably not a substantial claim.
What the paper did — it cites no source for this, so there is none to check. The quote shows it is in the paper.
In the paper
“Prior to testing, the gas analyzers were calibrated according to the manufacturer’s instructions.”
§ Validity of the Polar H10 Sensor for Heart Rate Variability Analysis during Resting State and Incremental Exercise in Recreational Men and Women > 2. Materials and Methods > 2.2. Exercise Protocol and Data Acquisition
plain- Asserted: passes — The authors put it forward as true.
- Checkable: passes — It can be checked against evidence.
- Load-bearing: fails — The paper’s conclusions may not depend on it.
- Based: passes — The paper gives a reason why it holds.
Probably not a substantial claim. The paper’s conclusions may not depend on it.
A conclusion the paper draws from its own results — it cites no other source for it, so there is none to check. The quote shows it is in the paper.
In the paper
“The potential effect of lead placement (chest strap electrodes vs. ECG lead 2) is also notable in terms of DFA a1 determination.”
§ Validity of the Polar H10 Sensor for Heart Rate Variability Analysis during Resting State and Incremental Exercise in Recreational Men and Women > 4. Discussions
hedgedcorrelational- Asserted: passes — The authors put it forward as true.
- Checkable: passes — It can be checked against evidence.
- Load-bearing: fails — The paper’s conclusions may not depend on it.
- Based: fails — The paper may give no reason why it holds.
Probably not a substantial claim. The paper’s conclusions may not depend on it. The paper may give no reason why it holds.
What the paper did — it cites no source for this, so there is none to check. The quote shows it is in the paper.
In the paper
“Participants were asked to abstain from caffeine, alcohol, tobacco, and vigorous exercise 24 h before testing”
§ Validity of the Polar H10 Sensor for Heart Rate Variability Analysis during Resting State and Incremental Exercise in Recreational Men and Women > 2. Materials and Methods > 2.1. Participants
plain- Asserted: passes — The authors put it forward as true.
- Checkable: passes — It can be checked against evidence.
- Load-bearing: fails — The paper’s conclusions may not depend on it.
- Based: passes — The paper gives a reason why it holds.
Probably not a substantial claim. The paper’s conclusions may not depend on it.
A conclusion the paper draws from its own results — it cites no other source for it, so there is none to check. The quote shows it is in the paper.
In the paper
“Nevertheless, since this mobile-based HRV recording setup displays superior practicability with generally comparable results, its commercial use for the monitoring of HRV data during resting and endurance exercise conditions could be justified.”
§ Validity of the Polar H10 Sensor for Heart Rate Variability Analysis during Resting State and Incremental Exercise in Recreational Men and Women > 5. Conclusions
hedged- Asserted: passes — The authors put it forward as true.
- Checkable: fails — It may be too vague to check against evidence.
- Load-bearing: passes — The paper’s conclusions depend on it.
- Based: passes — The paper gives a reason why it holds.
Probably not a substantial claim. It may be too vague to check against evidence.
A conclusion the paper draws from its own results — it cites no other source for it, so there is none to check. The quote shows it is in the paper.
In the paper
“Linear HRV measurements derived from the Polar H10 chest strap device show strong agreement and small bias compared with ECG recordings and can be recommended for practitioners.”
§ Validity of the Polar H10 Sensor for Heart Rate Variability Analysis during Resting State and Incremental Exercise in Recreational Men and Women > Abstract
boostedcorrelational- Asserted: passes — The authors put it forward as true.
- Checkable: passes — It can be checked against evidence.
- Load-bearing: passes — The paper’s conclusions depend on it.
- Based: passes — The paper gives a reason why it holds.
It may state two separate claims as one.
A conclusion the paper draws from its own results — it cites no other source for it, so there is none to check. The quote shows it is in the paper.
In the paper
“This may partly be related to the expected differences in non-linear HRV associated with ECG lead placement.”
§ Validity of the Polar H10 Sensor for Heart Rate Variability Analysis during Resting State and Incremental Exercise in Recreational Men and Women > 5. Conclusions
hedgedconditional- Asserted: passes — The authors put it forward as true.
- Checkable: passes — It can be checked against evidence.
- Load-bearing: passes — The paper’s conclusions depend on it.
- Based: fails — The paper may give no reason why it holds.
Probably not a substantial claim. The paper may give no reason why it holds.
In the paper
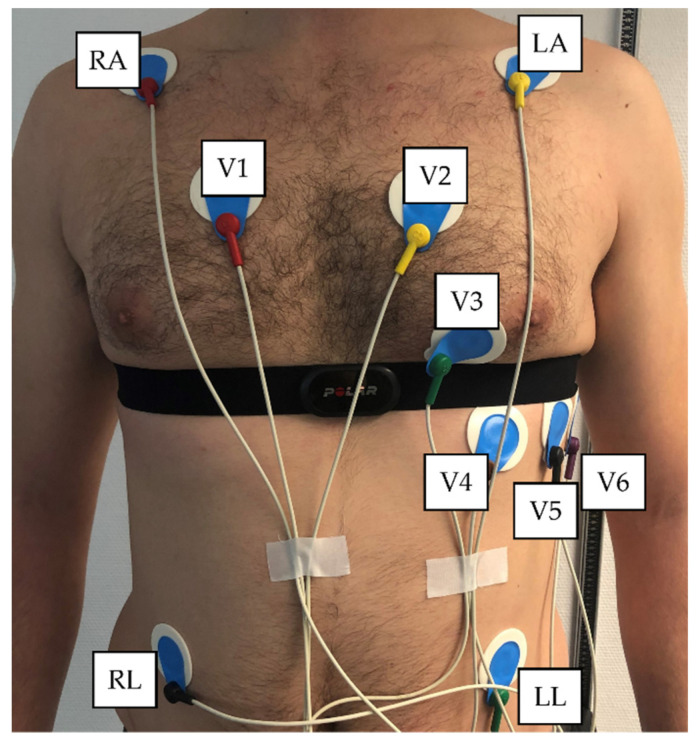
“For the 12-channel ECG, lead 2 was used as the comparable lead to the chest strap device [21].”
§ Validity of the Polar H10 Sensor for Heart Rate Variability Analysis during Resting State and Incremental Exercise in Recreational Men and Women > 2. Materials and Methods > 2.3. Data Processing
What the sources say
- Not checked yetcites [21] Jeyhani, V., Mantysalo, M., Noponen, K., Seppanen, T., and Vehkaoja, A. (2019, January 23–27). Effect of Different ECG Leads on Estimated R–R Intervals and Heart Rate Variability Parameters. Proceedings of the 41st Annual International Conference of the IEEE Engineering in Medicine and Biology Society (EMBC), Berlin, Germany. source
plain- Asserted: passes — The authors put it forward as true.
- Checkable: passes — It can be checked against evidence.
- Load-bearing: passes — The paper’s conclusions depend on it.
- Based: passes — The paper gives a reason why it holds.
Probably not a substantial claim.
What the paper did — it cites no source for this, so there is none to check. The quote shows it is in the paper.
In the paper
“provided written informed consent.”
§ Validity of the Polar H10 Sensor for Heart Rate Variability Analysis during Resting State and Incremental Exercise in Recreational Men and Women > 2. Materials and Methods > 2.1. Participants
plain- Asserted: passes — The authors put it forward as true.
- Checkable: passes — It can be checked against evidence.
- Load-bearing: fails — The paper’s conclusions may not depend on it.
- Based: passes — The paper gives a reason why it holds.
Probably not a substantial claim. The paper’s conclusions may not depend on it.
What the paper did — it cites no source for this, so there is none to check. The quote shows it is in the paper.
In the paper
“Entry criteria included adults (>18 years) of either sex and of any fitness level without previous medical history, current medications or recent illness.”
§ Validity of the Polar H10 Sensor for Heart Rate Variability Analysis during Resting State and Incremental Exercise in Recreational Men and Women > 2. Materials and Methods > 2.1. Participants
plain- Asserted: passes — The authors put it forward as true.
- Checkable: passes — It can be checked against evidence.
- Load-bearing: fails — The paper’s conclusions may not depend on it.
- Based: passes — The paper gives a reason why it holds.
Probably not a substantial claim. The paper’s conclusions may not depend on it. It may state two separate claims as one.
What the paper did — it cites no source for this, so there is none to check. The quote shows it is in the paper.
In the paper
“Ethical approval for the study was obtained by the University of Hamburg, Department of Psychology and Movement Science, Germany (reference no.: 2021_400) and is in line with the principles of the Declaration of Helsinki.”
§ Validity of the Polar H10 Sensor for Heart Rate Variability Analysis during Resting State and Incremental Exercise in Recreational Men and Women > 2. Materials and Methods > 2.1. Participants
plain- Asserted: passes — The authors put it forward as true.
- Checkable: passes — It can be checked against evidence.
- Load-bearing: fails — The paper’s conclusions may not depend on it.
- Based: passes — The paper gives a reason why it holds.
Probably not a substantial claim. The paper’s conclusions may not depend on it. It may state two separate claims as one.
In the paper
“The degree of bias may simply relate to the discordance between actual ECG waveform signal strength and morphology [21].”
§ Validity of the Polar H10 Sensor for Heart Rate Variability Analysis during Resting State and Incremental Exercise in Recreational Men and Women > 4. Discussions
What the sources say
- Not checked yetcites [21] Jeyhani, V., Mantysalo, M., Noponen, K., Seppanen, T., and Vehkaoja, A. (2019, January 23–27). Effect of Different ECG Leads on Estimated R–R Intervals and Heart Rate Variability Parameters. Proceedings of the 41st Annual International Conference of the IEEE Engineering in Medicine and Biology Society (EMBC), Berlin, Germany. source
hedgedconditional- Asserted: passes — The authors put it forward as true.
- Checkable: passes — It can be checked against evidence.
- Load-bearing: fails — The paper’s conclusions may not depend on it.
- Based: passes — The paper gives a reason why it holds.
Probably not a substantial claim. The paper’s conclusions may not depend on it.
The paper relies on this without support.
To date no validation has been conducted for non-linear measures of HRV.
“In addition to the requirement to perform population-based validations, to date no validation has been conducted for non-linear measures of HRV.”
The paper relies on this without support.
Researchers and recreational athletes frequently use the Polar H10 device for data collection and rely on appropriate measurements.
“since researchers and recreational athletes frequently use this device for data collection and therefore rely on appropriate measurements.”
The paper relies on this without support.
The Polar H10 only stores RR intervals and not ECG waveform recordings.
“Since the Polar H10 only stores RR intervals and not ECG waveform recordings”
Claims other papers make about this one
Each is checked against this paper’s own text: does it say what the citing paper says it does?
In the citing paper
“As a gold standard comparison for accuracy, either an ECG (n = 7) or a chest strap (n = 3) was used, two modalities that are known to correlate well [13].”
From Accuracy of heart rate measurement with wrist-worn wearable devices in various skin tones: a systematic review (2023) · cites this paper as [13]
In the citing paper
“As a gold standard comparison for accuracy, either an ECG (n = 7) or a chest strap (n = 3) was used, two modalities that are known to correlate well [13].”
From Accuracy of heart rate measurement with wrist-worn wearable devices in various skin tones: a systematic review (2023) · cites this paper as [13]
Citations
Cites
Measuring agreement in method comparison studies
Bland, J. M., & Altman, D. G. (1999) · Statistical Methods in Medical Research · doi:10.1177/096228029900800204 · Cited by 9,619
A concordance correlation coefficient to evaluate reproducibility.
Lin, L. I.-K. (1989) · Biometrics · doi:10.2307/2532051 · Cited by 8,785
A Real-Time QRS Detection Algorithm
Pan, J., & Tompkins, W. J. (1985) · IEEE Transactions on Biomedical Engineering · doi:10.1109/tbme.1985.325532 · Cited by 7,855
Quantification of scaling exponents and crossover phenomena in nonstationary heartbeat time series
Peng, C., Havlin, S., Stanley, E., & Goldberger, A. L. (1995) · Chaos An Interdisciplinary Journal of Nonlinear Science · doi:10.1063/1.166141 · Cited by 3,865
Age-predicted maximal heart rate revisited
Tanaka, H., Monahan, K. D., & Seals, D. R. (2001) · Journal of the American College of Cardiology · doi:10.1016/s0735-1097(00)01054-8 · Cited by 3,775 · cited 1×
“The following criteria served for the assumption of exhaustion: (A) heart rate >90% of the maximum predicted heart rate (prediction model according to [20]: 208 − (0.”
BackgroundKubios HRV–heart rate variability analysis software.
Tarvainen, M. P., Niskanen, J.-P., Lipponen, J. A., Ranta-aho, P. O., & Karjalainen, P. A. (2014) · Computer Methods and Programs in Biomedicine · doi:10.1016/j.cmpb.2013.07.024 · Cited by 2,720 · cited 4×
“0 (Biosignal Analysis and Medical Imaging Group, Department of Physics, University of Kuopio, Kuopio, Finland, [19]) was conducted.”
BackgroundMethodInfluentialEstimates of Location Based on Rank Tests
Hodges, J. L., & Lehmann, E. L. (1963) · The Annals of Mathematical Statistics · doi:10.1214/aoms/1177704172 · Cited by 1,276
Biostatistics 104: correlational analysis.
Chan, Y. H. (2003) · PubMed · Cited by 1,223
Monitoring training status with HR measures: do all roads lead to Rome?
Buchheit, M. (2014) · Frontiers in Physiology · doi:10.3389/fphys.2014.00073 · Cited by 1,016
Cardiac Parasympathetic Reactivation Following Exercise: Implications for Training Prescription
Stanley, J., Peake, J. M., & Buchheit, M. (2013) · Sports Medicine · doi:10.1007/s40279-013-0083-4 · Cited by 551
Cited by
Sorted by citations
Koerber, D., Khan, S., Shamsheri, T., Kirubarajan, A., & Mehta, S. (2023) · Journal of Racial and Ethnic Health Disparities · doi:10.1007/s40615-022-01446-9 · Cited by 91
A Systematic Review on the Use of Consumer-Based ECG Wearables on Cardiac Health Monitoring
Wang, R., Veera, S. C. M., Asan, O., & Liao, T. (2024) · IEEE Journal of Biomedical and Health Informatics · doi:10.1109/jbhi.2024.3456028 · Cited by 42
Challenges and standardisation strategies for sensor-based data collection for digital phenotyping
Alam, N. B., Surani, M., Das, C. K., Giacco, D., Singh, S. P., & Jilka, S. (2025) · Communications Medicine · doi:10.1038/s43856-025-01013-3 · Cited by 41
Are Activity Wrist-Worn Devices Accurate for Determining Heart Rate during Intense Exercise?
Martín-Escudero, P., Cabanas, A. M., Dotor-Castilla, M. L., Galindo-Canales, M., Miguel‐Tobal, F., Fernández, C., Fuentes, M. E., & Giannetti, R. (2023) · Bioengineering · doi:10.3390/bioengineering10020254 · Cited by 41
Romagnoli, S., Ripanti, F., Morettini, M., Burattini, L., & Sbrollini, A. (2023) · Sensors · doi:10.3390/s23063350 · Cited by 40
Metadata
- Authors
- Schaffarczyk, M., Rogers, B., Reer, R., & Gronwald, T.
- Affiliations
- Universität Hamburg (DE)
- University of Central Florida (US)
- MSH Medical School Hamburg – University of Applied Sciences and Medical University (DE)
- Corresponding author
- Schaffarczyk, Marcelle
- Venue
- Sensors
- Publisher
- MDPI AG
- Published
- 2022-08-30
- Volume
- 22
- Issue
- 17
- Pages
- 6536
- ISSN
- 1424-8220 (ISSN-L)
- PMC
- PMC9459793
- OpenAlex
- W4293715556
- Semantic Scholar
- d503adc11de24a90cadc9e05705b05b448ea1071
- Cited by
- 349
- References
- 38
- Citations by year
- 2026: 132 · 2025: 108 · 2024: 75 · 2023: 32 · 2022: 2
- FWCI
- 37.75
- Type
- journal article
- Language
- en
- Open access
- gold
- doi.org
- Licence
- Locations
- Sensors (publishedVersion, cc-by)
- PubMed Central (publishedVersion, cc-by)
- PubMed (publishedVersion)
- DOAJ (DOAJ: Directory of Open Access Journals) (submittedVersion, cc-by-sa)
- Topics
- Health Sciences › Medicine › Cardiology and Cardiovascular Medicine › Heart Rate Variability and Autonomic Control
- Physical Sciences › Engineering › Biomedical Engineering › Non-Invasive Vital Sign Monitoring
- Health Sciences › Medicine › Physiology (medical) › Cardiovascular and exercise physiology
- Keywords
- heart rate variability, electrocardiogram comparison, RR interval, incremental exercise, measurement bias, limits of agreement, recreational athletes, sex differences
- MeSH terms
- Bicycling, Electrocardiography, Exercise Test, Female, Heart Rate, Humans, Male, Exercise
About these checks
Registry, retraction, Cites and statistics results are computed, not judged, with one exception: a printed reference that no index lists is read once by a model before it counts as a citation error. Claims are extracted by a model and kept only when their quote appears verbatim in the text; each cited source is then checked, with a model’s help, for whether it says what the claim relies on. Those verdicts can be wrong — read the claim’s quote and the cited source before relying on one.
A language model drew the claims from the paper on 2026-10-09, under version 3 of the claim definition (model deepseek-v4.1-flash, prompt extract-v3).
A second model labelled each claim on 2026-10-09 (model jev-1.13-20260917, definition revision gold-guideline-v0.2).
Statistics and arithmetic are recomputed, not judged.
Confidence bands are shown only for fields calibrated on our annotated test set. None is calibrated yet, so no band is shown.
What counts as a claim ›How we measure confidence ›How we check this ›
Are you an author, or do you see a problem with this page? Request a review
