

The DOI matches its Crossref record; 42 of the 42 references it cites were found in a registry or an index.
The starvation hormone, fibroblast growth factor-21, extends lifespan in mice
Open accessAbstract
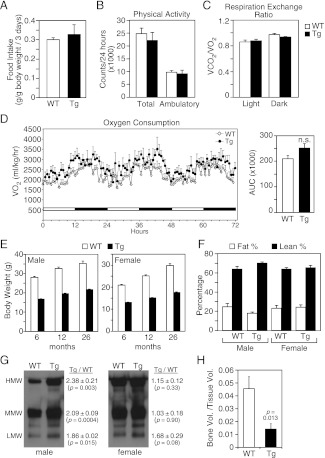
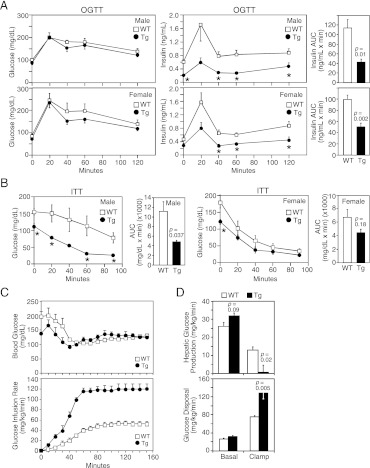
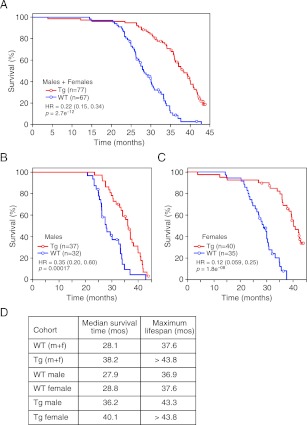
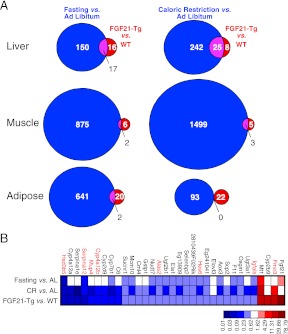
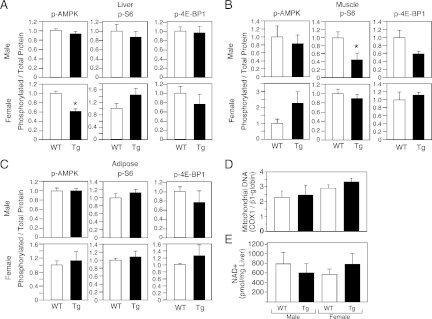
Fibroblast growth factor-21 (FGF21) is a hormone secreted by the liver during fasting that elicits diverse aspects of the adaptive starvation response. Among its effects, FGF21 induces hepatic fatty acid oxidation and ketogenesis, increases insulin sensitivity, blocks somatic growth and causes bone loss. Here we show that transgenic overexpression of FGF21 markedly extends lifespan in mice without reducing food intake or affecting markers of NAD+ metabolism or AMP kinase and mTOR signaling. Transcriptomic analysis suggests that FGF21 acts primarily by blunting the growth hormone/insulin-like growth factor-1 signaling pathway in liver. These findings raise the possibility that FGF21 can be used to extend lifespan in other species.DOI:http://dx.doi.org/10.7554/eLife.00065.001.
Overview
The claims and statistics of this paper haven’t been checked yet.
Run the check — free, no account needed. It reads the open-access text and checks the sources it cites.
Integrity signals
Registry
Cites
Statistics
Figures
Verification
Claims the paper makes
The claims and statistics of this paper haven’t been checked yet.
Run the check — free, no account needed. It reads the open-access text and checks the sources it cites.
Claims other papers make about this one
Each is checked against this paper’s own text: does it say what the citing paper says it does?
In the citing paper
“Interestingly, a recent report showed that mice with transgenic overexpression of fibroblast growth factor 21 (FGF21), a fasting hormone, can extend life span when maintained on an ad libitum diet (Zhang et al., 2012).”
From The Search for Antiaging Interventions: From Elixirs to Fasting Regimens (2014) · cites this paper as Zhang et al., 2012
In the citing paper
“prolonged overexpression of FGF21 in mice increases insulin sensitivity and extends lifespan64,79.”
From Metabolic messengers: FGF21 (2021) · cites this paper as [64]
In the citing paper
“FGF21 is markedly induced in response to protein restriction (25, 73, 85) but not caloric restriction (73, 148).”
From Fibroblast Growth Factor 21: A Versatile Regulator of Metabolic Homeostasis (2018) · cites this paper as [148]
Self-check
Percentages, sums and reported differences re-computed from the paper’s own numbers.
The self-check needs the paper’s full text.
Citations
Cites
Nonparametric Estimation from Incomplete Observations
Kaplan, E. L., & Meier, P. (1992) · Springer series in statistics · doi:10.1007/978-1-4612-4380-9_25 · Cited by 45,239
Nonparametric Estimation from Incomplete Observations
Kaplan, E. L., & Meier, P. (1958) · Journal of the American Statistical Association · doi:10.1080/01621459.1958.10501452 · Cited by 39,158
In silico prediction of protein-protein interactions in human macrophages
Souiai, O., Guerfali, F. Z., Miled, S. B., Brun, C., & Benkahla, A. (2014) · BMC Research Notes · doi:10.1186/1756-0500-7-157 · Cited by 10,785
Significance analysis of microarrays applied to the ionizing radiation response
Tusher, V. G., Tibshirani, R., & Chu, G. (2001) · Proceedings of the National Academy of Sciences · doi:10.1073/pnas.091062498 · Cited by 10,568
Kenyon, C. J. (2010) · Nature · doi:10.1038/nature08980 · Cited by 2,739
Modelling for Survival Data in Medical Research
(1995) · Technometrics · doi:10.1080/00401706.1995.10485920 · Cited by 2,159
FGF-21 as a novel metabolic regulator
Kharitonenkov, A., Shiyanova, T. L., Koester, A., Ford, A. M., Micanovic, R., Galbreath, E. J., Sandusky, G. E., Hammond, L. J., Moyers, J. S., Owens, R. A., et al. (2005) · Journal of Clinical Investigation · doi:10.1172/jci23606 · Cited by 2,125
Suppression of Aging in Mice by the Hormone Klotho
Kurosu, H., Yamamoto, M., Clark, J. D., Pastor, J. V., Nandi, A., Gurnani, P., McGuinness, O. P., Chikuda, H., Yamaguchi, M., Kawaguchi, H., et al. (2005) · Science · doi:10.1126/science.1112766 · Cited by 1,935
Inagaki, T., Dutchak, P., Zhao, G., Ding, X., Gautron, L., Parameswara, V., Li, Y., Goetz, R., Mohammadi, M., Esser, V., et al. (2007) · Cell Metabolism · doi:10.1016/j.cmet.2007.05.003 · Cited by 1,504
Telomere dysfunction induces metabolic and mitochondrial compromise
Sahin, E., Colla, S., Liesa, M., Moslehi, J., Müller, F. L., Guo, M., Cooper, M., Kotton, D., Fabian, A. J., Walkey, C., et al. (2011) · Nature · doi:10.1038/nature09787 · Cited by 1,319
Cited by
Sorted by citations
Naturally occurring p16Ink4a-positive cells shorten healthy lifespan
Baker, D. J., Childs, B. G., Durik, M., Wijers, M. E., Sieben, C. J., Zhong, J., A. Saltness, R., Jeganathan, K. B., Verzosa, G. C., Pezeshki, A., et al. (2016) · Nature · doi:10.1038/nature16932 · Cited by 2,876
“4c, d) 15–28 , suggesting that repetitive vehicle injection stress may have negatively impacted C57BL/6 male longevity (Supplemenary Text).”
Adipogenesis and metabolic health
Ghaben, A. L., & Scherer, P. E. (2019) · Nature Reviews Molecular Cell Biology · doi:10.1038/s41580-018-0093-z · Cited by 1,395
Mitochondrial Dynamics and Metabolic Regulation
Wai, T., & Langer, T. (2016) · Trends in Endocrinology and Metabolism · doi:10.1016/j.tem.2015.12.001 · Cited by 1,354
Adipokines in health and disease
Fasshauer, M., & Blüher, M. (2015) · Trends in Pharmacological Sciences · doi:10.1016/j.tips.2015.04.014 · Cited by 1,050
β-Hydroxybutyrate: A Signaling Metabolite
Newman, J. C., & Verdin, E. (2017) · Annual Review of Nutrition · doi:10.1146/annurev-nutr-071816-064916 · Cited by 872
Metadata
- Authors
- Zhang, Y., Xie, Y., Berglund, E. D., Coate, K. C., He, T. T., Katafuchi, T., Xiao, G., Potthoff, M. J., Wei, W., Wan, Y., Yu, R. T., Evans, R. M., Kliewer, S. A., & Mangelsdorf, D. J.
- Affiliations
- The University of Texas Southwestern Medical Center (US)
- Howard Hughes Medical Institute (US)
- Salk Institute for Biological Studies (US)
- Corresponding author
- Kliewer, Steven A
- ORCID
- Venue
- eLife
- Publisher
- eLife Sciences Publications, Ltd
- Published
- 2012-10-15
- Volume
- 1
- Pages
- e00065-e00065
- ISSN
- 2050-084X (ISSN-L)
- PMC
- PMC3466591
- OpenAlex
- W2165852917
- Cited by
- 420
- References
- 42
- Citations by year
- 2026: 27 · 2025: 31 · 2024: 27 · 2023: 27 · 2022: 27 · 2021: 41 · 2020: 33 · 2019: 38 · 2018: 30 · 2017: 22 · 2016: 40 · 2015: 38 · 2014: 25 · 2013: 13 · 2012: 1
- FWCI
- 9.89
- Type
- journal article
- Language
- en
- Open access
- gold
- doi.org
- Licence
- Locations
- eLife (publishedVersion, cc-by)
- Europe PMC (PubMed Central) (publishedVersion, cc-by)
- PubMed Central (publishedVersion, cc-by)
- PubMed (publishedVersion)
- DOAJ (DOAJ: Directory of Open Access Journals) (submittedVersion, cc-by-sa)
- Funders
- Howard Hughes Medical Institute
- Leona M and Harry B Helmsley Charitable Trust
- UTSW Endowed Scholar Startup Fund
- National Institutes of Health (CA152301, DK057978, DK062434, DK089113, DK092083, RL1GM084436)
- Robert A Welch Foundation (I-1275, I-1558, I-1751)
- CPRIT (RP100841)
- Glenn Foundation
- Leona M. and Harry B. Helmsley Charitable Trust
- Welch Foundation (I-1275, I-1558, I-1751)
- Cancer Prevention and Research Institute of Texas (RP100841)
- Glenn Foundation for Medical Research
- Topics
- Life Sciences › Biochemistry, Genetics and Molecular Biology › Molecular Biology › Fibroblast Growth Factor Research
- Life Sciences › Biochemistry, Genetics and Molecular Biology › Aging › Genetics, Aging, and Longevity in Model Organisms
- Health Sciences › Medicine › Physiology (medical) › Dietary Effects on Health
- Keywords
- FGF21, lifespan extension, aging, fasting response, liver, transgenic overexpression, insulin sensitivity, ketogenesis, hepatic fatty acid oxidation, bone loss, physical growth
- MeSH terms
- Adaptation, Physiological, Adenylate Kinase, Animals, Bone Resorption, Fasting, Fatty Acids, Female, Fibroblast Growth Factors, Gene Expression Regulation, Insulin Resistance, Insulin-Like Growth Factor I, Ketone Bodies, Liver, Longevity, Male, Mice, Transgenic, NAD, Oxidation-Reduction, Growth Hormone, Signal Transduction, Transgenes, Caloric Restriction, Lipid Metabolism, Mice, TOR Serine-Threonine Kinases
About these checks
Registry, retraction, Cites and statistics results are computed, not judged, with one exception: a printed reference that no index lists is read once by a model before it counts as a citation error. Claims are extracted by a model and kept only when their quote appears verbatim in the text; each cited source is then checked, with a model’s help, for whether it says what the claim relies on. Those verdicts can be wrong — read the claim’s quote and the cited source before relying on one.
Statistics and arithmetic are recomputed, not judged.
Confidence bands are shown only for fields calibrated on our annotated test set. None is calibrated yet, so no band is shown.
What counts as a claim ›How we measure confidence ›How we check this ›
Are you an author, or do you see a problem with this page? Request a review
