

The DOI matches its Crossref record; 77 of the 77 references it cites were found in a registry or an index; none of the 50 sources its claims cite is checked for support yet.
Metabolic reprogramming during neuronal differentiation from aerobic glycolysis to neuronal oxidative phosphorylation
Open accessAbstract
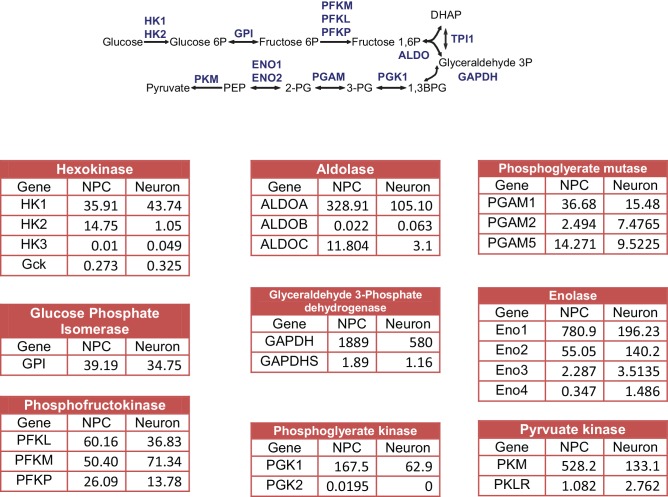
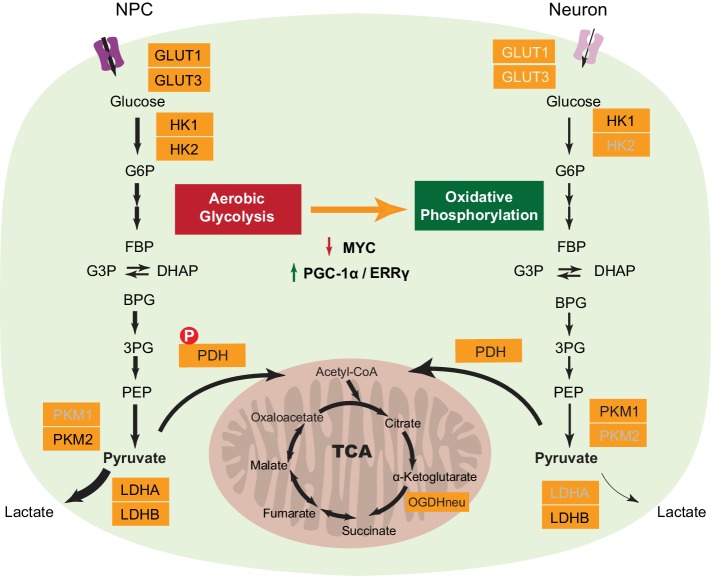
How metabolism is reprogrammed during neuronal differentiation is unknown. We found that the loss of hexokinase (HK2) and lactate dehydrogenase (LDHA) expression, together with a switch in pyruvate kinase gene splicing from PKM2 to PKM1, marks the transition from aerobic glycolysis in neural progenitor cells (NPC) to neuronal oxidative phosphorylation. The protein levels of c-MYC and N-MYC, transcriptional activators of the HK2 and LDHA genes, decrease dramatically. Constitutive expression of HK2 and LDHA during differentiation leads to neuronal cell death, indicating that the shut-off aerobic glycolysis is essential for neuronal survival. The metabolic regulators PGC-1α and ERRγ increase significantly upon neuronal differentiation to sustain the transcription of metabolic and mitochondrial genes, whose levels are unchanged compared to NPCs, revealing distinct transcriptional regulation of metabolic genes in the proliferation and post-mitotic differentiation states. Mitochondrial mass increases proportionally with neuronal mass growth, indicating an unknown mechanism linking mitochondrial biogenesis to cell size.
Overview
AI snapshot
Written from the paper’s full text.
TL;DR
Neuronal differentiation from human NPCs is marked by shutting off aerobic glycolysis and shifting to oxidative phosphorylation, with loss of HK2/LDHA, PKM2-to-PKM1 splicing, and decreased c-MYC/N-MYC. Constitutive HK2/LDHA expression kills differentiating neurons, while increased PGC-1α/ERRγ maintain rather than increase metabolic and mitochondrial gene expression.
Key findings
- Differentiation from NPCs to neurons involves loss of HK2 and LDHA protein, a PKM splice switch from PKM2 to PKM1, and a neuron-specific OGDH splice form lacking a Ca²⁺-binding motif; c-MYC and N-MYC protein levels fall by ~70% and ~85%, respectively.
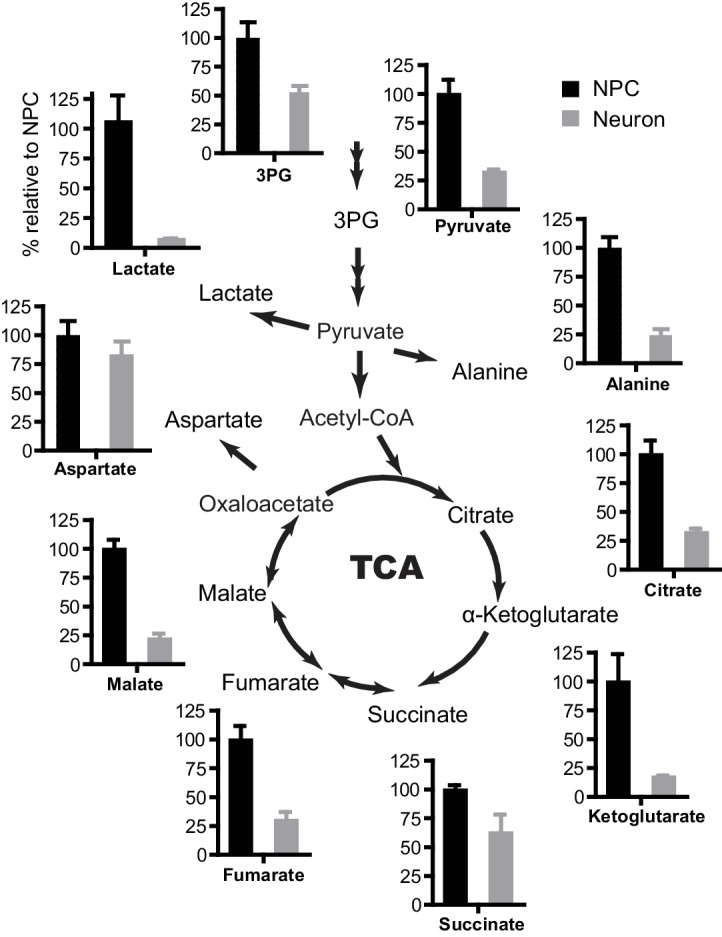
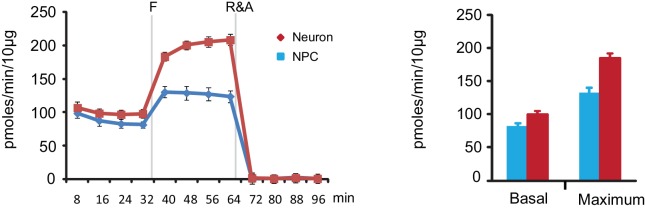
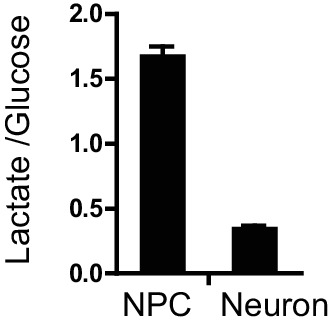
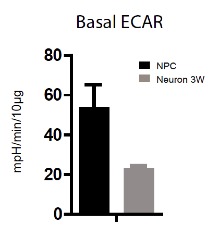
- Neurons show lower glycolytic/TCA metabolite levels and higher oxidative capacity: basal and maximum OCR rise from ~82 and 130 pmoles/min/10 µg in NPCs to ~98 and 183 in 3-week neurons, while lactate/glucose ratio falls from ~1.61 to ~0.35.
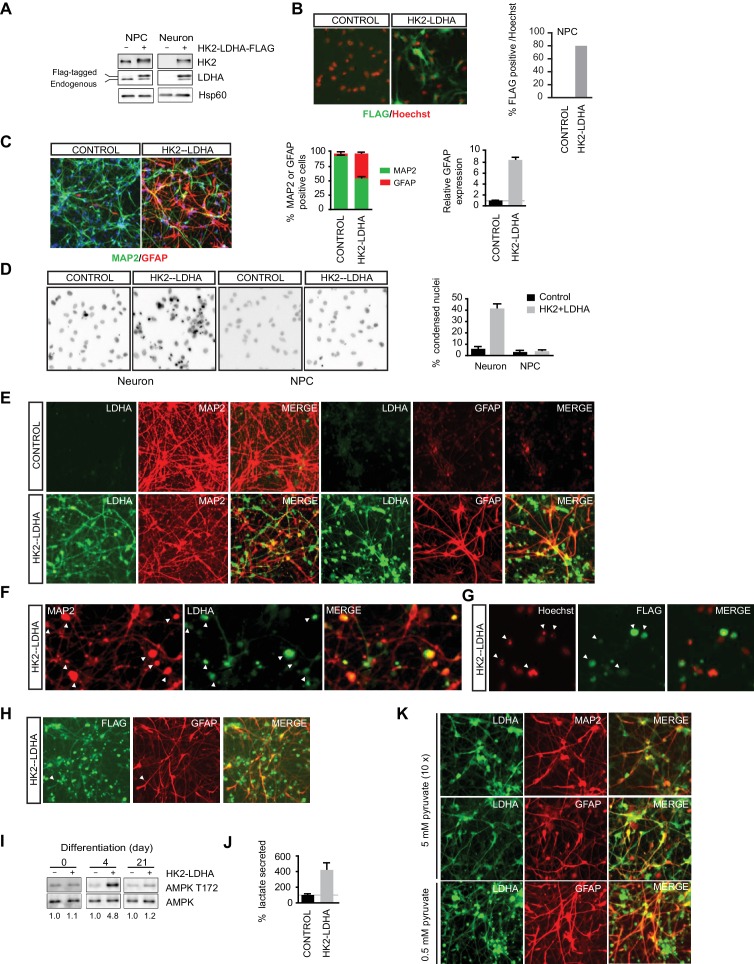
- Constitutive HK2 and LDHA expression during differentiation causes neuronal death: ~40% condensed nuclei versus ~6% in controls, with ~40% GFAP-positive glial cells versus ~4% in controls; extra pyruvate (5 mM) rescues neuronal death but not glial increase.
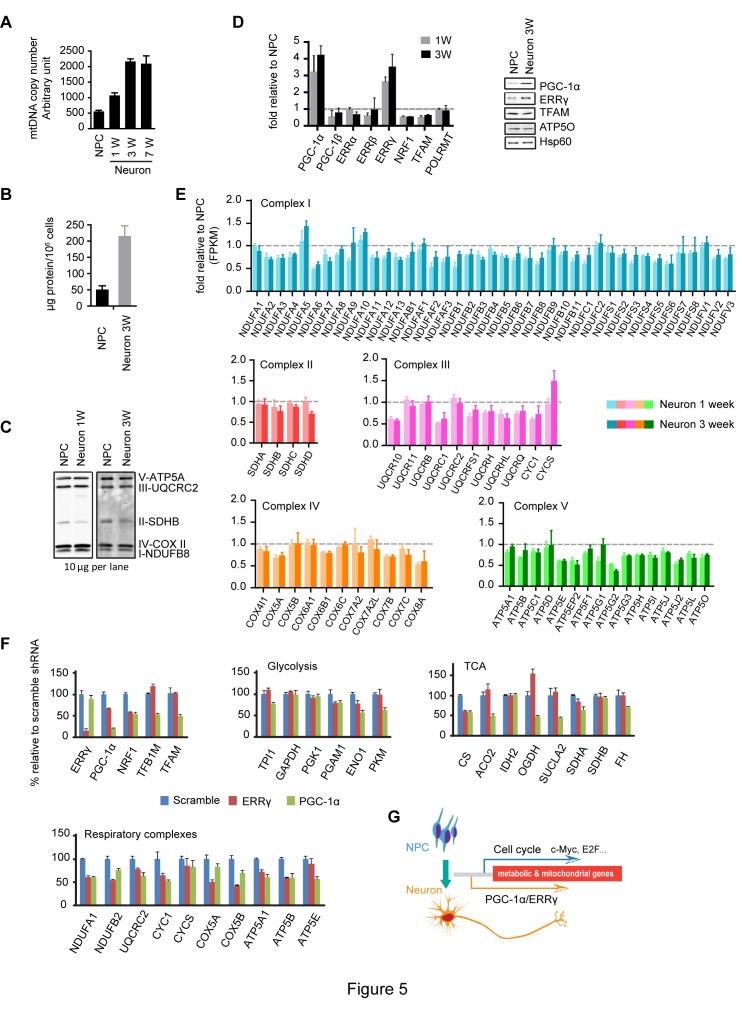
- PGC-1α and ERRγ increase ~3–4 fold and ~2.8–3.4 fold, respectively, and are required to maintain expression of glycolysis, TCA, and mitochondrial respiratory complex genes, even though most mitochondrial gene expression is unchanged versus NPCs; mtDNA copy number and protein mass both increase ~4-fold by 3 weeks.
Methods
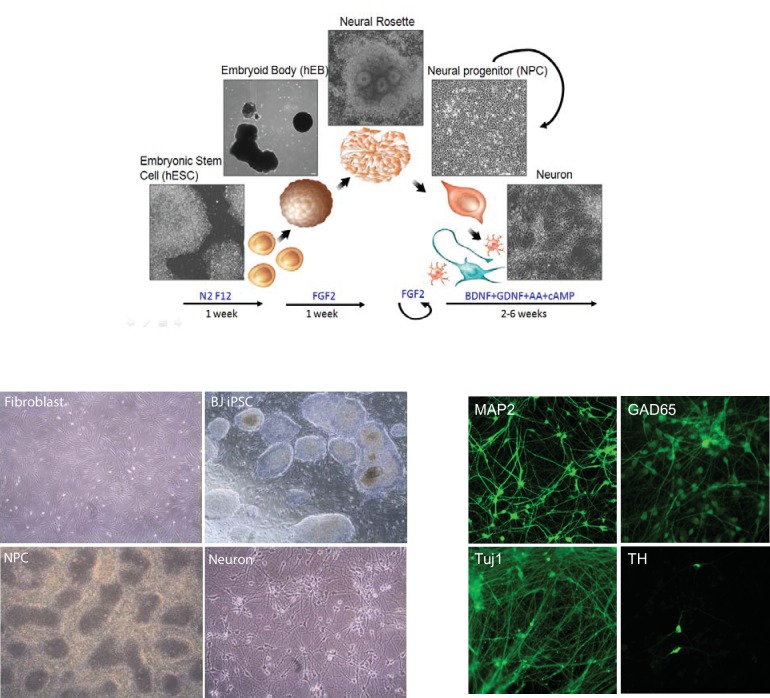
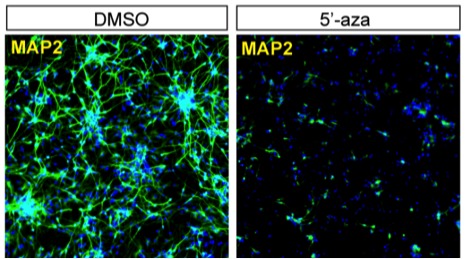
- Human BJ iPSC-derived NPCs were differentiated for 1–3 weeks and validated by Sox2/Nestin and MAP2 staining; RNA-seq was performed on two NPC lines with duplicates, and data were mapped with STAR and quantified by FPKM.
- Metabolic profiling used GC-MS for glycolytic/TCA metabolites, Seahorse for OCR, lactate assays, immunoblotting/immunostaining, RT-PCR, ChIP for c-MYC/N-MYC binding, and lenti-shRNA knockdowns of HK2, LDHA, PGC-1α, or ERRγ.
- Direct neuronal conversion from fibroblasts was tested with PTB knockdown or Ngn2/Ascl1 overexpression; mouse neuroprogenitor differentiation and published mouse astrocyte/neuron RNA-seq were used for conservation checks.
Limitations
- The paper states that expression levels of metabolic enzymes do not completely reflect biochemical/physiological activities, and post-translational modifications were not explored.
- The paper notes that mitochondrial structure, dynamics, and matrix calcium were not investigated, and that protein degradation may also downregulate key metabolic enzymes.
- Evident from the text: the main differentiation model relies on human BJ iPSC-derived NPCs, with some key findings validated in mouse cells; 3-week cultures were used as developing neurons, and rare glial cells emerge later, so longer-term neuronal populations were not the primary focus.
Model-written summary. Check it against the paper before relying on it.
Integrity signals
Registry
Cites
Statistics
Figures
Verification
Claims the paper makes
63 Own result · 41 Not checked yet · 39 Own interpretation · 6 Own method · 6 No basis given
A result the paper reports from its own data — it cites no other source for it, so there is none to check. The quote shows it is in the paper.
In the paper
“The metabolic regulators PGC-1α and ERRγ increase significantly upon neuronal differentiation”
§ Metabolic reprogramming during neuronal differentiation from aerobic glycolysis to neuronal oxidative phosphorylation > Abstract
plaindirect- Asserted: passes — The authors put it forward as true.
- Checkable: passes — It can be checked against evidence.
- Load-bearing: passes — The paper’s conclusions depend on it.
- Based: passes — The paper gives a reason why it holds.
A result the paper reports from its own data — it cites no other source for it, so there is none to check. The quote shows it is in the paper.
In the paper
“Mitochondrial mass increases proportionally with neuronal mass growth”
§ Metabolic reprogramming during neuronal differentiation from aerobic glycolysis to neuronal oxidative phosphorylation > Abstract
plaindirect- Asserted: passes — The authors put it forward as true.
- Checkable: passes — It can be checked against evidence.
- Load-bearing: unclear — It is unclear whether the paper’s conclusions depend on it.
- Based: passes — The paper gives a reason why it holds.
A result the paper reports from its own data — it cites no other source for it, so there is none to check. The quote shows it is in the paper.
In the paper
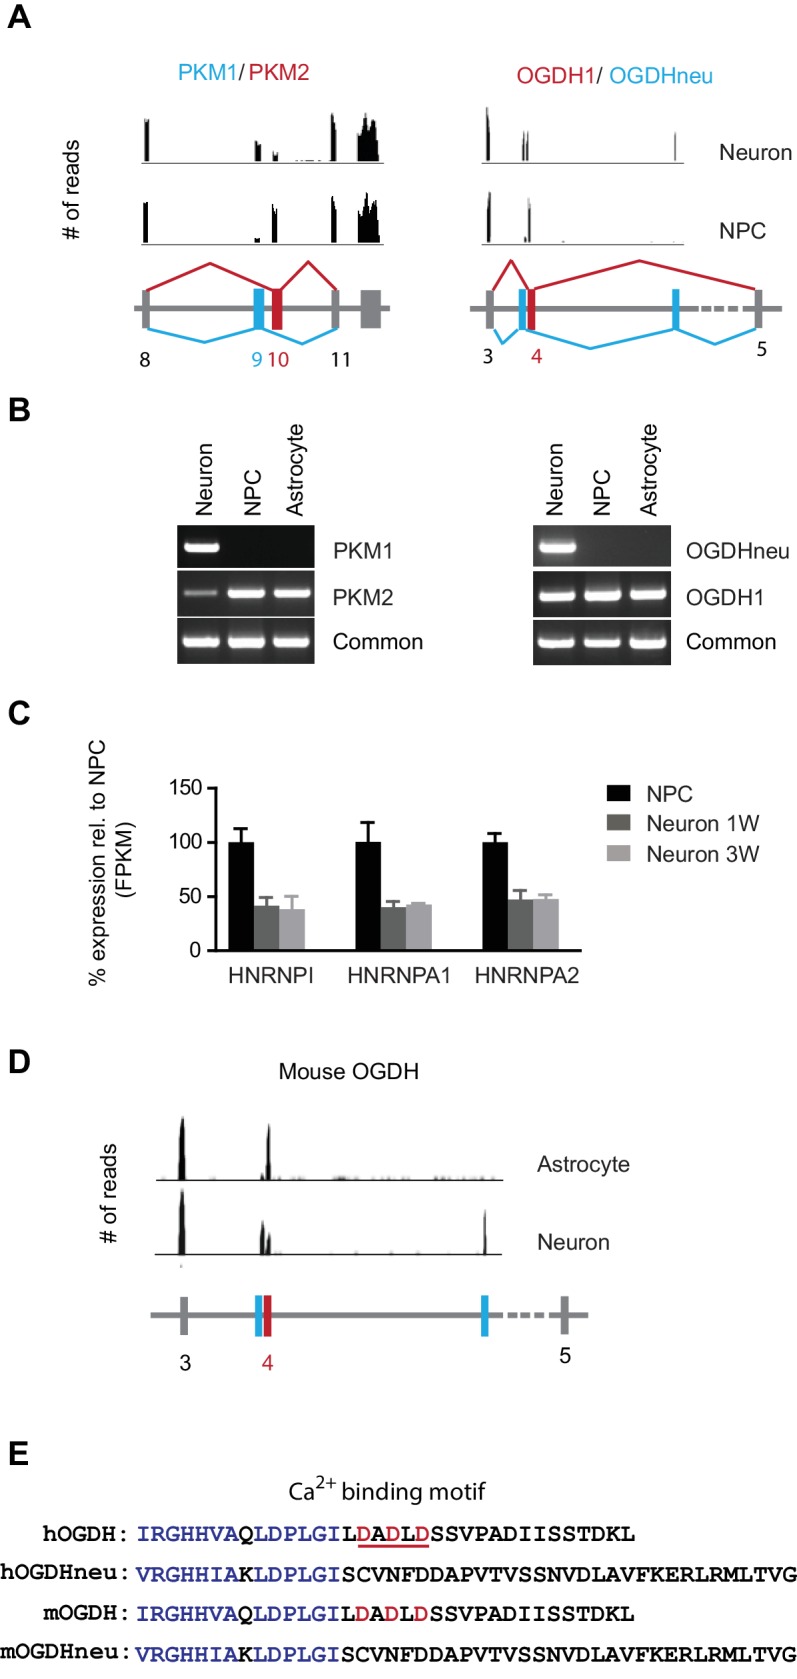
“a switch in pyruvate kinase gene splicing from PKM2 to PKM1”
- Also stated in: § Neuron-specific splicing of PKM and OGDH · plain
“NPCs mainly expressed PKM2, whereas neurons expressed PKM1”
§ Metabolic reprogramming during neuronal differentiation from aerobic glycolysis to neuronal oxidative phosphorylation > Abstract
plaindirect- Asserted: passes — The authors put it forward as true.
- Checkable: passes — It can be checked against evidence.
- Load-bearing: passes — The paper’s conclusions depend on it.
- Based: passes — The paper gives a reason why it holds.
- Also stated in: § Neuron-specific splicing of PKM and OGDH · plain
A result the paper reports from its own data — it cites no other source for it, so there is none to check. The quote shows it is in the paper.
In the paper
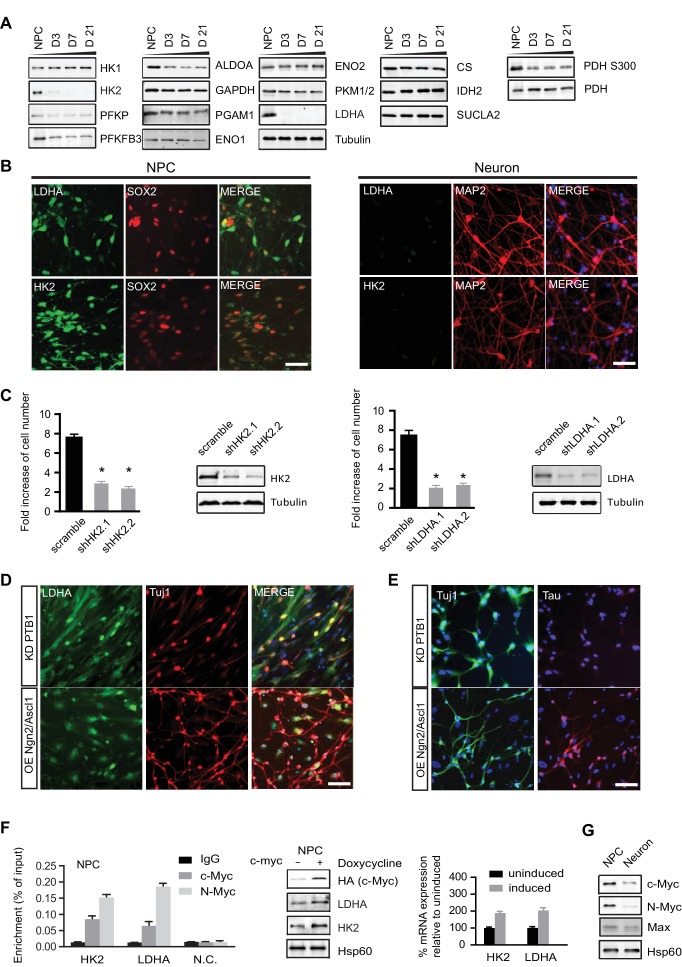
“We found that the loss of hexokinase (HK2) and lactate dehydrogenase (LDHA) expression”
- Also stated in: § HK2 and LDHA were off during neuronal differentiation · plain
“HK2 and LDHA mRNAs were about 15% and 25% of those in NPCs, but strikingly, both proteins almost completely disappeared upon differentiation”
§ Metabolic reprogramming during neuronal differentiation from aerobic glycolysis to neuronal oxidative phosphorylation > Abstract
plaindirect- Asserted: passes — The authors put it forward as true.
- Checkable: passes — It can be checked against evidence.
- Load-bearing: passes — The paper’s conclusions depend on it.
- Based: passes — The paper gives a reason why it holds.
- Also stated in: § HK2 and LDHA were off during neuronal differentiation · plain
The paper states this without a source or data behind it here, so there is nothing to check it against. The quote shows it is in the paper.
In the paper
“whose levels are unchanged compared to NPCs”
§ Metabolic reprogramming during neuronal differentiation from aerobic glycolysis to neuronal oxidative phosphorylation > Abstract
plain- Asserted: passes — The authors put it forward as true.
- Checkable: passes — It can be checked against evidence.
- Load-bearing: passes — The paper’s conclusions depend on it.
- Based: passes — The paper gives a reason why it holds.
A result the paper reports from its own data — it cites no other source for it, so there is none to check. The quote shows it is in the paper.
In the paper
“Constitutive expression of HK2 and LDHA during differentiation leads to neuronal cell death”
§ Metabolic reprogramming during neuronal differentiation from aerobic glycolysis to neuronal oxidative phosphorylation > Abstract
plaindirect- Asserted: passes — The authors put it forward as true.
- Checkable: passes — It can be checked against evidence.
- Load-bearing: passes — The paper’s conclusions depend on it.
- Based: passes — The paper gives a reason why it holds.
A result the paper reports from its own data — it cites no other source for it, so there is none to check. The quote shows it is in the paper.
In the paper
“The protein levels of c-MYC and N-MYC, transcriptional activators of the HK2 and LDHA genes, decrease dramatically.”
- Also stated in: § HK2 and LDHA were off during neuronal differentiation · plain
“Both c-MYC and N-MYC protein levels decreased significantly, by ~70% and ~85% respectively, once NPCs differentiated into neurons”
§ Metabolic reprogramming during neuronal differentiation from aerobic glycolysis to neuronal oxidative phosphorylation > Abstract
plaindirect- Asserted: passes — The authors put it forward as true.
- Checkable: passes — It can be checked against evidence.
- Load-bearing: passes — The paper’s conclusions depend on it.
- Based: passes — The paper gives a reason why it holds.
- Also stated in: § HK2 and LDHA were off during neuronal differentiation · plain
A result the paper reports from its own data — it cites no other source for it, so there is none to check. The quote shows it is in the paper.
In the paper
“After 3 weeks of differentiation, a majority (~85%) of cells expressed the neuronal marker MAP2”
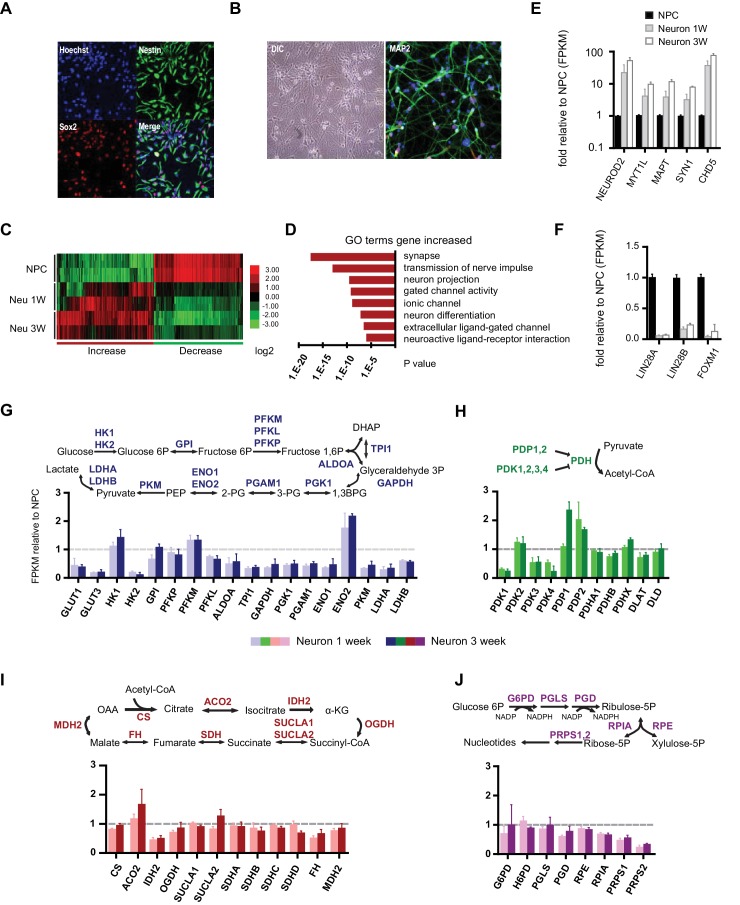
§ Metabolic reprogramming during neuronal differentiation from aerobic glycolysis to neuronal oxidative phosphorylation > Result > Transcription profiling of neuronal differentiation from human NPCs
plain- Asserted: passes — The authors put it forward as true.
- Checkable: passes — It can be checked against evidence.
- Load-bearing: passes — The paper’s conclusions depend on it.
- Based: passes — The paper gives a reason why it holds.
A result the paper reports from its own data — it cites no other source for it, so there is none to check. The quote shows it is in the paper.
In the paper
“the levels of citrate synthase (CS), isocitrate dehydrogenase (IDH2) and succinyl-CoA ligase β subunit (SUCLA2) were constant during differentiation”
§ Metabolic reprogramming during neuronal differentiation from aerobic glycolysis to neuronal oxidative phosphorylation > Result > HK2 and LDHA were off during neuronal differentiation
plain- Asserted: passes — The authors put it forward as true.
- Checkable: passes — It can be checked against evidence.
- Load-bearing: passes — The paper’s conclusions depend on it.
- Based: passes — The paper gives a reason why it holds.
A result the paper reports from its own data — it cites no other source for it, so there is none to check. The quote shows it is in the paper.
In the paper
“The basal and maximum OCRs of NPCs were ~82 and 130 (pmoles/min/10 µg), whereas those in 3-week differentiated neurons were ~98 and 183, significantly higher than in NPCs”
§ Metabolic reprogramming during neuronal differentiation from aerobic glycolysis to neuronal oxidative phosphorylation > Result > Glycolytic and TCA metabolites and oxygen consumption rate in NPCs and neurons
plain- Asserted: passes — The authors put it forward as true.
- Checkable: passes — It can be checked against evidence.
- Load-bearing: passes — The paper’s conclusions depend on it.
- Based: passes — The paper gives a reason why it holds.
- It may state two separate claims as one. 43
- Probably not a substantial claim. 17
- The quote only partly states this claim. 1
In the paper
“OGDH, a key enzyme in the TCA cycle, has a novel and conserved neuronal splicing shift, resulting in the loss of a calcium binding motif.”
- Also stated in: § Neuron-specific splicing of PKM and OGDH · plain
“a stretch of 34 amino acids in OGDH1, containing a Ca2+-binding motif (Armstrong et al., 2014), is replaced by 45 amino acids specific to OGDHneu”
§ Metabolic reprogramming during neuronal differentiation from aerobic glycolysis to neuronal oxidative phosphorylation > Introduction
What the sources say
- Not checked yetcites Armstrong et al., 2014
plaindirect- Asserted: passes — The authors put it forward as true.
- Checkable: passes — It can be checked against evidence.
- Load-bearing: passes — The paper’s conclusions depend on it.
- Based: passes — The paper gives a reason why it holds.
It may state two separate claims as one.
- Also stated in: § Neuron-specific splicing of PKM and OGDH · plain
A result the paper reports from its own data — it cites no other source for it, so there is none to check. The quote shows it is in the paper.
In the paper
“the levels of 3-phosphoglyerate (3PG) and pyruvate in neurons dropped to ~52% and 32% of those in NPCs”
§ Metabolic reprogramming during neuronal differentiation from aerobic glycolysis to neuronal oxidative phosphorylation > Result > Glycolytic and TCA metabolites and oxygen consumption rate in NPCs and neurons
plain- Asserted: passes — The authors put it forward as true.
- Checkable: passes — It can be checked against evidence.
- Load-bearing: passes — The paper’s conclusions depend on it.
- Based: passes — The paper gives a reason why it holds.
It may state two separate claims as one.
A result the paper reports from its own data — it cites no other source for it, so there is none to check. The quote shows it is in the paper.
In the paper
“citrate was ~32% of that in NPCs, α-ketoglutarate was ~17%, fumarate was ~30%, and malate was ~22%; succinate was relatively higher, at ~62%”
§ Metabolic reprogramming during neuronal differentiation from aerobic glycolysis to neuronal oxidative phosphorylation > Result > Glycolytic and TCA metabolites and oxygen consumption rate in NPCs and neurons
plain- Asserted: passes — The authors put it forward as true.
- Checkable: passes — It can be checked against evidence.
- Load-bearing: passes — The paper’s conclusions depend on it.
- Based: passes — The paper gives a reason why it holds.
It may state two separate claims as one.
A result the paper reports from its own data — it cites no other source for it, so there is none to check. The quote shows it is in the paper.
In the paper
“HK2 and LDHA mRNAs were about 15% and 25% of those in NPCs, but strikingly, both proteins almost completely disappeared upon differentiation”
§ Metabolic reprogramming during neuronal differentiation from aerobic glycolysis to neuronal oxidative phosphorylation > Result > HK2 and LDHA were off during neuronal differentiation
plaindirect- Asserted: passes — The authors put it forward as true.
- Checkable: passes — It can be checked against evidence.
- Load-bearing: passes — The paper’s conclusions depend on it.
- Based: passes — The paper gives a reason why it holds.
It may state two separate claims as one.
A result the paper reports from its own data — it cites no other source for it, so there is none to check. The quote shows it is in the paper.
In the paper
“both HK2 and LDHA mRNA levels dropped, falling to ~8.5% and ~11% of the level in NPCs, respectively, and, consistently, their protein levels were also greatly decreased”
§ Metabolic reprogramming during neuronal differentiation from aerobic glycolysis to neuronal oxidative phosphorylation > Result > HK2 and LDHA were off during neuronal differentiation
plaincorrelational- Asserted: passes — The authors put it forward as true.
- Checkable: passes — It can be checked against evidence.
- Load-bearing: passes — The paper’s conclusions depend on it.
- Based: passes — The paper gives a reason why it holds.
It may state two separate claims as one.
A result the paper reports from its own data — it cites no other source for it, so there is none to check. The quote shows it is in the paper.
In the paper
“OGDHneu splicing is conserved in mouse neurons, whereas mouse astrocytes, like human astrocytes, only expressed OGDH1”
§ Metabolic reprogramming during neuronal differentiation from aerobic glycolysis to neuronal oxidative phosphorylation > Result > Neuron-specific splicing of PKM and OGDH
plain- Asserted: passes — The authors put it forward as true.
- Checkable: passes — It can be checked against evidence.
- Load-bearing: passes — The paper’s conclusions depend on it.
- Based: passes — The paper gives a reason why it holds.
It may state two separate claims as one.
A result the paper reports from its own data — it cites no other source for it, so there is none to check. The quote shows it is in the paper.
In the paper
“OGDH in NPCs (OGDH1) uses exon 4, whereas the isoform in neurons, here called OGDHneu, uses two adjacent exons”
§ Metabolic reprogramming during neuronal differentiation from aerobic glycolysis to neuronal oxidative phosphorylation > Result > Neuron-specific splicing of PKM and OGDH
plain- Asserted: passes — The authors put it forward as true.
- Checkable: passes — It can be checked against evidence.
- Load-bearing: passes — The paper’s conclusions depend on it.
- Based: passes — The paper gives a reason why it holds.
It may state two separate claims as one.
A result the paper reports from its own data — it cites no other source for it, so there is none to check. The quote shows it is in the paper.
In the paper
“Most of the down-regulated genes were cell cycle related, whereas up-regulated genes were enriched in neuronal function pathways”
§ Metabolic reprogramming during neuronal differentiation from aerobic glycolysis to neuronal oxidative phosphorylation > Result > Transcription profiling of neuronal differentiation from human NPCs
plaincorrelational- Asserted: passes — The authors put it forward as true.
- Checkable: passes — It can be checked against evidence.
- Load-bearing: unclear — It is unclear whether the paper’s conclusions depend on it.
- Based: passes — The paper gives a reason why it holds.
It may state two separate claims as one.
A result the paper reports from its own data — it cites no other source for it, so there is none to check. The quote shows it is in the paper.
In the paper
“the ratio was ~1.61 lactate/glucose for NPCs, while in neurons, it was ~0.35”
§ Metabolic reprogramming during neuronal differentiation from aerobic glycolysis to neuronal oxidative phosphorylation > Result > Glycolytic and TCA metabolites and oxygen consumption rate in NPCs and neurons
plain- Asserted: passes — The authors put it forward as true.
- Checkable: passes — It can be checked against evidence.
- Load-bearing: passes — The paper’s conclusions depend on it.
- Based: passes — The paper gives a reason why it holds.
It may state two separate claims as one.
A result the paper reports from its own data — it cites no other source for it, so there is none to check. The quote shows it is in the paper.
In the paper
“TCA genes remained at the same level during differentiation; an exception was isocitrate dehydrogenase, IDH2, the mitochondrial isoform of IDH, which dropped nearly 50%”
§ Metabolic reprogramming during neuronal differentiation from aerobic glycolysis to neuronal oxidative phosphorylation > Result > Gene expression of glycolysis and TCA enzymes during neuronal differentiation
plain- Asserted: passes — The authors put it forward as true.
- Checkable: passes — It can be checked against evidence.
- Load-bearing: unclear — It is unclear whether the paper’s conclusions depend on it.
- Based: passes — The paper gives a reason why it holds.
It may state two separate claims as one.
A result the paper reports from its own data — it cites no other source for it, so there is none to check. The quote shows it is in the paper.
In the paper
“Except for PDK2, RNA levels of the other three PDKs declined significantly during neuronal differentiation; in contrast, PDP1 RNA levels increased ~2.5 fold at 3 weeks of differentiation”
§ Metabolic reprogramming during neuronal differentiation from aerobic glycolysis to neuronal oxidative phosphorylation > Result > Gene expression of glycolysis and TCA enzymes during neuronal differentiation
plaincorrelational- Asserted: passes — The authors put it forward as true.
- Checkable: passes — It can be checked against evidence.
- Load-bearing: passes — The paper’s conclusions depend on it.
- Based: passes — The paper gives a reason why it holds.
It may state two separate claims as one.
A result the paper reports from its own data — it cites no other source for it, so there is none to check. The quote shows it is in the paper.
In the paper
“Both approaches generated Tuj1-positive neurons after 3 weeks of transduction.”
§ Metabolic reprogramming during neuronal differentiation from aerobic glycolysis to neuronal oxidative phosphorylation > Result > LDHA is down-regulated in neurons directly converted from fibroblasts
plaindirect- Asserted: passes — The authors put it forward as true.
- Checkable: passes — It can be checked against evidence.
- Load-bearing: passes — The paper’s conclusions depend on it.
- Based: passes — The paper gives a reason why it holds.
It may state two separate claims as one.
A result the paper reports from its own data — it cites no other source for it, so there is none to check. The quote shows it is in the paper.
In the paper
“no significant difference was found between NPCs and neurons at 1 and 3 weeks, except for SDHB of complex II, which was consistently ~50% lower in neurons (Figure 5C).”
§ Metabolic reprogramming during neuronal differentiation from aerobic glycolysis to neuronal oxidative phosphorylation > Result > Increased neuronal PGC-1α/ERRγ maintained the transcription of glycolysis, TCA and mitochondrial genes
plain- Asserted: passes — The authors put it forward as true.
- Checkable: passes — It can be checked against evidence.
- Load-bearing: passes — The paper’s conclusions depend on it.
- Based: passes — The paper gives a reason why it holds.
It may state two separate claims as one.
A result the paper reports from its own data — it cites no other source for it, so there is none to check. The quote shows it is in the paper.
In the paper
“Indeed, AMPK pT172 was clearly increased at day 4 of neuronal differentiation compared to control, but the phosphorylation returned to a level comparable to control at day 21, when extensive cell death had already occurred (Figure 4I).”
§ Metabolic reprogramming during neuronal differentiation from aerobic glycolysis to neuronal oxidative phosphorylation > Result > Shutoff of aerobic glycolysis is critical for neuronal differentiation
boostedcorrelational- Asserted: passes — The authors put it forward as true.
- Checkable: passes — It can be checked against evidence.
- Load-bearing: passes — The paper’s conclusions depend on it.
- Based: passes — The paper gives a reason why it holds.
It may state two separate claims as one.
A result the paper reports from its own data — it cites no other source for it, so there is none to check. The quote shows it is in the paper.
In the paper
“after the first week, the neuronal mtDNA copy number doubled compared to NPCs, and at 3 weeks was increased to ~four fold.”
§ Metabolic reprogramming during neuronal differentiation from aerobic glycolysis to neuronal oxidative phosphorylation > Result > Increased neuronal PGC-1α/ERRγ maintained the transcription of glycolysis, TCA and mitochondrial genes
plaindirect- Asserted: passes — The authors put it forward as true.
- Checkable: passes — It can be checked against evidence.
- Load-bearing: passes — The paper’s conclusions depend on it.
- Based: passes — The paper gives a reason why it holds.
It may state two separate claims as one.
A result the paper reports from its own data — it cites no other source for it, so there is none to check. The quote shows it is in the paper.
In the paper
“The LDHA signal was clearly detected in GFAP-positive cells with anti-LDHA antibody (Figure 4E) or anti-FLAG antibody staining (Figure 4H), but there was no colocalization with MAP2, a neuronal marker.”
§ Metabolic reprogramming during neuronal differentiation from aerobic glycolysis to neuronal oxidative phosphorylation > Result > Shutoff of aerobic glycolysis is critical for neuronal differentiation
boosted- Asserted: passes — The authors put it forward as true.
- Checkable: passes — It can be checked against evidence.
- Load-bearing: passes — The paper’s conclusions depend on it.
- Based: passes — The paper gives a reason why it holds.
It may state two separate claims as one.
A result the paper reports from its own data — it cites no other source for it, so there is none to check. The quote shows it is in the paper.
In the paper
“We found that PGC-1α was required to maintain the levels of ENO1 and PKM in glycolysis; CS, ACO2, OGDH and SUCLA2 in TCA cycle; TFAM and TFBM1 in mtDNA replication and transcription, and NRF1 (nuclear respiratory factor-1), a key transcription factor that activates nuclear genes encoding respiratory complex subunits (Figure 5F).”
§ Metabolic reprogramming during neuronal differentiation from aerobic glycolysis to neuronal oxidative phosphorylation > Result > Increased neuronal PGC-1α/ERRγ maintained the transcription of glycolysis, TCA and mitochondrial genes
plaindirect- Asserted: passes — The authors put it forward as true.
- Checkable: passes — It can be checked against evidence.
- Load-bearing: passes — The paper’s conclusions depend on it.
- Based: passes — The paper gives a reason why it holds.
It may state two separate claims as one.
A result the paper reports from its own data — it cites no other source for it, so there is none to check. The quote shows it is in the paper.
In the paper
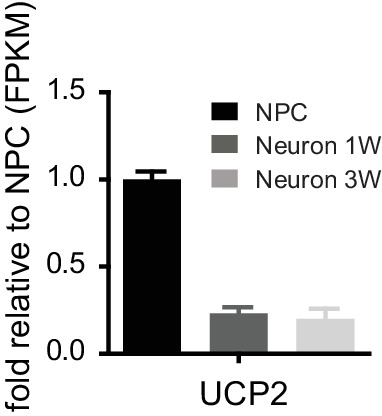
“We found that during neuronal differentiation, UCP2 expression levels dropped significantly, and in 3-week neurons the UCP2 level was only 20% of that in NPCs (Figure 5—figure supplement 1)”
§ Metabolic reprogramming during neuronal differentiation from aerobic glycolysis to neuronal oxidative phosphorylation > Discussion > Molecular changes that define the neuronal energy preference for oxidative phosphorylation
plaincorrelational- Asserted: passes — The authors put it forward as true.
- Checkable: passes — It can be checked against evidence.
- Load-bearing: passes — The paper’s conclusions depend on it.
- Based: passes — The paper gives a reason why it holds.
It may state two separate claims as one.
The paper states this without a source or data behind it here, so there is nothing to check it against. The quote shows it is in the paper.
In the paper
“Surprisingly, even though neurons rely on oxidative phosphorylation to generate energy; the expression of TCA and mitochondrial genes is not increased.”
§ Metabolic reprogramming during neuronal differentiation from aerobic glycolysis to neuronal oxidative phosphorylation > Discussion > Molecular changes that define the neuronal energy preference for oxidative phosphorylation
plain- Asserted: passes — The authors put it forward as true.
- Checkable: passes — It can be checked against evidence.
- Load-bearing: passes — The paper’s conclusions depend on it.
- Based: passes — The paper gives a reason why it holds.
It may state two separate claims as one.
- Rests on an assumption: Neurons rely on mitochondrial oxidative phosphorylation to meet energy demand.
In the paper
“deletion of lactate dehydrogenase A (LDHA) impairs maintenance and proliferation of hematopoietic stem and progenitor cells (Wang et al., 2014)”
§ Metabolic reprogramming during neuronal differentiation from aerobic glycolysis to neuronal oxidative phosphorylation > Introduction
What the sources say
- Not checked yetcites Wang et al., 2014
plaindirect- Asserted: passes — The authors put it forward as true.
- Checkable: passes — It can be checked against evidence.
- Load-bearing: fails — The paper’s conclusions may not depend on it.
- Based: passes — The paper gives a reason why it holds.
Probably not a substantial claim. The paper’s conclusions may not depend on it.
In the paper
“PGC-1α knockout mice show obvious neurodegenerative pathology (Lin et al., 2004)”
§ Metabolic reprogramming during neuronal differentiation from aerobic glycolysis to neuronal oxidative phosphorylation > Introduction
What the sources say
- Not checked yetcites Lin et al., 2004 source
plaindirect- Asserted: passes — The authors put it forward as true.
- Checkable: passes — It can be checked against evidence.
- Load-bearing: fails — The paper’s conclusions may not depend on it.
- Based: passes — The paper gives a reason why it holds.
Probably not a substantial claim. The paper’s conclusions may not depend on it.
A conclusion the paper draws from its own results — it cites no other source for it, so there is none to check. The quote shows it is in the paper.
In the paper
“indicating an unknown mechanism linking mitochondrial biogenesis to cell size”
§ Metabolic reprogramming during neuronal differentiation from aerobic glycolysis to neuronal oxidative phosphorylation > Abstract
hedgedcorrelational- Asserted: passes — The authors put it forward as true.
- Checkable: passes — It can be checked against evidence.
- Load-bearing: fails — The paper’s conclusions may not depend on it.
- Based: passes — The paper gives a reason why it holds.
Probably not a substantial claim. The paper’s conclusions may not depend on it.
In the paper
“A pioneering study using embryonic Xenopus retina revealed that neural progenitor cells (NPCs) are less reliant on oxidative phosphorylation for ATP production than are non-dividing differentiated neurons, and the transition from glycolysis to oxidative phosphorylation is tightly coupled to neuronal differentiation”
§ Metabolic reprogramming during neuronal differentiation from aerobic glycolysis to neuronal oxidative phosphorylation > Introduction
What the sources say
- Not checked yetcites Agathocleous et al., 2012
plaincorrelational- Asserted: passes — The authors put it forward as true.
- Checkable: passes — It can be checked against evidence.
- Load-bearing: passes — The paper’s conclusions depend on it.
- Based: passes — The paper gives a reason why it holds.
It may state two separate claims as one.
A conclusion the paper draws from its own results — it cites no other source for it, so there is none to check. The quote shows it is in the paper.
In the paper
“marks the transition from aerobic glycolysis in neural progenitor cells (NPC) to neuronal oxidative phosphorylation”
§ Metabolic reprogramming during neuronal differentiation from aerobic glycolysis to neuronal oxidative phosphorylation > Abstract
plaincorrelational- Asserted: passes — The authors put it forward as true.
- Checkable: passes — It can be checked against evidence.
- Load-bearing: passes — The paper’s conclusions depend on it.
- Based: passes — The paper gives a reason why it holds.
It may state two separate claims as one.
- Rests on an assumption: Neurons rely on oxidative phosphorylation to meet energy demands.
What the paper did — it cites no source for this, so there is none to check. The quote shows it is in the paper.
In the paper
“Only high-quality NPC lines containing more than 90% Sox2 and Nestin double-positive cells were used for experiments.”
§ Metabolic reprogramming during neuronal differentiation from aerobic glycolysis to neuronal oxidative phosphorylation > Result > Transcription profiling of neuronal differentiation from human NPCs
plain- Asserted: passes — The authors put it forward as true.
- Checkable: passes — It can be checked against evidence.
- Load-bearing: passes — The paper’s conclusions depend on it.
- Based: passes — The paper gives a reason why it holds.
Probably not a substantial claim.
None of the sources cited for this claim have been checked yet.
In the paper
“The drastic decreases in HK2 and LDHA, the two key enzymes supporting aerobic glycolysis (DeBerardinis and Thompson, 2012; Dang, 2012), are consistent with neurons not having high flux aerobic glycolysis and exhibiting low lactate production.”
§ Metabolic reprogramming during neuronal differentiation from aerobic glycolysis to neuronal oxidative phosphorylation > Result > HK2 and LDHA were off during neuronal differentiation
What the sources say
- Not checked yetcites DeBerardinis and Thompson, 2012
- Not checked yetcites Dang, 2012
plaincorrelational- Asserted: passes — The authors put it forward as true.
- Checkable: passes — It can be checked against evidence.
- Load-bearing: passes — The paper’s conclusions depend on it.
- Based: passes — The paper gives a reason why it holds.
It may state two separate claims as one.
In the paper
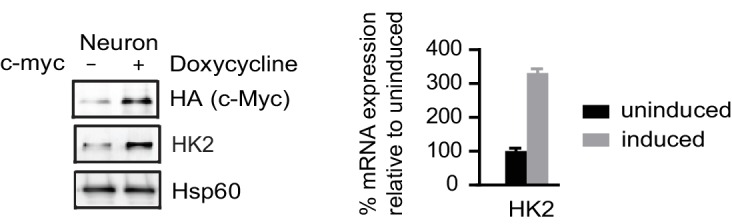
“MYC, a key transcription factor associated with cell cycle progression, directly activates HK2 and LDHA transcription, and the promoter regions of HK2 and LDHA contain MYC binding sites (5'-CACGTG-3'), also known as E box (Kim et al., 2004).”
§ Metabolic reprogramming during neuronal differentiation from aerobic glycolysis to neuronal oxidative phosphorylation > Result > HK2 and LDHA were off during neuronal differentiation
What the sources say
- Not checked yetcites Kim et al., 2004
plaindirect- Asserted: passes — The authors put it forward as true.
- Checkable: passes — It can be checked against evidence.
- Load-bearing: passes — The paper’s conclusions depend on it.
- Based: passes — The paper gives a reason why it holds.
It may state two separate claims as one.
In the paper
“Denton et al. (2016) also detected this splice form of OGDH in the whole brain tissue and pancreatic islets, calling it LS1, and, importantly, they confirmed that LS1 isoform is insensitive to Ca2+.”
§ Metabolic reprogramming during neuronal differentiation from aerobic glycolysis to neuronal oxidative phosphorylation > Result > Neuron-specific splicing of PKM and OGDH
What the sources say
- Not checked yetcites Denton et al., 2016
boosted- Asserted: passes — The authors put it forward as true.
- Checkable: passes — It can be checked against evidence.
- Load-bearing: passes — The paper’s conclusions depend on it.
- Based: passes — The paper gives a reason why it holds.
It may state two separate claims as one.
What the paper did — it cites no source for this, so there is none to check. The quote shows it is in the paper.
In the paper
“The median sequencing read yield for each sample was ~35 million 100-base reads, of which ~85% were mapped.”
§ Metabolic reprogramming during neuronal differentiation from aerobic glycolysis to neuronal oxidative phosphorylation > Result > Transcription profiling of neuronal differentiation from human NPCs
plain- Asserted: passes — The authors put it forward as true.
- Checkable: passes — It can be checked against evidence.
- Load-bearing: fails — The paper’s conclusions may not depend on it.
- Based: passes — The paper gives a reason why it holds.
Probably not a substantial claim. The paper’s conclusions may not depend on it. It may state two separate claims as one.
In the paper
“overexpression of PGC-1α in cardiac cells triggers the upregulation of hundreds of genes in glycolysis, TCA and mitochondrial respiratory complexes (Rowe et al., 2010).”
§ Metabolic reprogramming during neuronal differentiation from aerobic glycolysis to neuronal oxidative phosphorylation > Result > Increased neuronal PGC-1α/ERRγ maintained the transcription of glycolysis, TCA and mitochondrial genes
What the sources say
- Not checked yetcites Rowe et al., 2010
plaindirect- Asserted: passes — The authors put it forward as true.
- Checkable: passes — It can be checked against evidence.
- Load-bearing: fails — The paper’s conclusions may not depend on it.
- Based: passes — The paper gives a reason why it holds.
Probably not a substantial claim. The paper’s conclusions may not depend on it.
A conclusion the paper draws from its own results — it cites no other source for it, so there is none to check. The quote shows it is in the paper.
In the paper
“The results suggest that neurons cannot tolerate constitutive HK2 and LDHA expression and die during differentiation.”
§ Metabolic reprogramming during neuronal differentiation from aerobic glycolysis to neuronal oxidative phosphorylation > Result > Shutoff of aerobic glycolysis is critical for neuronal differentiation
hedgeddirect- Asserted: passes — The authors put it forward as true.
- Checkable: passes — It can be checked against evidence.
- Load-bearing: passes — The paper’s conclusions depend on it.
- Based: passes — The paper gives a reason why it holds.
It may state two separate claims as one.
A conclusion the paper draws from its own results — it cites no other source for it, so there is none to check. The quote shows it is in the paper.
In the paper
“It appears that although mitochondrial mass increases on a per cell basis, mitochondrial density remains largely unchanged during neuronal differentiation.”
§ Metabolic reprogramming during neuronal differentiation from aerobic glycolysis to neuronal oxidative phosphorylation > Result > Increased neuronal PGC-1α/ERRγ maintained the transcription of glycolysis, TCA and mitochondrial genes
hedged- Asserted: passes — The authors put it forward as true.
- Checkable: passes — It can be checked against evidence.
- Load-bearing: unclear — It is unclear whether the paper’s conclusions depend on it.
- Based: passes — The paper gives a reason why it holds.
It may state two separate claims as one.
In the paper
“A transcriptional circuit, including PGC-1 family coactivators, estrogen-related receptors (ERRs) and nuclear respiratory factor (NRF), is responsible for the transcription of metabolic and mitochondrial genes in multiple tissues, such as heart and skeletal muscle (Scarpulla et al., 2012).”
§ Metabolic reprogramming during neuronal differentiation from aerobic glycolysis to neuronal oxidative phosphorylation > Result > Increased neuronal PGC-1α/ERRγ maintained the transcription of glycolysis, TCA and mitochondrial genes
What the sources say
- Not checked yetcites Scarpulla et al., 2012 source
plaindirect- Asserted: passes — The authors put it forward as true.
- Checkable: passes — It can be checked against evidence.
- Load-bearing: fails — The paper’s conclusions may not depend on it.
- Based: passes — The paper gives a reason why it holds.
Probably not a substantial claim. The paper’s conclusions may not depend on it.
In the paper
“c-MYC and N-MYC redundantly promote neural progenitor cell proliferation in the developing brain, with the brains of double knockout mice exhibiting profoundly impaired growth (Wey and Knoepfler, 2010).”
§ Metabolic reprogramming during neuronal differentiation from aerobic glycolysis to neuronal oxidative phosphorylation > Result > HK2 and LDHA were off during neuronal differentiation
What the sources say
- Not checked yetcites Wey and Knoepfler, 2010
plaindirect- Asserted: passes — The authors put it forward as true.
- Checkable: passes — It can be checked against evidence.
- Load-bearing: unclear — It is unclear whether the paper’s conclusions depend on it.
- Based: passes — The paper gives a reason why it holds.
It may state two separate claims as one.
In the paper
“Functional induced neurons (iN) can be generated directly from fibroblasts by forced expression of neural specific transcription factors, a process also called transdifferentiation (Vierbuchen et al., 2010).”
§ Metabolic reprogramming during neuronal differentiation from aerobic glycolysis to neuronal oxidative phosphorylation > Result > LDHA is down-regulated in neurons directly converted from fibroblasts
What the sources say
- Not checked yetcites Vierbuchen et al., 2010 source
plaindirect- Asserted: passes — The authors put it forward as true.
- Checkable: passes — It can be checked against evidence.
- Load-bearing: passes — The paper’s conclusions depend on it.
- Based: passes — The paper gives a reason why it holds.
Probably not a substantial claim.
In the paper
“PGC-1α is induced in the neonatal mouse heart concurrent with the increase of mitochondrial energy-producing capacity (Lehman et al., 2000).”
§ Metabolic reprogramming during neuronal differentiation from aerobic glycolysis to neuronal oxidative phosphorylation > Result > Increased neuronal PGC-1α/ERRγ maintained the transcription of glycolysis, TCA and mitochondrial genes
What the sources say
- Not checked yetcites Lehman et al., 2000 source
plaincorrelational- Asserted: passes — The authors put it forward as true.
- Checkable: passes — It can be checked against evidence.
- Load-bearing: fails — The paper’s conclusions may not depend on it.
- Based: passes — The paper gives a reason why it holds.
Probably not a substantial claim. The paper’s conclusions may not depend on it.
In the paper
“PGC-1α not only stimulates the induction of NRF1, but also binds to and coactivates the transcriptional function of NRF1 in muscle cells (Wu et al., 1999).”
§ Metabolic reprogramming during neuronal differentiation from aerobic glycolysis to neuronal oxidative phosphorylation > Result > Increased neuronal PGC-1α/ERRγ maintained the transcription of glycolysis, TCA and mitochondrial genes
What the sources say
- Not checked yetcites Wu et al., 1999
plaindirect- Asserted: passes — The authors put it forward as true.
- Checkable: passes — It can be checked against evidence.
- Load-bearing: fails — The paper’s conclusions may not depend on it.
- Based: passes — The paper gives a reason why it holds.
Probably not a substantial claim. The paper’s conclusions may not depend on it. It may state two separate claims as one.
None of the sources cited for this claim have been checked yet.
In the paper
“UCP2 is critical for maintaining stem cell glycolytic metabolism, and its level decreases during differentiation (Zhang et al., 2011; Yu et al., 2013).”
§ Metabolic reprogramming during neuronal differentiation from aerobic glycolysis to neuronal oxidative phosphorylation > Discussion > Molecular changes that define the neuronal energy preference for oxidative phosphorylation
What the sources say
- Not checked yetcites Zhang et al., 2011
- Not checked yetcites Yu et al., 2013
plaindirect- Asserted: passes — The authors put it forward as true.
- Checkable: passes — It can be checked against evidence.
- Load-bearing: passes — The paper’s conclusions depend on it.
- Based: passes — The paper gives a reason why it holds.
It may state two separate claims as one.
In the paper
“MILS neurons also have very low expression of HK2 and LDHA, and do not exhibit a significant increase in mitochondrial density (Zheng et al., 2016).”
§ Metabolic reprogramming during neuronal differentiation from aerobic glycolysis to neuronal oxidative phosphorylation > Discussion > Molecular changes that define the neuronal energy preference for oxidative phosphorylation
What the sources say
- Not checked yetcites Zheng et al., 2016
plain- Asserted: passes — The authors put it forward as true.
- Checkable: passes — It can be checked against evidence.
- Load-bearing: passes — The paper’s conclusions depend on it.
- Based: passes — The paper gives a reason why it holds.
It may state two separate claims as one.
In the paper
“The critical role of LDHA in aerobic glycolysis has been proven in cancer cells, and LDHA depletion greatly decreases aerobic glycolysis and increases mitochondrial OXPHOS activity (Fantin et al., 2006).”
§ Metabolic reprogramming during neuronal differentiation from aerobic glycolysis to neuronal oxidative phosphorylation > Discussion > Molecular changes that define the neuronal energy preference for oxidative phosphorylation
What the sources say
- Not checked yetcites Fantin et al., 2006
boosteddirect- Asserted: passes — The authors put it forward as true.
- Checkable: passes — It can be checked against evidence.
- Load-bearing: passes — The paper’s conclusions depend on it.
- Based: passes — The paper gives a reason why it holds.
It may state two separate claims as one.
A conclusion the paper draws from its own results — it cites no other source for it, so there is none to check. The quote shows it is in the paper.
In the paper
“It appears that neurons cannot use aerobic glycolysis or mitochondrial biogenesis to compensate for energy shortage.”
§ Metabolic reprogramming during neuronal differentiation from aerobic glycolysis to neuronal oxidative phosphorylation > Discussion > Molecular changes that define the neuronal energy preference for oxidative phosphorylation
hedgedSingle case- Asserted: passes — The authors put it forward as true.
- Checkable: passes — It can be checked against evidence.
- Load-bearing: passes — The paper’s conclusions depend on it.
- Based: passes — The paper gives a reason why it holds.
It may state two separate claims as one.
In the paper
“The A4 isozyme kinetically favors the conversion from pyruvate to lactate, while the B4 isozyme prefer converting lactate to pyruvate (Cahn et al., 1962).”
§ Metabolic reprogramming during neuronal differentiation from aerobic glycolysis to neuronal oxidative phosphorylation > Discussion > Molecular changes that define the neuronal energy preference for oxidative phosphorylation
What the sources say
- Not checked yetcites Cahn et al., 1962
plaindirect- Asserted: passes — The authors put it forward as true.
- Checkable: passes — It can be checked against evidence.
- Load-bearing: passes — The paper’s conclusions depend on it.
- Based: passes — The paper gives a reason why it holds.
It may state two separate claims as one.
In the paper
“In an iPSC-based disease model of maternally inherited Leign syndrome (MILS), an early childhood neurodegenerative disease due to ATP synthase defect, we found that MILS neurons but not their NPCs show severe energy deficiency; MILS NPCs generate more lactate than healthy control NPCs.”
§ Metabolic reprogramming during neuronal differentiation from aerobic glycolysis to neuronal oxidative phosphorylation > Discussion > Molecular changes that define the neuronal energy preference for oxidative phosphorylation
What the sources say
- Not checked yetcites Zheng et al., 2016
plain- Asserted: passes — The authors put it forward as true.
- Checkable: passes — It can be checked against evidence.
- Load-bearing: passes — The paper’s conclusions depend on it.
- Based: passes — The paper gives a reason why it holds.
It may state two separate claims as one.
A conclusion the paper draws from its own results — it cites no other source for it, so there is none to check. The quote shows it is in the paper.
In the paper
“Glucose transporter levels dramatically decrease in neurons, which limits glucose uptake and the production of glycolytic pyruvate.”
§ Metabolic reprogramming during neuronal differentiation from aerobic glycolysis to neuronal oxidative phosphorylation > Discussion > Shut-off of aerobic glycolysis is critical for neuronal differentiation
plaindirect- Asserted: passes — The authors put it forward as true.
- Checkable: passes — It can be checked against evidence.
- Load-bearing: passes — The paper’s conclusions depend on it.
- Based: passes — The paper gives a reason why it holds.
It may state two separate claims as one.
A conclusion the paper draws from its own results — it cites no other source for it, so there is none to check. The quote shows it is in the paper.
In the paper
“Fourth, the decrease in expression of PDKs and the increase in PDPs may result in more active pyruvate dehydrogenase complexes (PDC), as demonstrated by decreased phosphorylation at Ser 300 of PDH E1 alpha protein (PDHA1), promoting pyruvate entry into the TCA cycle.”
§ Metabolic reprogramming during neuronal differentiation from aerobic glycolysis to neuronal oxidative phosphorylation > Discussion > Molecular changes that define the neuronal energy preference for oxidative phosphorylation
hedgedconditional- Asserted: passes — The authors put it forward as true.
- Checkable: passes — It can be checked against evidence.
- Load-bearing: passes — The paper’s conclusions depend on it.
- Based: passes — The paper gives a reason why it holds.
It may state two separate claims as one.
In the paper
“mitochondrial structure (cristae organization and size), dynamics (fusion and fission) and calcium concentration in the mitochondrial matrix are all involved in mitochondrial energy metabolism (Mishra and Chan, 2014).”
§ Metabolic reprogramming during neuronal differentiation from aerobic glycolysis to neuronal oxidative phosphorylation > Discussion > Molecular changes that define the neuronal energy preference for oxidative phosphorylation
What the sources say
- Not checked yetcites Mishra and Chan, 2014
plaincorrelational- Asserted: passes — The authors put it forward as true.
- Checkable: passes — It can be checked against evidence.
- Load-bearing: fails — The paper’s conclusions may not depend on it.
- Based: passes — The paper gives a reason why it holds.
Probably not a substantial claim. The paper’s conclusions may not depend on it. It may state two separate claims as one.
A conclusion the paper draws from its own results — it cites no other source for it, so there is none to check. The quote shows it is in the paper.
In the paper
“Third, the decreased expression of HK2, and the GLUT1 and GLUT3 glucose transporters reduce glucose entry, terminating high flux glycolysis.”
§ Metabolic reprogramming during neuronal differentiation from aerobic glycolysis to neuronal oxidative phosphorylation > Discussion > Molecular changes that define the neuronal energy preference for oxidative phosphorylation
plaindirect- Asserted: passes — The authors put it forward as true.
- Checkable: passes — It can be checked against evidence.
- Load-bearing: passes — The paper’s conclusions depend on it.
- Based: passes — The paper gives a reason why it holds.
It may state two separate claims as one.
What the paper did — it cites no source for this, so there is none to check. The quote shows it is in the paper.
In the paper
“For each time point, two experimental duplicates were used for each independent NPC line and its differentiated neurons.”
§ Metabolic reprogramming during neuronal differentiation from aerobic glycolysis to neuronal oxidative phosphorylation > Materials and methods > RNA sequencing
plain- Asserted: passes — The authors put it forward as true.
- Checkable: passes — It can be checked against evidence.
- Load-bearing: fails — The paper’s conclusions may not depend on it.
- Based: passes — The paper gives a reason why it holds.
Probably not a substantial claim. The paper’s conclusions may not depend on it.
In the paper
“in a high-throughput screen to identify small molecules interfering with mitochondrial abundance, hundreds of compounds were found to be capable of changing the cellular mitochondrial content; the majority of them also change cell size accordingly (Kitami et al., 2012)”
§ Metabolic reprogramming during neuronal differentiation from aerobic glycolysis to neuronal oxidative phosphorylation > Discussion > Metabolic and mitochondrial gene transcription control in proliferating and post-mitotic differentiated cells
What the sources say
- Not checked yetcites Kitami et al., 2012
plaincorrelational- Asserted: passes — The authors put it forward as true.
- Checkable: passes — It can be checked against evidence.
- Load-bearing: passes — The paper’s conclusions depend on it.
- Based: passes — The paper gives a reason why it holds.
It may state two separate claims as one.
What the paper did — it cites no source for this, so there is none to check. The quote shows it is in the paper.
In the paper
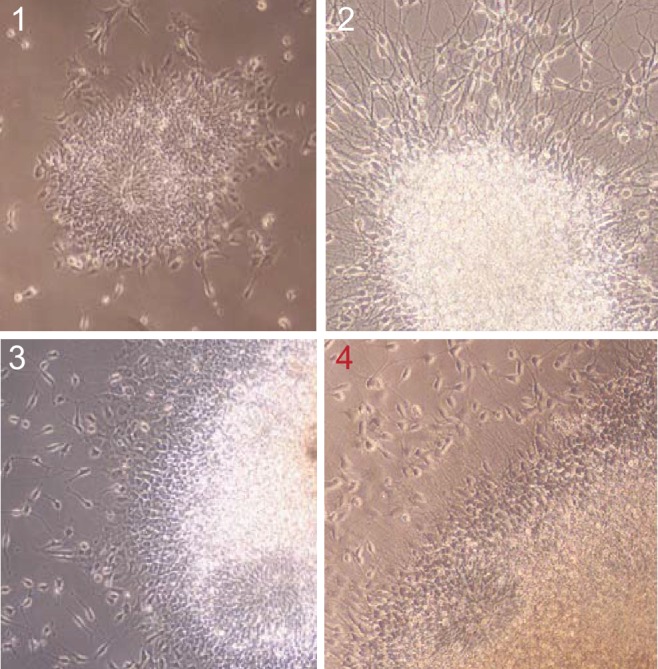
“This step is critical for the purity of NPCs; only colonies (type 4) showing sufficient maturity as described in Figure 1—figure supplement 2 were picked.”
§ Metabolic reprogramming during neuronal differentiation from aerobic glycolysis to neuronal oxidative phosphorylation > Materials and methods > Establishment of NPCs and neuronal differentiation
boosteddirect- Asserted: passes — The authors put it forward as true.
- Checkable: passes — It can be checked against evidence.
- Load-bearing: passes — The paper’s conclusions depend on it.
- Based: passes — The paper gives a reason why it holds.
Probably not a substantial claim.
None of the sources cited for this claim have been checked yet.
In the paper
“blocking neuronal oxidative utilization of lactate affects neuronal survival and even memory formation (Suzuki et al., 2011; Lee et al., 2012).”
§ Metabolic reprogramming during neuronal differentiation from aerobic glycolysis to neuronal oxidative phosphorylation > Discussion > Shut-off of aerobic glycolysis is critical for neuronal differentiation
What the sources say
plaindirect- Asserted: passes — The authors put it forward as true.
- Checkable: passes — It can be checked against evidence.
- Load-bearing: passes — The paper’s conclusions depend on it.
- Based: passes — The paper gives a reason why it holds.
It may state two separate claims as one.
In the paper
“c-MYC activation in the myocardium of adult mice induces mitochondrial biogenesis and glycolysis but reduces PGC-1α level (Ahuja et al., 2010).”
§ Metabolic reprogramming during neuronal differentiation from aerobic glycolysis to neuronal oxidative phosphorylation > Discussion > Metabolic and mitochondrial gene transcription control in proliferating and post-mitotic differentiated cells
What the sources say
- Not checked yetcites Ahuja et al., 2010
plaindirect- Asserted: passes — The authors put it forward as true.
- Checkable: passes — It can be checked against evidence.
- Load-bearing: fails — The paper’s conclusions may not depend on it.
- Based: passes — The paper gives a reason why it holds.
Probably not a substantial claim. The paper’s conclusions may not depend on it. It may state two separate claims as one.
What the paper did — it cites no source for this, so there is none to check. The quote shows it is in the paper.
In the paper
“RNA-seq experiments were performed with two NPC lines established from independent iPSC clones.”
§ Metabolic reprogramming during neuronal differentiation from aerobic glycolysis to neuronal oxidative phosphorylation > Materials and methods > RNA sequencing
plain- Asserted: passes — The authors put it forward as true.
- Checkable: passes — It can be checked against evidence.
- Load-bearing: fails — The paper’s conclusions may not depend on it.
- Based: passes — The paper gives a reason why it holds.
Probably not a substantial claim. The paper’s conclusions may not depend on it.
What the paper did — it cites no source for this, so there is none to check. The quote shows it is in the paper.
In the paper
“only samples with RIN greater than 8.5 were used for library preparation.”
§ Metabolic reprogramming during neuronal differentiation from aerobic glycolysis to neuronal oxidative phosphorylation > Materials and methods > RNA sequencing
plain- Asserted: passes — The authors put it forward as true.
- Checkable: passes — It can be checked against evidence.
- Load-bearing: fails — The paper’s conclusions may not depend on it.
- Based: passes — The paper gives a reason why it holds.
Probably not a substantial claim. The paper’s conclusions may not depend on it.
In the paper
“E2F also upregulates mitochondrial genes, a function conserved from flies to mammals (Ambrus et al., 2013).”
§ Metabolic reprogramming during neuronal differentiation from aerobic glycolysis to neuronal oxidative phosphorylation > Discussion > Metabolic and mitochondrial gene transcription control in proliferating and post-mitotic differentiated cells
What the sources say
- Not checked yetcites Ambrus et al., 2013
plaindirect- Asserted: passes — The authors put it forward as true.
- Checkable: passes — It can be checked against evidence.
- Load-bearing: fails — The paper’s conclusions may not depend on it.
- Based: passes — The paper gives a reason why it holds.
Probably not a substantial claim. The paper’s conclusions may not depend on it. It may state two separate claims as one.
A conclusion the paper draws from its own results — it cites no other source for it, so there is none to check. The quote shows it is in the paper.
In the paper
“indicating that glycolytic pyruvate deficiency is a major cause of death.”
§ Metabolic reprogramming during neuronal differentiation from aerobic glycolysis to neuronal oxidative phosphorylation > Discussion > Shut-off of aerobic glycolysis is critical for neuronal differentiation
hedgeddirect- Asserted: passes — The authors put it forward as true.
- Checkable: passes — It can be checked against evidence.
- Load-bearing: passes — The paper’s conclusions depend on it.
- Based: passes — The paper gives a reason why it holds.
The quote only partly states this claim.
The paper relies on this without support.
Little is known about the molecular basis of neurons' preference for oxidative phosphorylation or neuronal metabolic responses to energy crisis and their implications for disease progression.
“Little is known about the molecular basis of neurons’ preference for oxidative phosphorylation, or neuronal metabolic responses to the energy crisis and their implications for disease progression.”
The paper relies on this without support.
Neurons rely on oxidative phosphorylation to meet energy demands.
“Neurons rely on oxidative phosphorylation to meet energy demands.”
The paper relies on this without support.
Neurons rely on mitochondrial oxidative phosphorylation to meet energy demand.
“Neurons rely on mitochondrial oxidative phosphorylation to meet energy demand.”
The paper relies on this without support.
Aerobic glycolysis diverts pyruvate from mitochondrial oxidative phosphorylation for energy production by converting it into secreted lactate.
“As aerobic glycolysis diverts pyruvate from mitochondrial oxidative phosphorylation for energy production by converting it into secreted lactate”
The paper relies on this without support.
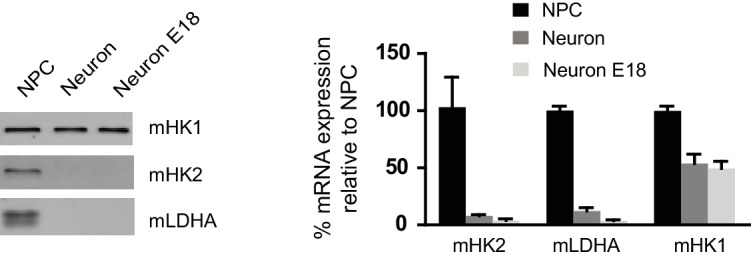
HK1 is still expressed in neurons.
“HK1 is still expressed in neurons”
The paper relies on this without support.
In proliferating NPCs, mitochondria are used for generation of biosynthetic precursors and mitochondria themselves have to be duplicated for daughter cells.
“mitochondria are used for generation of biosynthetic precursors in these proliferating cells, and mitochondria themselves have to be duplicated for daughter cells.”
The paper relies on this without support.
The expression levels of metabolic enzymes alone do not completely reflect their biochemical/physiological activities.
“the expression levels of metabolic enzymes alone do not completely reflect their biochemical/physiological activities”
Claims other papers make about this one
Each is checked against this paper’s own text: does it say what the citing paper says it does?
In the citing paper
“In multiple tissue contexts, adult stem cells have been found to primarily engage in aerobic glycolysis.”
From Regulation and function of the mammalian tricarboxylic acid cycle (2023) · cites this paper as [205]
In the citing paper
“Upon lineage commitment and differentiation, however, cells increase their oxidation of pyruvate in the TCA cycle and display enhanced OXPHOS (203, 204, 205).”
From Regulation and function of the mammalian tricarboxylic acid cycle (2023) · cites this paper as [205]
Self-check
Percentages, sums and reported differences re-computed from the paper’s own numbers.
Each contradiction between two passages listed here was confirmed by an independent check.
Rated minor: it would not touch a result — a value no result rests on, a p-value that stays on the same side of the significance level, or a conflict that is clerical, resolved elsewhere in the paper, or outside its own findings.
In the paper
§ Metabolic reprogramming during neuronal differentiation from aerobic glycolysis to neuronal oxidative phosphorylation > Result > HK2 and LDHA were off during neuronal differentiation
“BJ NPC cells at passage 3 were infected with lenti-shRNAs targeting HK2 or LDHA.”
§ Metabolic reprogramming during neuronal differentiation from aerobic glycolysis to neuronal oxidative phosphorylation > Result > HK2 and LDHA were off during neuronal differentiation
“NPCs at early passage (P2) were seeded in 24-well plates one day before infection.”
Rated minor: it would not touch a result — a value no result rests on, a p-value that stays on the same side of the significance level, or a conflict that is clerical, resolved elsewhere in the paper, or outside its own findings.
In the paper
§ Metabolic reprogramming during neuronal differentiation from aerobic glycolysis to neuronal oxidative phosphorylation > Result > Transcription profiling of neuronal differentiation from human NPCs
“(G, H, I and J) Relative expression levels of the key metabolic genes in glycolysis, tricarboxylic acid cycle (TCA), pyruvate dehydrogenase (PDH) complex and pentose phosphate pathway.”
§ Metabolic reprogramming during neuronal differentiation from aerobic glycolysis to neuronal oxidative phosphorylation > Result > Gene expression of glycolysis and TCA enzymes during neuronal differentiation
“Expression of the genes encoding the subunits of PDC itself, including PDHA1, PDHB, PDHX, DLAT, and DLD, showed no significant changes (Figure 1H).”
Citations
Cites
STAR: ultrafast universal RNA-seq aligner
Dobin, A., Davis, C. A., Schlesinger, F., Drenkow, J., Zaleski, C., Jha, S., Batut, P., Chaisson, M., & Gingeras, T. R. (2013) · Bioinformatics · doi:10.1093/bioinformatics/bts635 · Cited by 51,709 · cited 3×
“RNA-seq reactions were done on an Illumina HiSeq 2500 system (Illumina, San Diego, CA) and the sequenced reads were mapped to an annotated human genome (version GRch37/hg19) using STAR (Dobin et al., 2013).”
BackgroundMethodUnderstanding the Warburg Effect: The Metabolic Requirements of Cell Proliferation
Vander Heiden, M. G., Cantley, L. C., & Thompson, C. B. (2009) · Science · doi:10.1126/science.1160809 · Cited by 16,197 · cited 1×
“Most cancer cells use aerobic glycolysis to generate energy, a phenomenon called the Warburg effect, in which a large fraction of glycolytic pyruvate is converted into lactate (Vander Heiden et al., 2009).”
BackgroundTrapnell, C., Williams, B. A., Pertea, G., Mortazavi, A., Kwan, G., van Baren, M. J., Salzberg, S. L., Wold, B. J., & Pachter, L. (2010) · Nature Biotechnology · doi:10.1038/nbt.1621 · Cited by 15,556
Robinson, J. T., Thorvaldsdóttir, H., Winckler, W., Guttman, M., Lander, E. S., Getz, G., & Mesirov, J. P. (2011) · Nature Biotechnology · doi:10.1038/nbt.1754 · Cited by 15,390 · cited 3×
“…whether changes in alternative mRNA splicing occurred in glycolysis, TCA and mitochondrial respiratory complex genes during neuronal differentiation, the distributions of exonic RNA-seq reads were manually compared between NPCs and neurons using Integrative Genomics Viewer (Robinson et al., 2011).”
MethodInfluentialTrapnell, C., Roberts, A., Goff, L. A., Pertea, G. M., Kim, D., Kelley, D. R., Pimentel, H., Salzberg, S. L., Rinn, J. L., & Pachter, L. S. (2012) · Nature Protocols · doi:10.1038/nprot.2012.016 · Cited by 12,145 · cited 1×
“The sequencing reads were mapped to a human reference genome by STAR and assembled with Cufflinks (Dobin et al., 2013; Trapnell et al., 2012).”
MethodMitochondrial Dysfunction and Oxidative Stress in Neurodegenerative Diseases
Lin, M. T., & Beal, M. F. (2006) · Nature · doi:10.1038/nature05292 · Cited by 6,455
Zhang, Y., Chen, K., Sloan, S. A., Bennett, M. L., Scholze, A. R., O'Keeffe, S., Phatnani, H. P., Guarnieri, P., Caneda, C., Ruderisch, N., et al. (2014) · The Journal of Neuroscience · doi:10.1523/jneurosci.1860-14.2014 · Cited by 4,875 · cited 2×
“This result was consistent with a recent finding that mouse neurons exclusively expressed PKM1, whereas astrocytes only expressed PKM2 (Zhang et al., 2014).”
ResultWu, Z., Puigserver, P., Andersson, U., Zhang, C., Adelmant, G., Mootha, V., Troy, A., Cinti, S., Lowell, B., Scarpulla, R. C., et al. (1999) · Cell · doi:10.1016/s0092-8674(00)80611-x · Cited by 4,139 · cited 2×
“PGC-1a not only stimulates the induction of NRF1, but also binds to and coactivates the transcriptional function of NRF1 in muscle cells (Wu et al., 1999).”
BackgroundChronic systemic pesticide exposure reproduces features of Parkinson's disease
Betarbet, R. S., Sherer, T., MacKenzie, G. M., Garcia‐Osuna, M., Panov, A. V., & Greenamyre, J. T. (2000) · Nature Neuroscience · doi:10.1038/81834 · Cited by 3,770 · cited 1×
“For example, chronic exposure of the brain to the lipophilic pesticide rotenone causes dopaminergic neuron degeneration (Betarbet et al., 2000).”
BackgroundHypoxia-inducible factors in physiology and medicine
Semenza, G. L. (2012) · Cell · doi:10.1016/j.cell.2012.01.021 · Cited by 3,645 · cited 1×
“Moreover, under low oxygen condition, the transcription of glycolytic genes is upregu- lated by hypoxia-inducible factor (HIF), and increased glycolytic ATP produced by enhanced glyco- lytic flux can partially supply cellular energy demands (Iyer et al., 1998; Seagroves et al., 2001; Semenza, 2012).”
Background
Cited by
Sorted by citations
Regulation and metabolic functions of mTORC1 and mTORC2
Szwed, A., Kim, E., & Jacinto, E. (2021) · Physiological Reviews · doi:10.1152/physrev.00026.2020 · Cited by 855
Xiang, Y., Tanaka, Y., Patterson, B., Kang, Y., Govindaiah, G., Roselaar, N., Çakır, B., Kim, K.-Y., Lombroso, A., Hwang, S., et al. (2017) · Cell stem cell · doi:10.1016/j.stem.2017.07.007 · Cited by 711
Mitochondria at the neuronal presynapse in health and disease
Devine, M. J., & Kittler, J. T. (2018) · Nature reviews. Neuroscience · doi:10.1038/nrn.2017.170 · Cited by 636
Regulation and function of the mammalian tricarboxylic acid cycle
Arnold, P. K., & Finley, L. W. S. (2023) · Journal of Biological Chemistry · doi:10.1016/j.jbc.2022.102838 · Cited by 535
Direct cell reprogramming: approaches, mechanisms and progress
Wang, H., Yang, Y., Liu, J., & Li, Q. (2021) · Nature Reviews Molecular Cell Biology · doi:10.1038/s41580-021-00335-z · Cited by 463
Metadata
- Authors
- Zheng, X., Boyer, L., Jin, M., Mertens, J., Kim, Y., Ma, L., Ma, L., Hamm, M., Gage, F. H., & Hunter, T.
- Affiliations
- Salk Institute for Biological Studies (US)
- Laboratory of Genetics, Salk Institute, La Jolla, United States
- Corresponding author
- Gage, Fred H
- Hunter, Tony
- Venue
- eLife
- Publisher
- eLife Sciences Publications, Ltd
- Published
- 2016-06-10
- Volume
- 5
- ISSN
- 2050-084X (ISSN-L)
- PMC
- PMC4963198
- OpenAlex
- W2416068580
- Semantic Scholar
- fbed50febe18cd07bb8e0c7a00e748286b5070dc
- Cited by
- 671
- References
- 77
- Citations by year
- 2026: 82 · 2025: 76 · 2024: 84 · 2023: 81 · 2022: 74 · 2021: 85 · 2020: 65 · 2019: 49 · 2018: 39 · 2017: 33 · 2016: 1
- FWCI
- 20.80
- Type
- journal article
- Language
- en
- Open access
- gold
- doi.org
- Licence
- Locations
- eLife (publishedVersion, cc-by)
- Europe PMC (PubMed Central) (publishedVersion, cc-by)
- PubMed Central (publishedVersion, cc-by)
- PubMed (publishedVersion)
- DOAJ (DOAJ: Directory of Open Access Journals) (submittedVersion, cc-by-sa)
- Funders
- California Institute for Regenerative Medicine (TR2-01778)
- Salk Pioneer postdoctoral fellowship
- The G. Harold and Leila Y. Mathers Foundation
- JPB Foundation
- Leona M. and Harry B. Helmsley Charitable Trust (#2012-PG-MED002)
- National Institutes of Health (CA14195, CA80100, CA82683)
- Topics
- Life Sciences › Neuroscience › Developmental Neuroscience › Neurogenesis and neuroplasticity mechanisms
- Life Sciences › Biochemistry, Genetics and Molecular Biology › Cancer Research › Cancer, Hypoxia, and Metabolism
- Life Sciences › Biochemistry, Genetics and Molecular Biology › Molecular Biology › Metabolism, Diabetes, and Cancer
- Keywords
- metabolic reprogramming, neuronal differentiation, aerobic glycolysis, oxidative phosphorylation, hexokinase 2, LDHA, c-Myc, MYCN, PGC-1α, estrogen-related receptor gamma, mitochondrial biogenesis, neural progenitor cells, neuronal cell death, mitochondrial mass
- MeSH terms
- Aerobiosis, Cell Differentiation, Cells, Cultured, Glycolysis, Humans, Metabolism, Oxidative Phosphorylation, Gene Expression Regulation, Developmental, Neural Stem Cells
About these checks
Registry, retraction, Cites and statistics results are computed, not judged, with one exception: a printed reference that no index lists is read once by a model before it counts as a citation error. Claims are extracted by a model and kept only when their quote appears verbatim in the text; each cited source is then checked, with a model’s help, for whether it says what the claim relies on. Those verdicts can be wrong — read the claim’s quote and the cited source before relying on one.
A language model drew the claims from the paper on 2026-10-09, under version 3 of the claim definition (model deepseek-v4.1-flash, prompt extract-v3).
A second model labelled each claim on 2026-10-09 (model jev-1.13-20260917, definition revision gold-guideline-v0.2).
Statistics and arithmetic are recomputed, not judged.
Confidence bands are shown only for fields calibrated on our annotated test set. None is calibrated yet, so no band is shown.
What counts as a claim ›How we measure confidence ›How we check this ›
Are you an author, or do you see a problem with this page? Request a review
