The DOI matches its Crossref record; 85 of the 85 references it cites were found in a registry or an index.
Environmental cystine drives glutamine anaplerosis and sensitizes cancer cells to glutaminase inhibition
Open accessPublished version of a preprint
Abstract
Many mammalian cancer cell lines depend on glutamine as a major tri-carboxylic acid (TCA) cycle anaplerotic substrate to support proliferation. However, some cell lines that depend on glutamine anaplerosis in culture rely less on glutamine catabolism to proliferate in vivo. We sought to understand the environmental differences that cause differential dependence on glutamine for anaplerosis. We find that cells cultured in adult bovine serum, which better reflects nutrients available to cells in vivo, exhibit decreased glutamine catabolism and reduced reliance on glutamine anaplerosis compared to cells cultured in standard tissue culture conditions. We find that levels of a single nutrient, cystine, accounts for the differential dependence on glutamine in these different environmental contexts. Further, we show that cystine levels dictate glutamine dependence via the cystine/glutamate antiporter xCT/SLC7A11. Thus, xCT/SLC7A11 expression, in conjunction with environmental cystine, is necessary and sufficient to increase glutamine catabolism, defining important determinants of glutamine anaplerosis and glutaminase dependence in cancer.
Overview
The claims and statistics of this paper haven’t been checked yet.
Run the check — free, no account needed. It reads the open-access text and checks the sources it cites.
Integrity signals
Registry
Cites
Statistics
Figures
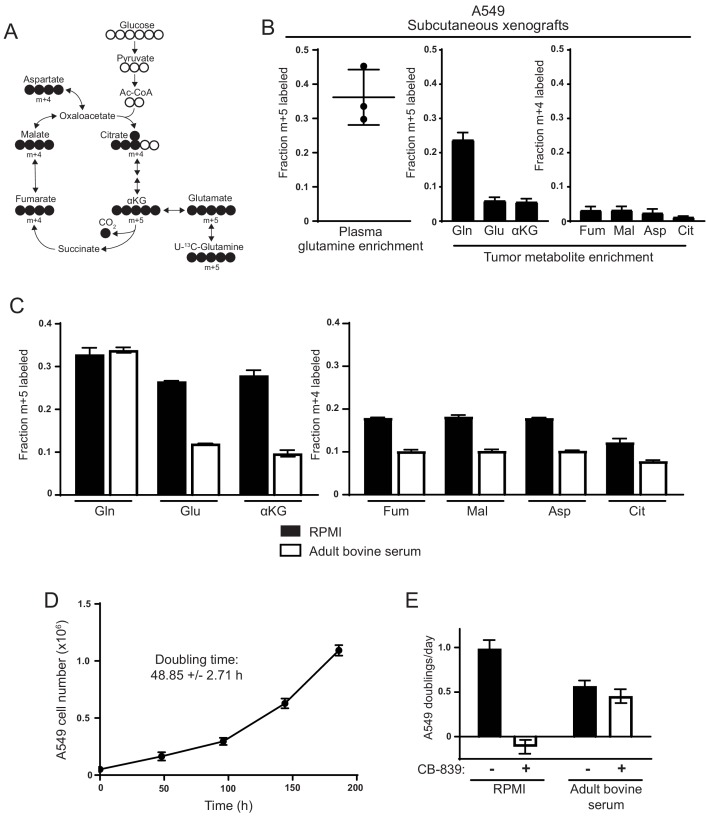
![Figure 1. Decreased use of glutamine for TCA cycle anaplerosis by A549 cells in tumors, and when cultured in adult bovine serum, compared to RPMI. (A) Diagram detailing how uniformly-labeled glutamine ([U-13C5]glutamine) can be metabolized to generate labeled glutamate, aspartate and TCA cycle intermediates via oxidative metabolism. (B) Left Plasma fractional labeling of fully labeled glutamine (m + 5) in A549 tumor bearing mice following a 6 hr infusion of [U-13C5]glutamine (n = 3). Right Intratumoral fractional labeling of glutamine (m + 5), glutamate (m + 5), α-ketoglutarate (m + 5), fumarate (m + 4), malate (m + 4), aspartate (m + 4) and citrate (m + 4) following a 6 hr infusion of [U-13C5]glutamine (n = 3). (C) M + 5 fractional labeling of glutamine, glutamate and α-ketoglutarate, and m + 4 fractional labeling of fumarate, malate, aspartate and citrate for A549 cells cultured for 8 hr in RPMI or adult bovine serum with [U-13C5]glutamine added to ~33% enrichment (n = 3). (D) A549 cell counts over time when cultured continuously in adult bovine serum for eight days (n = 3, each time point). Doubling time was determined by non-linear regression of an exponential growth equation to the growth curve. (E) Proliferation rate of A549 cells cultured in RPMI or adult bovine serum with vehicle (DMSO) or 1 µM CB-839 (n = 3) as indicated. For all panels, the values represent the mean and the error bars represent ± SD.](/paper-figures/ba659bc231b4422eb5845056014310ad/environmental-cystine-drives-glutamine-anaplerosis-and-sensitizes-cancer-cells-figure-1.jpg)
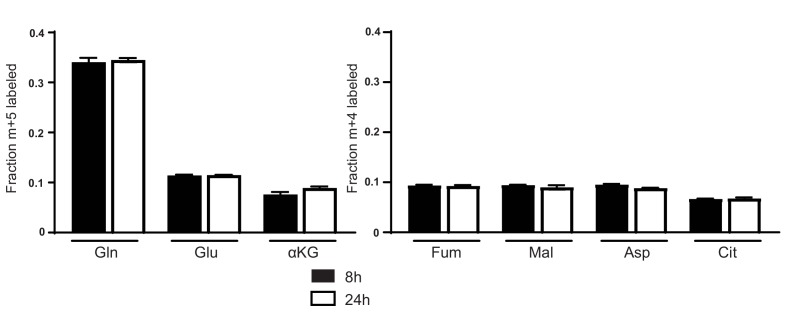
![Figure 1—figure supplement 1. Glutamine labeling of metabolites in A549 cells cultured in adult bovine serum reaches isotopic steady state by 8 hr. M + 5 fractional labeling of glutamine, glutamate and α-ketoglutarate, and m + 4 labeling of fumarate, malate, aspartate and citrate for A549 cells cultured for 8 hr or 24 hr in adult bovine serum with [U-13C5]glutamine added to ~33% enrichment (n = 3) is shown. The values represent the mean and the error bars represent ± SD.](/paper-figures/fb120cb816064230895ecbac77116961/environmental-cystine-drives-glutamine-anaplerosis-and-sensitizes-cancer-cells-figure-2.jpg)
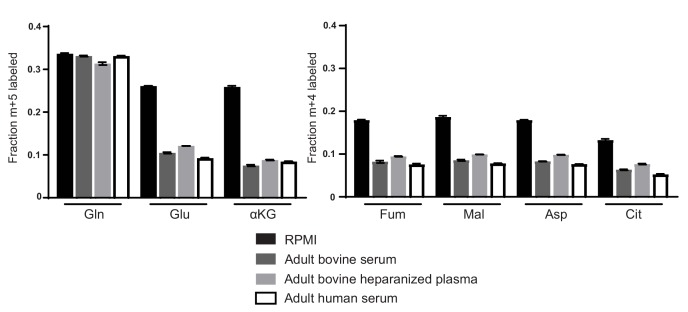
![Figure 1—figure supplement 2. Decreased glutamine anaplerosis is not unique to serum or bovine derived blood products. M + 5 fractional labeling of glutamine, glutamate and α-ketoglutarate, and m + 4 labeling of fumarate, malate, aspartate and citrate for A549 cells cultured for 8 hr in RPMI, adult bovine serum, adult bovine heparinized plasma or adult human serum with [U-13C5]glutamine added to ~33% enrichment (n = 3). The values represent the mean and the error bars represent ± SD.](/paper-figures/fd0f83d7d10c416596650a0ac10403f0/environmental-cystine-drives-glutamine-anaplerosis-and-sensitizes-cancer-cells-figure-3.jpg)
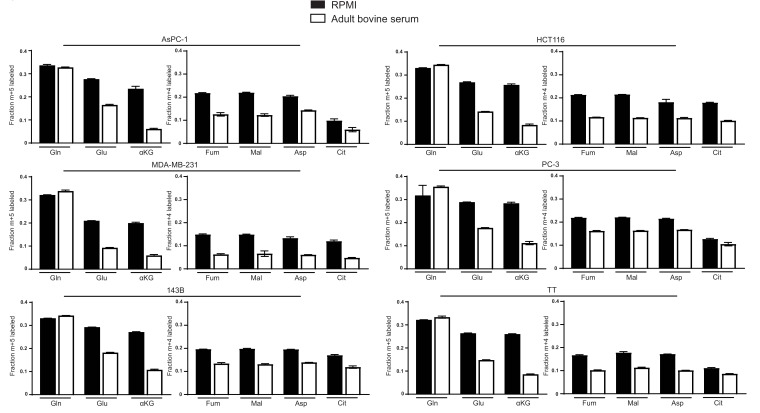
![Figure 1—figure supplement 3. Decreased glutamine anaplerosis in adult bovine serum is not unique to A549 cells. M + 5 fractional labeling of glutamine, glutamate and α-ketoglutarate, and m + 4 fractional labeling of fumarate, malate, aspartate and citrate for the indicated cell lines cultured for 8 hr in RPMI or adult bovine serum with [U-13C5]glutamine added to ~33% enrichment (n = 3) The values represent the mean and the error bars represent ± SD.](/paper-figures/feb97bd75f7b4182b95a8e177372e3b9/environmental-cystine-drives-glutamine-anaplerosis-and-sensitizes-cancer-cells-figure-4.jpg)
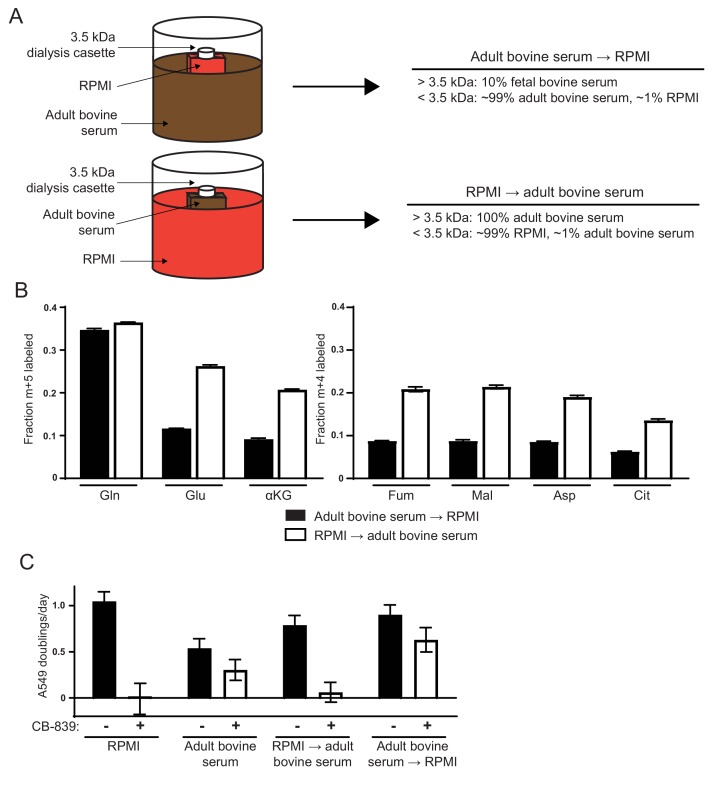
![Figure 2. Differences in the small molecule (<3.5 kDa) fraction between RPMI and adult bovine serum account for differences in glutamine anaplerosis and sensitivity to glutaminase inhibition. (A) Diagram detailing the generation of top ‘Adult bovine serum → RPMI’ and bottom ‘RPMI → adult bovine serum’. To make each dialyzed medium, 210 mL of RPMI or adult bovine serum was dialyzed twice against 4 L of adult bovine serum or RPMI respectively using 70 mL capacity 3.5 kDa cutoff dialysis cassettes. (B) M + 5 fractional labeling of glutamine, glutamate and α-ketoglutarate, and m + 4 labeling of fumarate, malate, aspartate and citrate for A549 cells cultured for 8 hr in ‘Adult bovine serum → RPMI’ and ‘RPMI → adult bovine serum’ with [U-13C5]glutamine added to each media at ~33% enrichment (n = 3). (C) Proliferation rates of A549 cells cultured in RPMI, adult bovine serum, ‘RPMI → adult bovine serum’, ‘Adult bovine serum → RPMI’ with vehicle (DMSO) or 1 µM CB-839 (n = 3). For all panels, the values represent the mean and the error bars represent ± SD.](/paper-figures/75943363c83d447a9c646545f5b76cac/environmental-cystine-drives-glutamine-anaplerosis-and-sensitizes-cancer-cells-figure-2.jpg)
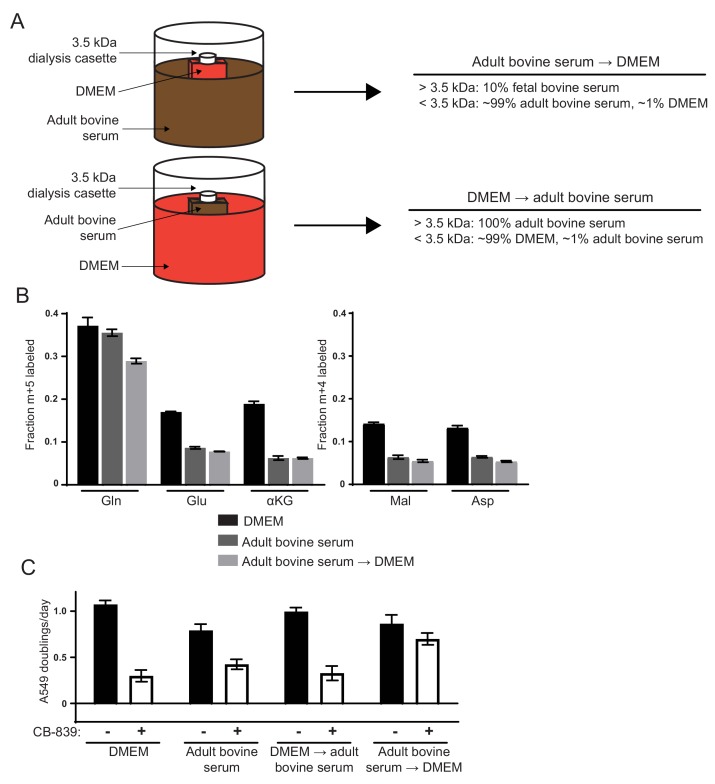
![Figure 2—figure supplement 1. Differences in the small molecule (<3.5 kDa) fraction between DMEM and adult bovine serum account for differences in glutamine anaplerosis and sensitivity to glutaminase inhibition. (A) Diagram detailing the generation of top ‘Adult bovine serum → DMEM’ and bottom ‘DMEM → adult bovine serum’. To make each dialyzed medium, 210 mL of DMEM or adult bovine serum was dialyzed twice against 4 L of adult bovine serum or DMEM respectively using 70 mL capacity 3.5 kDa cutoff dialysis cassettes. (B) M + 5 fractional labeling of glutamine, glutamate and α-ketoglutarate, and m + 4 labeling of fumarate, malate, aspartate and citrate for A549 cells cultured for 8 hr in DMEM, adult bovine serum and ‘Adult bovine serum → DMEM’ with [U-13C5]glutamine added to each media at ~33% enrichment (n = 3). (C) Proliferation rates of A549 cells cultured in DMEM, adult bovine serum, ‘DMEM → adult bovine serum’, ‘Adult bovine serum → DMEM’ with vehicle (DMSO) or 1 µM CB-839 (n = 3). For all panels, the values represent the mean and the error bars represent ± SD.](/paper-figures/0f2b7c5306924c86b09a080a18ef44e4/environmental-cystine-drives-glutamine-anaplerosis-and-sensitizes-cancer-cells-figure-6.jpg)
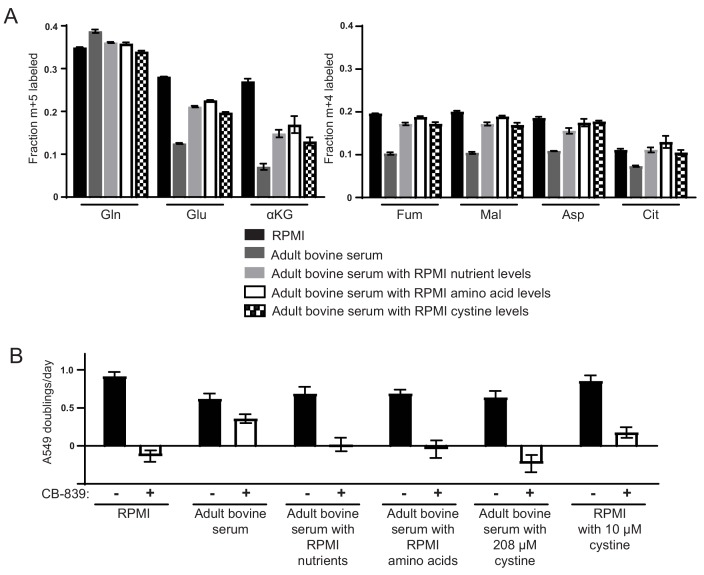
![Figure 3. High levels of cystine enhance glutamine anaplerosis and potentiate the effects of the glutaminase inhibitor CB-839. (A) M + 5 fractional labeling of glutamine, glutamate and α-ketoglutarate, and m + 4 labeling of fumarate, malate, aspartate and citrate is shown for A549 cells cultured for 8 hr in RPMI, adult bovine serum, adult bovine serum with RPMI nutrient levels, adult bovine serum with RPMI amino acid levels and adult bovine serum with 208 µM cystine added (RPMI cystine levels). Each medium included [U-13C5]glutamine added to ~33% enrichment (n = 3). (B) The proliferation of A549 cells cultured in the same media defined in (A) and RPMI containing 10 µM cystine with vehicle (DMSO) or 1 µM CB-839 as indicated (n = 3). For all panels, the values represent the mean and the error bars represent ± SD.](/paper-figures/38a96c3568a54e62919496d2d926a37c/environmental-cystine-drives-glutamine-anaplerosis-and-sensitizes-cancer-cells-figure-3.jpg)


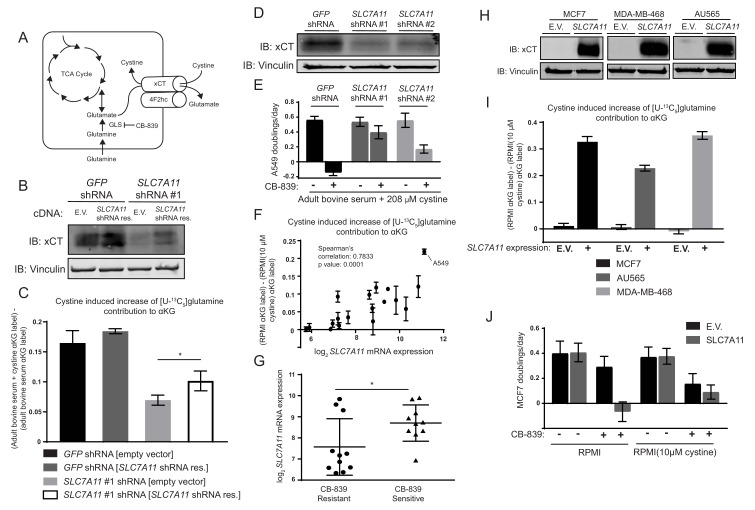
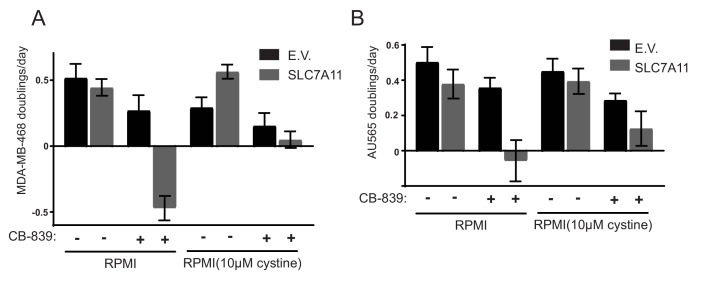
![Figure 4. The cystine/glutamate antiporter xCT/SLC7A11 is necessary and sufficient for cystine induced glutamine anaplerosis and CB-839 sensitivity. (A) System xc– is a plasma membrane antiporter composed of two polypeptides, xCT (encoded by SLC7A11) and 4F2hc/CD98 (encoded by SLC3A2), that exchanges intracellular glutamate for extracellular cystine. (B) A549 cells were infected with lentiviruses encoding a SLC7A11 targeting shRNA or a control shRNA targeting GFP as indicated. These cells were then infected with retroviruses expressing either shRNA resistant SLC7A11 cDNA or empty vector (E.V.) as indicated. Shown is an immunoblot analysis of these modified cell lines for xCT protein expression with vinculin as a loading control. (C) The four cell lines from (B) were cultured for 8 hr in adult bovine serum or adult bovine serum with 208 µM cystine. Each medium included [U-13C5]glutamine added to ~33% enrichment (n = 3). M + 5 fractional labeling of α-ketoglutarate and glutamine for each cell line in each condition was determined. Shown is the difference in m + 5 fractional label of α-ketoglutarate (normalized to m + 5 fractional enrichment of glutamine) between adult bovine serum with 208 µM cystine and adult bovine serum. We define this as the ‘cystine induced increase of glutamine contribution to αKG’. (D) Immunoblot analysis of A549 cells infected with lentiviruses encoding SLC7A11 targeting shRNAs or a control shRNA targeting GFP as indicated. (E) Proliferation rates of cell lines from (D) cultured in adult bovine serum with 208 µM cystine with vehicle (DMSO) or 1 µM CB-839 is shown (n = 3). (F) Multiple cell lines (see Figure 4—source data 1 for identity of cell lines) were cultured for 8 hr in RPMI or RPMI with 10 µM cystine. Each medium included [U-13C5]glutamine added to ~33% enrichment (n = 2–3). M + 5 fractional labeling of α-ketoglutarate and glutamine for each cell line in each condition was determined. Shown is ‘cystine induced increase of glutamine contribution to αKG’ defined as the difference of m + 5 fractional label of α-ketoglutarate (normalized to m + 5 fractional enrichment of glutamine) between RPMI and RPMI with 10 µM cystine for a given cell line. This term is plotted against SLC7A11 mRNA expression data obtained from the cancer cell line encyclopedia (CCLE) (Barretina et al., 2012). (G) SLC7A11 mRNA expression data from the CCLE is shown for breast cancer cell lines reported to be CB-839 resistant (IC50 >1 µM) or CB-839 sensitive (IC50 <1 µM) (Gross et al., 2014). Difference in SLC7A11 expression between the two groups was tested by two-tailed unpaired t-test. (H) Indicated cell lines were infected with lentiviruses encoding SLC7A11 cDNA or empty vector (E.V.). Shown is an immunoblot analysis of xCT protein expression for these modified cell lines with vinculin expression presented as a loading control. (I) Cystine induced increase of glutamine contribution to αKG was determined as in (F) for the cell lines described in (H). (J) Proliferation rates for MCF7 cells without (E.V.) or with SLC7A11 expression cultured in RPMI or RPMI with 10 µM cystine in the presence of vehicle (DMSO) or 1 µM CB-839 as indicated. For all panels, values represent the mean and the error bars represent ± SD. P values were calculated using a two-tailed unpaired t tests. * indicates p<0.05; ** indicates p<0.01; *** indicates p<0.001.](/paper-figures/a81e54645ea6479580f60f129d8ff7d6/environmental-cystine-drives-glutamine-anaplerosis-and-sensitizes-cancer-cells-figure-4.jpg)


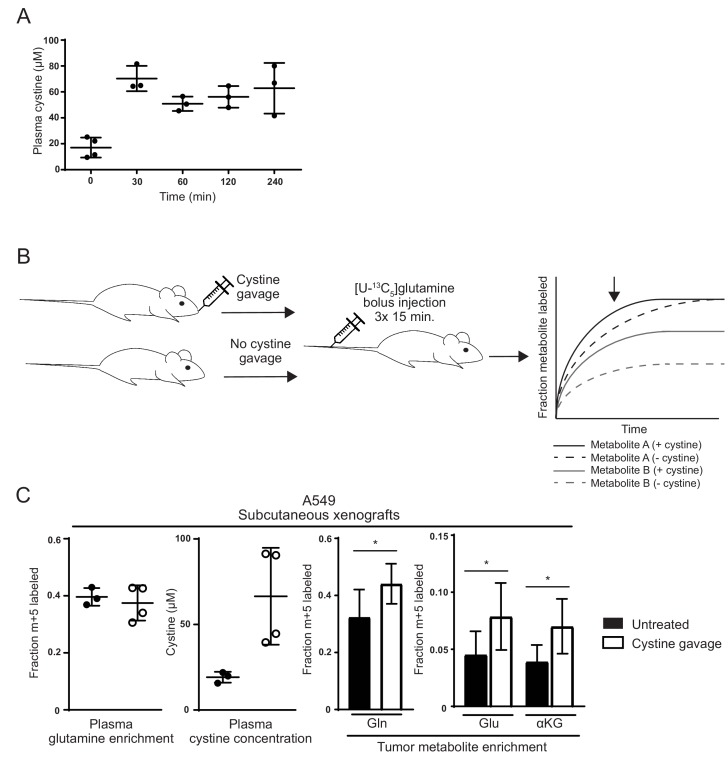
![Figure 5. Raising cystine levels increases glutamine metabolism in tumors. (A) nu/nu mice were treated with 2.4 g/kg cystine by oral gavage, and plasma from these animals was collected at the indicated time points. Cystine concentration in plasma at each time point as determined by GC-MS is shown. (B) Schematic diagram of cystine administration to tumor bearing mice, followed by bolus I.V. injections of [U-13C5]glutamine,and analysis of intratumoral metabolite labeling during the period of kinetic labeling. Shown in the graph are hypothetical labeling patterns of two metabolites over time after glutamine injection. Metabolite A (shown in black) is labeled by glutamine faster in the presence of cystine, but the level of steady state labeling is unaffected. Metabolite B (shown in gray) is labeled by glutamine faster in the presence of cystine and also to a greater extent at steady state. We harvest and analyze tumors in the pre-steady state period of labeling as indicated by the arrow, and thus it is not possible to determine to what extent an increase in labeling is due to faster labeling kinetics or increased steady state contribution of the label to the given metabolite. (C) A549 tumor bearing mice were treated (n = 4) or not (n = 3) with oral cystine prior to three bolus [U-13C5]glutamine injections every 15 min. Plasma and tumor tissue was then harvested 15 min after the last injection (described in Materials and methods). Left Enrichment of m + 5 glutamine and cystine concentration in the plasma of these animals. Right Fractional labeling of glutamine (m + 5), glutamate (m + 5), α-ketoglutarate (m + 5) in A549 tumor tissue. For all panels, the values represent the mean and the error bars represent ± SD. P values were calculated using a two-tailed unpaired t tests. * indicates p<0.05; ** indicates p<0.01; *** indicates p<0.001.](/paper-figures/fcebead47c6345aaa217cc36d83342a4/environmental-cystine-drives-glutamine-anaplerosis-and-sensitizes-cancer-cells-figure-5.jpg)
Verification
Claims the paper makes
The claims and statistics of this paper haven’t been checked yet.
Run the check — free, no account needed. It reads the open-access text and checks the sources it cites.
Claims other papers make about this one
Each is checked against this paper’s own text: does it say what the citing paper says it does?
In the citing paper
“implying that xc− may constitute a therapeutic target in this setting [553, 554].”
From Molecular mechanisms of cell death: recommendations of the nomenclature committee on cell death 2018. (2018) · cites this paper as [554]
In the citing paper
“the pronounced addiction of triple-negative breast carcinoma to glutamine relates (at least in part) to its ability to drive cystine uptake via xc−, implying that xc− may constitute a therapeutic target in this setting [553, 554].”
From Molecular mechanisms of cell death: recommendations of the nomenclature committee on cell death 2018. (2018) · cites this paper as [554]
In the citing paper
“However, environmental factors may also come into play, as for instance, the availability of extracellular as discussed below, can influence the dependence of cancer cells on glutamine metabolism73.”
From The metabolic landscape of RAS-driven cancers from biology to therapy (2021) · cites this paper as [73]
In the citing paper
“As shown in Fig. 3, glutamine is a direct fuel for the use of glutathione as a source of glutamate and is indirectly responsible for cystine uptake via the xCT antiporter system, which takes up cystine and simultaneously secretes glutamate61.”
From Glutamine reliance in cell metabolism (2020) · cites this paper as [61]
In the citing paper
“However, sensitivity to GLS inhibition in vitro is not always consistent in vivo, and is dependent on extracellular cystine levels.40”
From The multifaceted contributions of mitochondria to cellular metabolism (2018) · cites this paper as [40]
Self-check
Percentages, sums and reported differences re-computed from the paper’s own numbers.
The self-check needs the paper’s full text.
Citations
Cites
1 retracted
Li, J., Csibi, A., Yang, S., Hoffman, G. R., Li, C., Zhang, E. Y., Yu, J. J., & Blenis, J. (2014) · Proceedings of the National Academy of Sciences · doi:10.1073/pnas.1417015112 · Cited by 55
RetractedHallmarks of Cancer: The Next Generation
Hanahan, D., & Weinberg, R. A. (2011) · Cell · doi:10.1016/j.cell.2011.02.013 · Cited by 66,590
The Cancer Cell Line Encyclopedia enables predictive modelling of anticancer drug sensitivity
Barretina, J., Caponigro, G., Stransky, N., Venkatesan, K., Margolin, A. A., Kim, S., Wilson, C. J., Lehár, J., Kryukov, G. V., Sonkin, D., et al. (2012) · Nature · doi:10.1038/nature11003 · Cited by 7,950
Genome-scale CRISPR-Cas9 knockout screening in human cells
Shalem, O., Sanjana, N. E., Hartenian, E., Shi, X., Scott, D. A., Mikkelsen, T. S., Heckl, D., Ebert, B. L., Root, D. E., Doench, J. G., et al. (2014) · Science · doi:10.1126/science.1247005 · Cited by 5,234
The metabolism of tumors in the body
Warburg, O., Wind, F., & Negelein, E. (1927) · Journal of General Physiology · doi:10.1085/jgp.8.6.519 · Cited by 4,416
Fundamentals of Cancer Metabolism
DeBerardinis, R. J., & Chandel, N. S. (2016) · Science Advances · doi:10.1126/sciadv.1600200 · Cited by 3,013
DeBerardinis, R. J., Mancuso, A., Daikhin, E., Nissim, I., Yudkoff, M., Wehrli, S., & Thompson, C. B. (2007) · Proceedings of the National Academy of Sciences · doi:10.1073/pnas.0709747104 · Cited by 2,622
Understanding the Intersections between Metabolism and Cancer Biology
Heiden, M. G. V., & DeBerardinis, R. J. (2017) · Cell · doi:10.1016/j.cell.2016.12.039 · Cited by 2,369
Gao, P., Tchernyshyov, I., Chang, T.-C., Lee, Y.-S., Kita, K., Ochi, T., Zeller, K. I., De Marzo, A. M., Van Eyk, J. E., Mendell, J. T., et al. (2009) · Nature · doi:10.1038/nature07823 · Cited by 2,124
From Krebs to clinic: glutamine metabolism to cancer therapy
Altman, B. J., Stine, Z. E., & Dang, C. V. (2016) · Nature Reviews Cancer · doi:10.1038/nrc.2016.71 · Cited by 2,119
Cited by
Sorted by citations
Galluzzi, L., Vitale, I., Aaronson, S. A., Abrams, J. M., Adam, D., Agostinis, P., Alnemri, E. S., Altucci, L., Amelio, I., Andrews, D. W., et al. (2018) · Cell Death & Differentiation · doi:10.1038/s41418-017-0012-4 · Cited by 6,680
Cystine transporter SLC7A11/xCT in cancer: ferroptosis, nutrient dependency, and cancer therapy
Koppula, P., Zhuang, L., & Gan, B. (2020) · Protein & Cell · doi:10.1007/s13238-020-00789-5 · Cited by 2,640
The multifaceted contributions of mitochondria to cellular metabolism
Spinelli, J. B., & Haigis, M. C. (2018) · Nature Cell Biology · doi:10.1038/s41556-018-0124-1 · Cited by 1,935
Metabolic regulation of cell growth and proliferation
Zhu, J., & Thompson, C. B. (2019) · Nature Reviews Molecular Cell Biology · doi:10.1038/s41580-019-0123-5 · Cited by 1,154
The development of the concept of ferroptosis
Hirschhorn, T., & Stockwell, B. R. (2019) · Free Radical Biology and Medicine · doi:10.1016/j.freeradbiomed.2018.09.043 · Cited by 1,052
Metadata
- Authors
- Muir, A., Danai, L. V., Gui, D. Y., Waingarten, C. Y., Lewis, C. A., & Vander Heiden, M. G.
- Affiliations
- Koch Institute for Integrative Cancer Research At MIT (US)
- Whitehead Institute for Biomedical Research (US)
- Koch Institute for Integrative Cancer Research and Department of Biology, Massachusetts Institute of Technology, Cambridge, United States
- Venue
- eLife
- Publisher
- eLife Sciences Publications, Ltd
- Published
- 2017-08-15
- Volume
- 6
- ISSN
- 2050-084X (ISSN-L)
- PMC
- PMC5589418
- OpenAlex
- W2606822414
- Cited by
- 311
- References
- 85
- Citations by year
- 2026: 19 · 2025: 26 · 2024: 37 · 2023: 36 · 2022: 29 · 2021: 39 · 2020: 52 · 2019: 42 · 2018: 22 · 2017: 8
- FWCI
- 11.39
- Type
- journal article
- Language
- en
- Open access
- gold
- doi.org
- Licence
- Locations
- eLife (publishedVersion, cc-by)
- bioRxiv (Cold Spring Harbor Laboratory) (acceptedVersion, cc-by-nc)
- Europe PMC (PubMed Central) (publishedVersion, cc-by)
- PubMed Central (publishedVersion, cc-by)
- PubMed (publishedVersion)
- DOAJ (DOAJ: Directory of Open Access Journals) (submittedVersion, cc-by-sa)
- DSpace@MIT (Massachusetts Institute of Technology) (submittedVersion, cc-by-nc)
- Funders
- National Institutes of Health (R01 CA168653, R01 CA201276, P30CA1405141, F32CA213810, F32CA210421, T32GM007753)
- Lustgarten Foundation (Research Investigator Award)
- Stand Up To Cancer (Innovative Research Grant)
- Ludwig Institute for Cancer Research (Ludwig Center at MIT)
- Howard Hughes Medical Institute (HHMI Faculty Scholar)
- Topics
- Life Sciences › Biochemistry, Genetics and Molecular Biology › Cancer Research › Cancer, Hypoxia, and Metabolism
- Life Sciences › Biochemistry, Genetics and Molecular Biology › Biochemistry › Amino Acid Enzymes and Metabolism
- Life Sciences › Biochemistry, Genetics and Molecular Biology › Biochemistry › Sulfur Compounds in Biology
- Keywords
- cystine, glutamine anaplerosis, glutaminase inhibition, SLC7A11, glutamine catabolism, TCA cycle, cancer metabolism, bovine serum, culture medium composition, glutamine addiction
- MeSH terms
- Animals, Cattle, Cystine, Glutaminase, Glutamine, Humans, Mice, Nude, Neoplasms, Tumor Cells, Cultured, Amino Acid Transport System y+, Cell Proliferation, Tumor Microenvironment
About these checks
Registry, retraction, Cites and statistics results are computed, not judged, with one exception: a printed reference that no index lists is read once by a model before it counts as a citation error. Claims are extracted by a model and kept only when their quote appears verbatim in the text; each cited source is then checked, with a model’s help, for whether it says what the claim relies on. Those verdicts can be wrong — read the claim’s quote and the cited source before relying on one.
Statistics and arithmetic are recomputed, not judged.
Confidence bands are shown only for fields calibrated on our annotated test set. None is calibrated yet, so no band is shown.
What counts as a claim ›How we measure confidence ›How we check this ›
Are you an author, or do you see a problem with this page? Request a review