

The DOI matches its Crossref record; 85 of the 85 references it cites were found in a registry or an index.
Environmental cystine drives glutamine anaplerosis and sensitizes cancer cells to glutaminase inhibition
Open accessPublished version of a preprint
Abstract
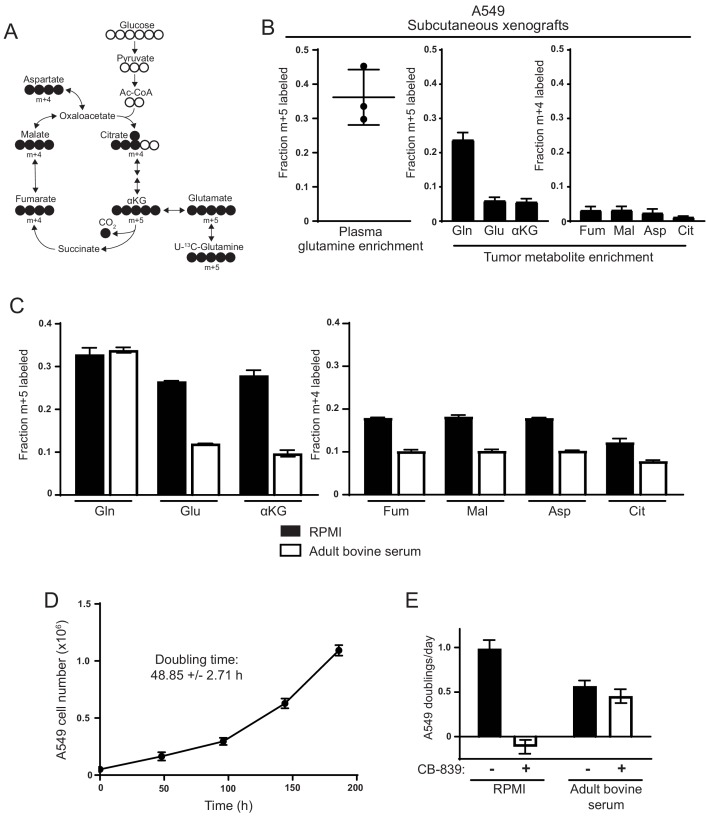
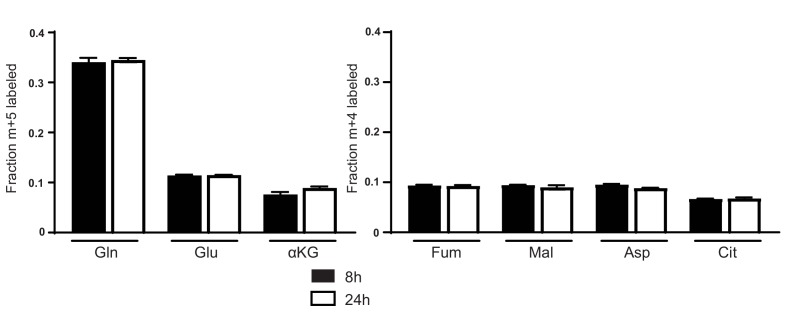
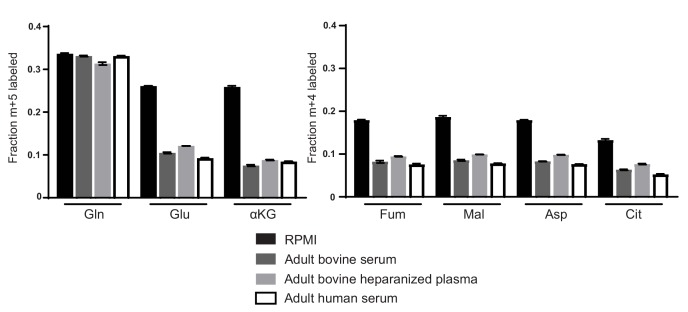
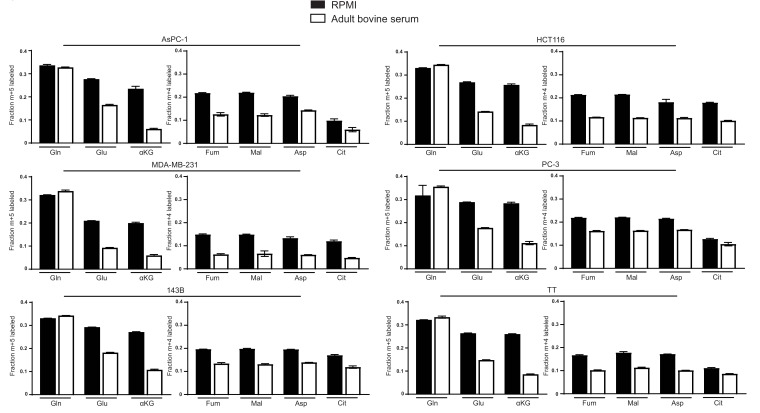
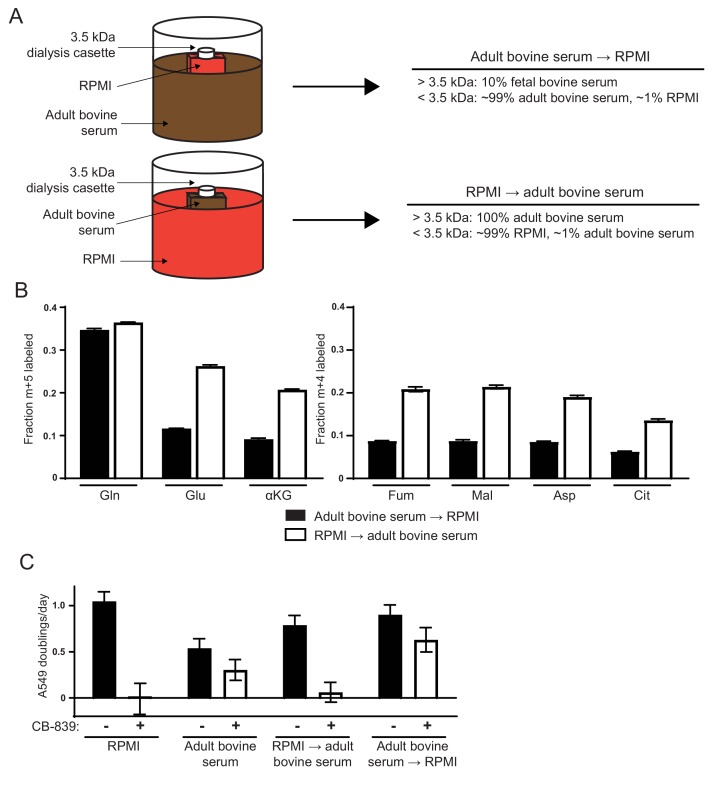
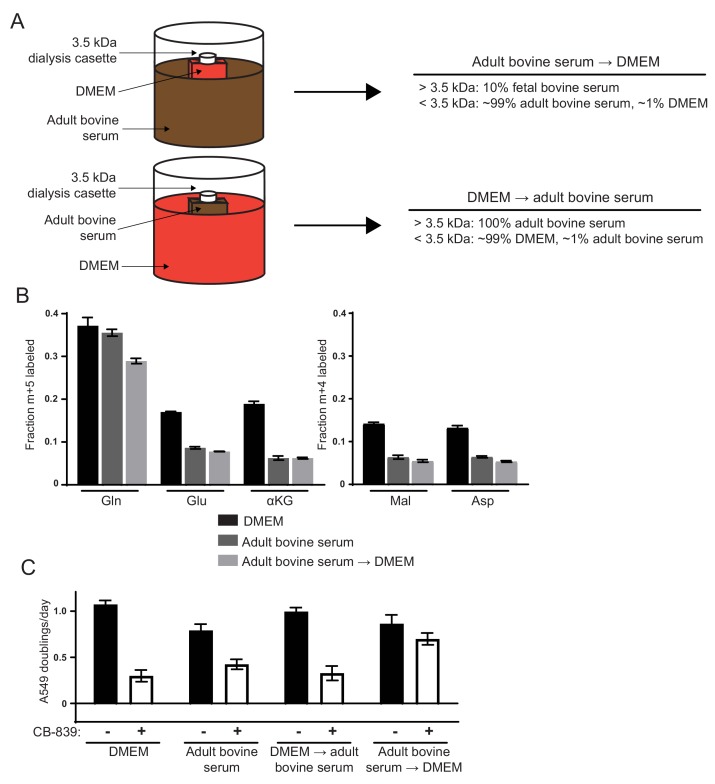
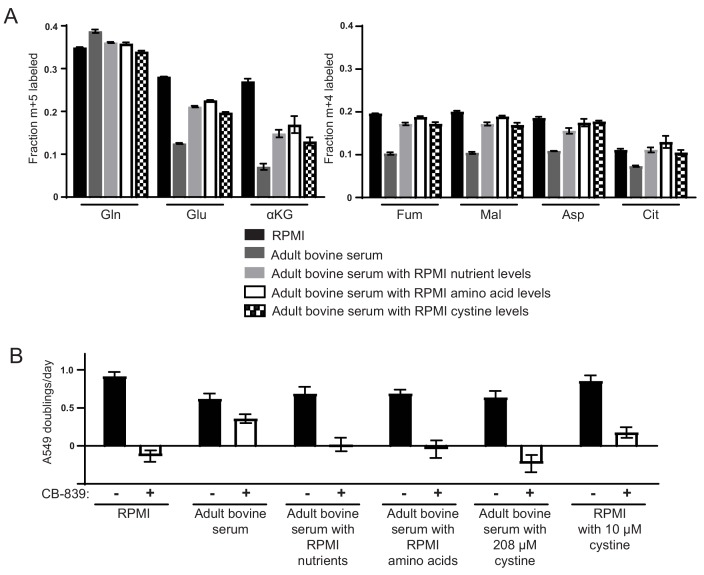
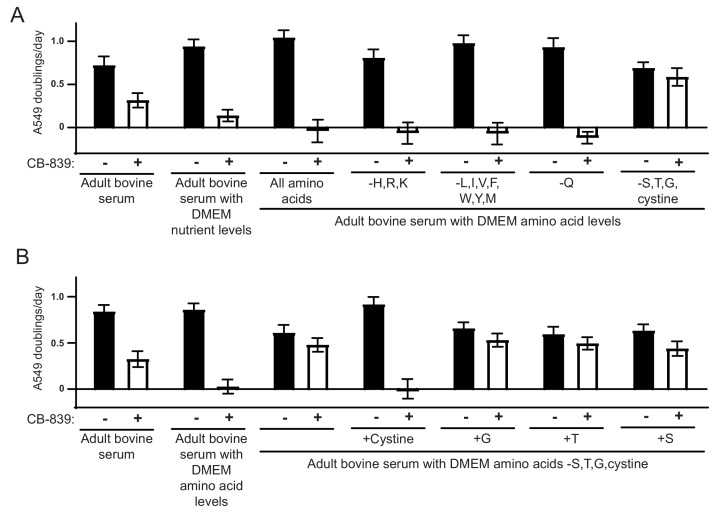
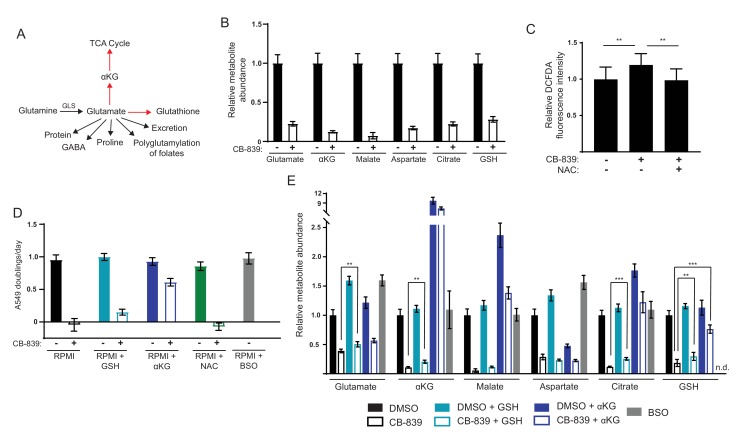
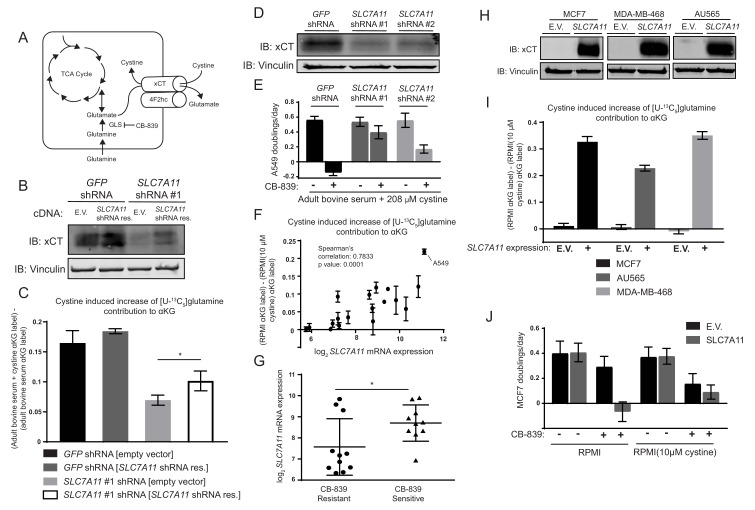
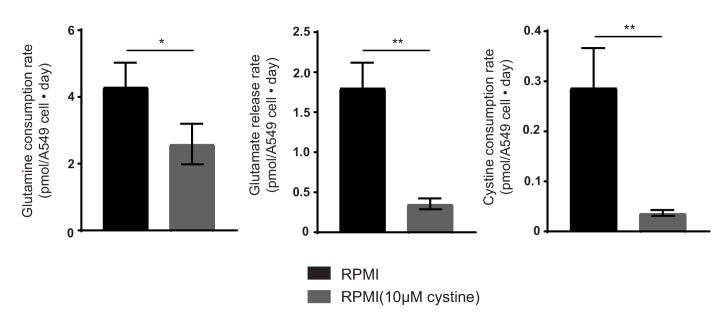
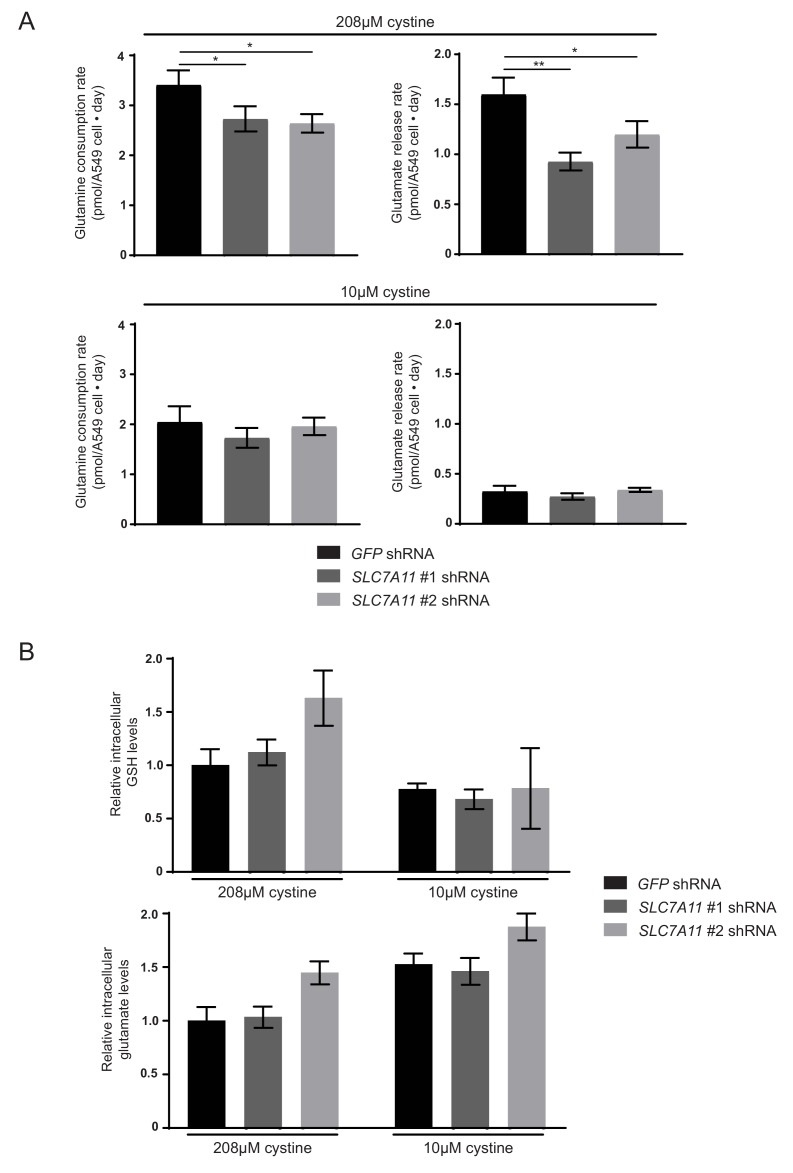
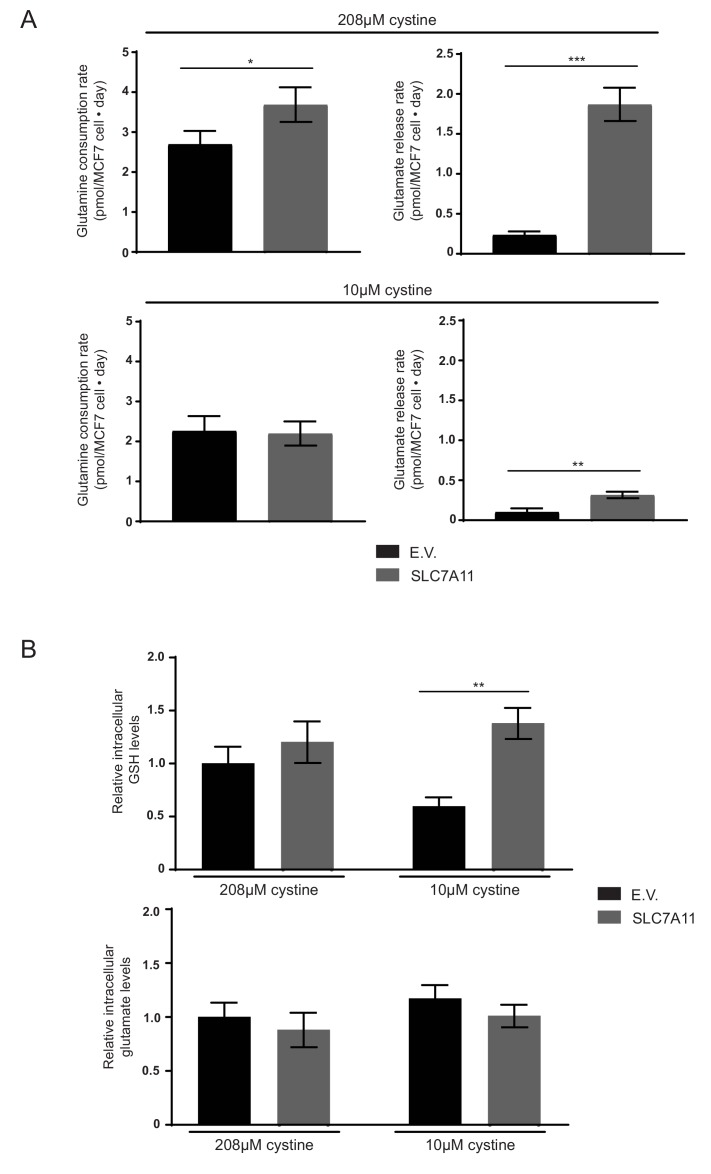
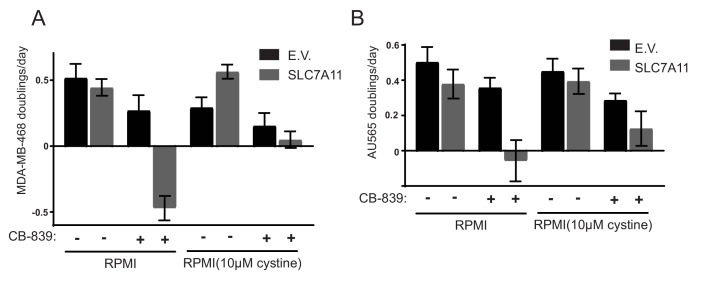
Many mammalian cancer cell lines depend on glutamine as a major tri-carboxylic acid (TCA) cycle anaplerotic substrate to support proliferation. However, some cell lines that depend on glutamine anaplerosis in culture rely less on glutamine catabolism to proliferate in vivo. We sought to understand the environmental differences that cause differential dependence on glutamine for anaplerosis. We find that cells cultured in adult bovine serum, which better reflects nutrients available to cells in vivo, exhibit decreased glutamine catabolism and reduced reliance on glutamine anaplerosis compared to cells cultured in standard tissue culture conditions. We find that levels of a single nutrient, cystine, accounts for the differential dependence on glutamine in these different environmental contexts. Further, we show that cystine levels dictate glutamine dependence via the cystine/glutamate antiporter xCT/SLC7A11. Thus, xCT/SLC7A11 expression, in conjunction with environmental cystine, is necessary and sufficient to increase glutamine catabolism, defining important determinants of glutamine anaplerosis and glutaminase dependence in cancer.
Overview
The claims and statistics of this paper haven’t been checked yet.
Run the check — free, no account needed. It reads the open-access text and checks the sources it cites.
Integrity signals
Registry
Cites
Statistics
Figures
Verification
Claims the paper makes
The claims and statistics of this paper haven’t been checked yet.
Run the check — free, no account needed. It reads the open-access text and checks the sources it cites.
Claims other papers make about this one
Each is checked against this paper’s own text: does it say what the citing paper says it does?
In the citing paper
“implying that xc− may constitute a therapeutic target in this setting [553, 554].”
From Molecular mechanisms of cell death: recommendations of the nomenclature committee on cell death 2018. (2018) · cites this paper as [554]
In the citing paper
“the pronounced addiction of triple-negative breast carcinoma to glutamine relates (at least in part) to its ability to drive cystine uptake via xc−, implying that xc− may constitute a therapeutic target in this setting [553, 554].”
From Molecular mechanisms of cell death: recommendations of the nomenclature committee on cell death 2018. (2018) · cites this paper as [554]
In the citing paper
“However, environmental factors may also come into play, as for instance, the availability of extracellular as discussed below, can influence the dependence of cancer cells on glutamine metabolism73.”
From The metabolic landscape of RAS-driven cancers from biology to therapy (2021) · cites this paper as [73]
In the citing paper
“As shown in Fig. 3, glutamine is a direct fuel for the use of glutathione as a source of glutamate and is indirectly responsible for cystine uptake via the xCT antiporter system, which takes up cystine and simultaneously secretes glutamate61.”
From Glutamine reliance in cell metabolism (2020) · cites this paper as [61]
In the citing paper
“However, sensitivity to GLS inhibition in vitro is not always consistent in vivo, and is dependent on extracellular cystine levels.40”
From The multifaceted contributions of mitochondria to cellular metabolism (2018) · cites this paper as [40]
Self-check
Percentages, sums and reported differences re-computed from the paper’s own numbers.
The self-check needs the paper’s full text.
Citations
Cites
1 retracted
Li, J., Csibi, A., Yang, S., Hoffman, G. R., Li, C., Zhang, E. Y., Yu, J. J., & Blenis, J. (2014) · Proceedings of the National Academy of Sciences · doi:10.1073/pnas.1417015112 · Cited by 55
RetractedHallmarks of Cancer: The Next Generation
Hanahan, D., & Weinberg, R. A. (2011) · Cell · doi:10.1016/j.cell.2011.02.013 · Cited by 66,590
The Cancer Cell Line Encyclopedia enables predictive modelling of anticancer drug sensitivity
Barretina, J., Caponigro, G., Stransky, N., Venkatesan, K., Margolin, A. A., Kim, S., Wilson, C. J., Lehár, J., Kryukov, G. V., Sonkin, D., et al. (2012) · Nature · doi:10.1038/nature11003 · Cited by 7,950
Genome-scale CRISPR-Cas9 knockout screening in human cells
Shalem, O., Sanjana, N. E., Hartenian, E., Shi, X., Scott, D. A., Mikkelsen, T. S., Heckl, D., Ebert, B. L., Root, D. E., Doench, J. G., et al. (2014) · Science · doi:10.1126/science.1247005 · Cited by 5,234
The metabolism of tumors in the body
Warburg, O., Wind, F., & Negelein, E. (1927) · Journal of General Physiology · doi:10.1085/jgp.8.6.519 · Cited by 4,416
Fundamentals of Cancer Metabolism
DeBerardinis, R. J., & Chandel, N. S. (2016) · Science Advances · doi:10.1126/sciadv.1600200 · Cited by 3,013
DeBerardinis, R. J., Mancuso, A., Daikhin, E., Nissim, I., Yudkoff, M., Wehrli, S., & Thompson, C. B. (2007) · Proceedings of the National Academy of Sciences · doi:10.1073/pnas.0709747104 · Cited by 2,622
Understanding the Intersections between Metabolism and Cancer Biology
Heiden, M. G. V., & DeBerardinis, R. J. (2017) · Cell · doi:10.1016/j.cell.2016.12.039 · Cited by 2,369
Gao, P., Tchernyshyov, I., Chang, T.-C., Lee, Y.-S., Kita, K., Ochi, T., Zeller, K. I., De Marzo, A. M., Van Eyk, J. E., Mendell, J. T., et al. (2009) · Nature · doi:10.1038/nature07823 · Cited by 2,124
From Krebs to clinic: glutamine metabolism to cancer therapy
Altman, B. J., Stine, Z. E., & Dang, C. V. (2016) · Nature Reviews Cancer · doi:10.1038/nrc.2016.71 · Cited by 2,119
Wise, D. R., DeBerardinis, R. J., Mancuso, A., Sayed, N., Zhang, X.-Y., Pfeiffer, H. K., Nissim, I., Daikhin, E., Yudkoff, M., McMahon, S. B., et al. (2008) · Proceedings of the National Academy of Sciences · doi:10.1073/pnas.0810199105 · Cited by 2,001
Glutamine supports pancreatic cancer growth through a KRAS-regulated metabolic pathway
Son, J., Lyssiotis, C. A., Ying, H., Wang, X., Hua, S., Ligorio, M., Perera, R. M., Ferrone, C. R., Mullarky, E., Shyh-Chang, N., et al. (2013) · Nature · doi:10.1038/nature12040 · Cited by 1,990
Glutamine addiction: a new therapeutic target in cancer
Wise, D. R., & Thompson, C. B. (2010) · Trends in Biochemical Sciences · doi:10.1016/j.tibs.2010.05.003 · Cited by 1,770
Nutrition Needs of Mammalian Cells in Tissue Culture
Eagle, H. (1955) · Science · doi:10.1126/science.122.3168.501 · Cited by 1,619
High-Resolution CRISPR Screens Reveal Fitness Genes and Genotype-Specific Cancer Liabilities.
Hart, T., Chandrashekhar, M., Aregger, M., Steinhart, Z., Brown, K. R., MacLeod, G., Mis, M., Zimmermann, M., Fradet-Turcotte, A., Sun, S., et al. (2015) · Cell · doi:10.1016/j.cell.2015.11.015 · Cited by 1,571
Metabolite profiling identifies a key role for glycine in rapid cancer cell proliferation
Jain, M., Nilsson, R., Sharma, S., Madhusudhan, N., Kitami, T., Souza, A. L., Kafri, R., Kirschner, M. W., Clish, C. B., & Mootha, V. K. (2012) · Science · doi:10.1126/science.1218595 · Cited by 1,403
Q's next: the diverse functions of glutamine in metabolism, cell biology and cancer
DeBerardinis, R. J., & Cheng, T. (2010) · Oncogene · doi:10.1038/onc.2009.358 · Cited by 1,365
Glutamine and cancer: cell biology, physiology, and clinical opportunities
Hensley, C. T., Wasti, A. T., & DeBerardinis, R. J. (2013) · Journal of Clinical Investigation · doi:10.1172/jci69600 · Cited by 1,262
Supporting aspartate biosynthesis is an essential function of respiration in proliferating cells
Sullivan, L. B., Gui, D. Y., Hosios, A. M., Bush, L. N., Freinkman, E., & Vander Heiden, M. G. (2015) · Cell · doi:10.1016/j.cell.2015.07.017 · Cited by 1,173
Self-citationMetabolic heterogeneity in human lung tumors
Hensley, C. T., Faubert, B., Yuan, Q., Lev-Cohain, N., Jin, E., Kim, J., Jiang, L., Ko, B., Skelton, R., Loudat, L., et al. (2016) · Cell · doi:10.1016/j.cell.2015.12.034 · Cited by 1,138
Glucose-Independent Glutamine Metabolism via TCA Cycling for Proliferation and Survival in B Cells
Le, A., Lane, A. N., Hamaker, M., Bose, S., Gouw, A., Barbi, J., Tsukamoto, T., Rojas, C. J., Slusher, B. S., Zhang, H., et al. (2012) · Cell Metabolism · doi:10.1016/j.cmet.2011.12.009 · Cited by 1,095
Antitumor activity of the glutaminase inhibitor CB-839 in triple-negative breast cancer
Gross, M. I., Demo, S. D., Dennison, J. B., Chen, L., Chernov-Rogan, T., Goyal, B., Janes, J. R., Laidig, G. J., Lewis, E. R., Li, J., et al. (2014) · Molecular Cancer Therapeutics · doi:10.1158/1535-7163.mct-13-0870 · Cited by 1,068
Lewerenz, J., Hewett, S. J., Huang, Y. S., Lambros, M. P., Gout, P. W., Kalivas, P. W., Massie, A., Smolders, I. J., Methner, A., Pergande, M., et al. (2012) · Antioxidants and Redox Signaling · doi:10.1089/ars.2011.4391 · Cited by 1,021
Wise, D. R., Ward, P. S., Shay, J. E. S., Cross, J. R., Gruber, J. J., Sachdeva, U. M., Platt, J. M., DeMatteo, R. G., Simon, M. C., & Thompson, C. B. (2011) · Proceedings of the National Academy of Sciences · doi:10.1073/pnas.1117773108 · Cited by 975
A Versatile Viral System for Expression and Depletion of Proteins in Mammalian Cells
Campeau, E., Ruhl, V. E., Rodier, F., Smith, C. L., Rahmberg, B. L., Fuss, J. O., Campisi, J., Yaswen, P., Cooper, P. K., & Kaufman, P. D. (2009) · PLoS ONE · doi:10.1371/journal.pone.0006529 · Cited by 962
Targeting Mitochondrial Glutaminase Activity Inhibits Oncogenic Transformation
Wang, J.-B., Erickson, J. W., Fuji, R., Ramachandran, S., Gao, P., Dinavahi, R., Wilson, K. F., Ambrosio, A. L. B., Dias, S. M. G., Dang, C. V., et al. (2010) · Cancer Cell · doi:10.1016/j.ccr.2010.08.009 · Cited by 821
Schug, Z. T., Peck, B., Jones, D. T., Zhang, Q., Grosskurth, S., Alam, I. S., Goodwin, L. M., Smethurst, E., Mason, S., Blyth, K., et al. (2015) · Cancer Cell · doi:10.1016/j.ccell.2014.12.002 · Cited by 820
Culture of Normal Human Leukocytes
Moore, G. E. (1967) · JAMA · doi:10.1001/jama.1967.03120080053007 · Cited by 777
Small Molecule Modulators of Keap1‐ Nrf2‐ ARE Pathway as Potential Preventive and Therapeutic Agents
Magesh, S., Chen, Y., & Hu, L. (2012) · Medicinal Research Reviews · doi:10.1002/med.21257 · Cited by 760 · cited 2×
“Interest in modulating the antioxidant response pathway has led to the development of a number of NRF2-activating compounds, some of which are already in clinical use (Davies et al., 2016; Gao et al., 2014; Magesh et al., 2012).”
BackgroundAcetate is a bioenergetic substrate for human glioblastoma and brain metastases
Mashimo, T., Pichumani, K., Vemireddy, V., Hatanpaa, K. J., Singh, D. K., Sirasanagandla, S., Nannepaga, S., Piccirillo, S. G., Kovacs, Z., Foong, C., et al. (2014) · Cell · doi:10.1016/j.cell.2014.11.025 · Cited by 760
Environment impacts the metabolic dependencies of Ras-driven non-small cell lung cancer
Davidson, S. M., Papagiannakopoulos, T., Olenchock, B. A., Heyman, J. E., Keibler, M. A., Luengo, A., Bauer, M. R., Jha, A. K., O’Brien, J. P., Pierce, K. A., et al. (2016) · Cell Metabolism · doi:10.1016/j.cmet.2016.01.007 · Cited by 737
Self-citationDeficiency in glutamine but not glucose induces MYC-dependent apoptosis in human cells
Yuneva, M., Zamboni, N., Oefner, P., Sachidanandam, R., & Lazebnik, Y. (2007) · The Journal of Cell Biology · doi:10.1083/jcb.200703099 · Cited by 690 · cited 1×
“Instead, glutamine metabolism is important for TCA cycle anaplerosis in multiple contexts (Altman et al., 2016; DeBerardinis et al., 2007; Yuneva et al., 2007).”
BackgroundRegulation of Glutaminase Activity and Glutamine Metabolism
Curthoys, N. P., & Watford, M. (1995) · Annual Review of Nutrition · doi:10.1146/annurev.nu.15.070195.001025 · Cited by 676
The ABCs of membrane transporters in health and disease (SLC series): Introduction
Hediger, M. A., Clémençon, B., Burrier, R. E., & Bruford, E. A. (2013) · Molecular Aspects of Medicine · doi:10.1016/j.mam.2012.12.009 · Cited by 647
Hosios, A. M., Hecht, V. C., Danai, L. V., Johnson, M. O., Rathmell, J. C., Steinhauser, M. L., Manalis, S. R., & Vander Heiden, M. G. (2016) · Developmental Cell · doi:10.1016/j.devcel.2016.02.012 · Cited by 641
Self-citationThe metabolic profile of tumors depends on both the responsible genetic lesion and tissue type
Yuneva, M. O., Fan, T. W. M., Allen, T. D., Higashi, R. M., Ferraris, D. V., Tsukamoto, T., Matés, J. M., Alonso, F. J., Wang, C., Seo, Y., et al. (2012) · Cell Metabolism · doi:10.1016/j.cmet.2011.12.015 · Cited by 639
Wang, T., Yu, H., Hughes, N. W., Liu, B., Kendirli, A., Klein, K., Chen, W. W., Lander, E. S., & Sabatini, D. M. (2017) · Cell · doi:10.1016/j.cell.2017.01.013 · Cited by 632
A simple method for site-directed mutagenesis using the polymerase chain reaction
Hemsley, A., Arnheim, N., Toney, M. D., Cortopassi, G. A., & Galas, D. J. (1989) · Nucleic Acids Research · doi:10.1093/nar/17.16.6545 · Cited by 605
Timmerman, L. A., Holton, T., Yuneva, M., Louie, R. J., Padró, M., Daemen, A., Hu, M., Chan, D. A., Ethier, S. P., van ‘t Veer, L. J., et al. (2013) · Cancer Cell · doi:10.1016/j.ccr.2013.08.020 · Cited by 573
Krebs, H. A. (1935) · Biochemical Journal · doi:10.1042/bj0291951 · Cited by 571
Tracing compartmentalized NADPH metabolism in the cytosol and mitochondria of mammalian cells
Lewis, C. A., Parker, S. J., Fiske, B. P., McCloskey, D., Gui, D. Y., Green, C. R., Vokes, N. I., Feist, A. M., Vander Heiden, M. G., & Metallo, C. M. (2014) · Molecular Cell · doi:10.1016/j.molcel.2014.05.008 · Cited by 562
Self-citationTardito, S., Oudin, A., Ahmed, S. U., Fack, F., Keunen, O., Zheng, L., Miletic, H., Sakariassen, P. Ø., Weinstock, A., Wagner, A., et al. (2015) · Nature Cell Biology · doi:10.1038/ncb3272 · Cited by 557
Sasaki, H., Sato, H., Kuriyama-Matsumura, K., Sato, K., Maebara, K., Wang, H., Tamba, M., Itoh, K., Yamamoto, M. P., & Bannai, S. (2002) · Journal of Biological Chemistry · doi:10.1074/jbc.m208704200 · Cited by 544
Marin-Valencia, I., Yang, C., Mashimo, T., Cho, S., Baek, H., Yang, X.-L., Rajagopalan, K. N., Maddie, M., Vemireddy, V., Zhao, Z., et al. (2012) · Cell Metabolism · doi:10.1016/j.cmet.2012.05.001 · Cited by 529
Inhibition of Glutaminase Preferentially Slows Growth of Glioma Cells with Mutant IDH1
Seltzer, M. J., Bennett, B. D., Joshi, A. D., Gao, P., Thomas, A. G., Ferraris, D. V., Tsukamoto, T., Rojas, C. J., Slusher, B. S., Rabinowitz, J. D., et al. (2010) · Cancer Research · doi:10.1158/0008-5472.can-10-1666 · Cited by 528
Pyruvate carboxylase is critical for non–small-cell lung cancer proliferation
Sellers, K., Fox, M. P., Bousamra, M., Slone, S. P., Higashi, R. M., Miller, D. M., Wang, Y., Yan, J., Yuneva, M. O., Deshpande, R., et al. (2015) · Journal of Clinical Investigation · doi:10.1172/jci72873 · Cited by 497
Bhutia, Y. D., Babu, E., Ramachandran, S., & Ganapathy, V. (2015) · Cancer Research · doi:10.1158/0008-5472.can-14-3745 · Cited by 483
Pyruvate carboxylase is required for glutamine-independent growth of tumor cells
Cheng, T., Sudderth, J., Yang, C., Mullen, A. R., Jin, E. S., Matés, J. M., & DeBerardinis, R. J. (2011) · Proceedings of the National Academy of Sciences · doi:10.1073/pnas.1016627108 · Cited by 475
Moreadith, R. W., & Lehninger, A. L. (1984) · Journal of Biological Chemistry · doi:10.1016/s0021-9258(20)82128-0 · Cited by 415
Olivares, O., Mayers, J. R., Gouirand, V., Torrence, M. E., Gicquel, T., Borge, L., Lac, S., Roques, J., Lavaut, M.-N., Berthezène, P., et al. (2017) · Nature Communications · doi:10.1038/ncomms16031 · Cited by 413
Metabolic reprogramming in cancer: Unraveling the role of glutamine in tumorigenesis
Daye, D., & Wellen, K. E. (2012) · Seminars in Cell and Developmental Biology · doi:10.1016/j.semcdb.2012.02.002 · Cited by 387
Amino acid transporters: roles in amino acid sensing and signalling in animal cells
Hyde, R., Taylor, P. M., & Hundal, H. S. (2003) · Biochemical Journal · doi:10.1042/bj20030405 · Cited by 379
Jin, L., Li, D., Alesi, G. N., Fan, J., Kang, H., Zhou, L., Boggon, T. J., Jin, P., Yi, H. L., Wright, E., et al. (2015) · Cancer Cell · doi:10.1016/j.ccell.2014.12.006 · Cited by 371
Gameiro, P. A., Yang, J., Metelo, A. M., Pérez-Carro, R., Baker, R., Wang, Z., Arreola, A., Rathmell, W. K., Olumi, A., López-Larrubia, P., et al. (2013) · Cell Metabolism · doi:10.1016/j.cmet.2013.02.002 · Cited by 325
Davies, T. G., Wixted, W. E., Coyle, J. E., Griffiths-Jones, C., Hearn, K., McMenamin, R., Norton, D., Rich, S. J., Richardson, C., Saxty, G., et al. (2016) · Journal of Medicinal Chemistry · doi:10.1021/acs.jmedchem.6b00228 · Cited by 322
Compensatory metabolic networks in pancreatic cancers upon perturbation of glutamine metabolism
Biancur, D. E., Paulo, J. A., Małachowska, B., Quiles Del Rey, M., Sousa, C. M., Wang, X., Sohn, A. S. W., Chu, G. C., Gygi, S. P., Harper, J. W., et al. (2017) · Nature Communications · doi:10.1038/ncomms15965 · Cited by 315 · cited 2×
“Previous studies have suggested that glutamine-derived glutathione is essential for cell growth and further that depletion of glutathione upon glutaminase inhibition and subsequent loss of reactive oxygen species (ROS) buffering forms the basis of glutaminase dependence (Biancur et al., 2017; Jin et al., 2015; Li et a…”
BackgroundCassago, A., Ferreira, A. P. S., Ferreira, I. M., Fornezari, C., Gomes, E. R. M., Greene, K. S., Pereira, H. M., Garratt, R. C., Dias, S. M. G., & Ambrosio, A. L. B. (2012) · Proceedings of the National Academy of Sciences · doi:10.1073/pnas.1112495109 · Cited by 291
Differential Glutamate Metabolism in Proliferating and Quiescent Mammary Epithelial Cells
Coloff, J. L., Murphy, J. P., Braun, C. R., Harris, I. S., Shelton, L. M., Kami, K., Gygi, S. P., Selfors, L. M., & Brugge, J. S. (2016) · Cell Metabolism · doi:10.1016/j.cmet.2016.03.016 · Cited by 288
Physician’s Guide to the Laboratory Diagnosis of Metabolic Diseases
(2003) · Springer eBooks · doi:10.1007/978-3-642-55878-8 · Cited by 271
Pochini, L., Scalise, M., Galluccio, M., & Indiveri, C. (2014) · Frontiers in Chemistry · doi:10.3389/fchem.2014.00061 · Cited by 264
An elementary metabolite unit (EMU) based method of isotopically nonstationary flux analysis
Young, J. D., Walther, J. L., Antoniewicz, M. R., Yoo, H., & Stephanopoulos, G. N. (2007) · Biotechnology and Bioengineering · doi:10.1002/bit.21632 · Cited by 257
THE CARBOHYDRATE METABOLISM OF TUMORS
Cori, C. F., & Cori, G. T. (1925) · Journal of Biological Chemistry · doi:10.1016/s0021-9258(18)84849-9 · Cited by 243
Elgogary, A., Xu, Q., Poore, B., Alt, J., Zimmermann, S. C., Zhao, L., Fu, J., Chen, B., Xia, S., Liu, Y., et al. (2016) · Proceedings of the National Academy of Sciences · doi:10.1073/pnas.1611406113 · Cited by 234 · cited 2×
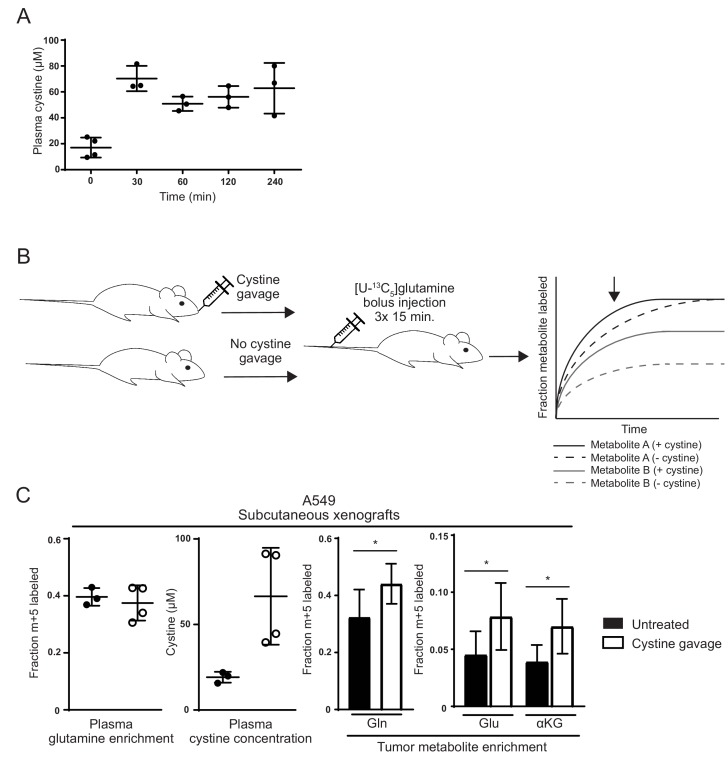
“…into glutamate and downstream metabolites during a presteady state, kinetic labeling period and this method has previously been used to corroborate predicted changes in tumor glutamine utilization (Elgogary et al., 2016; Lane et al., 2015; Tardito et al., 2015; Yuneva et al., 2012) (Figure 5B).”
MethodSayin, V. I., LeBoeuf, S. E., Singh, S. X., Davidson, S. M., Biancur, D., Guzelhan, B. S., Alvarez, S. W., Wu, W. L., Karakousi, T. R., Zavitsanou, A. M., et al. (2017) · eLife · doi:10.7554/elife.28083 · Cited by 231
Self-citationParacrine Induction of HIF by Glutamate in Breast Cancer: EglN1 Senses Cysteine
Briggs, K. J., Koivunen, P., Cao, S., Backus, K. M., Olenchock, B. A., Patel, H., Zhang, Q. H., Signoretti, S., Gerfen, G. J., Richardson, A. L., et al. (2016) · Cell · doi:10.1016/j.cell.2016.05.042 · Cited by 228
Yap reprograms glutamine metabolism to increase nucleotide biosynthesis and enable liver growth
Cox, A. G., Hwang, K. L., Brown, K., Evason, K. J., Beltz, S., Tsomides, A., O’Connor, K., Galli, G. G., Yimlamai, D., Chhangawala, S., et al. (2016) · Nature Cell Biology · doi:10.1038/ncb3389 · Cited by 216
van den Heuvel, A. P. J., Jing, J., Wooster, R. F., & Bachman, K. E. (2012) · Cancer Biology & Therapy · doi:10.4161/cbt.21348 · Cited by 209
Famine versus feast: understanding the metabolism of tumors in vivo
Mayers, J. R., & Heiden, M. G. V. (2015) · Trends in Biochemical Sciences · doi:10.1016/j.tibs.2015.01.004 · Cited by 190
Brand, K. (1985) · Biochemical Journal · doi:10.1042/bj2280353 · Cited by 187
Gaglio, D., Soldati, C., Vanoni, M., Alberghina, L., & Chiaradonna, F. (2009) · PLoS ONE · doi:10.1371/journal.pone.0004715 · Cited by 164
Baek, S., Choi, C., Ahn, S. H., Lee, J. W., Gong, G., Ryu, J., Oh, S. J., Bacher-Stier, C., Fels, L., Koglin, N., et al. (2012) · Clinical Cancer Research · doi:10.1158/1078-0432.ccr-12-0214 · Cited by 130
The clinical potential of influencing Nrf2 signaling in degenerative and immunological disorders
Hybertson, B. M., Gao, B., & Doan, A. (2014) · Clinical Pharmacology Advances and Applications · doi:10.2147/cpaa.s35078 · Cited by 113
Okazaki, A., Gameiro, P. A., Christodoulou, D. C., Laviolette, L. A., Schneider, M., Chaves, F. L., Stemmer-Rachamimov, A. O., Yazinski, S. A., Lee, R. E., Jr., Stephanopoulos, G. N., et al. (2017) · Journal of Clinical Investigation · doi:10.1172/jci87800 · Cited by 110
Patel, D., Menon, D., Bernfeld, E., Mroz, V., Kalan, S., Loayza, D., & Foster, D. A. (2016) · Journal of Biological Chemistry · doi:10.1074/jbc.m115.710145 · Cited by 86
Brand, K., Leibold, W., Luppa, P., Schoerner, C., & Schulz, A. (1986) · Immunobiology · doi:10.1016/s0171-2985(86)80086-9 · Cited by 80
Kang, Y. J., Feng, Y., & Hatcher, E. L. (1994) · Journal of Cellular Physiology · doi:10.1002/jcp.1041610323 · Cited by 58
Biochemical and genetic studies in cystinuria: observations on double heterozygotes of genotype I/II
Morin, C. L., Thompson, M. W., Jackson, S. H., & Sass-Kortsāk, A. (1971) · Journal of Clinical Investigation · doi:10.1172/jci106688 · Cited by 56
Ulanet, D., Couto, K., Jha, A., Choe, S. E., Wang, Y., Woo, H.-K., Steadman, M., DeLaBarre, B., Größ, S., Driggers, E. M., et al. (2014) · PLoS ONE · doi:10.1371/journal.pone.0115144 · Cited by 49
Cetinbas, N. M., Sudderth, J., Harris, R. C., Cebeci, A., Negri, G. L., Yilmaz, Ö. H., DeBerardinis, R. J., & Sorensen, P. H. B. (2016) · Scientific Reports · doi:10.1038/srep32606 · Cited by 45
13C Tracer Studies of Metabolism in Mouse Tumor Xenografts
Lane, A. N., Yan, J., & Fan, T. W. ‐. (2015) · BIO-PROTOCOL · doi:10.21769/bioprotoc.1650 · Cited by 39
Ulanet, D., Jha, A., Couto, K., Choe, S. E., Wang, A., Woo, H.-K., Steadman, M., DeLaBarre, B., Größ, S., Driggers, E. M., et al. (2014) · Cancer & Metabolism · doi:10.1186/2049-3002-2-s1-p78 · Cited by 24
Glutaminase 1 inhibition reduces thymidine synthesis in NSCLC
Lee, J., Kang, J. H., Lee, S.-H., Lee, C. H., Son, J., & Kim, S. (2016) · Biochemical and Biophysical Research Communications · doi:10.1016/j.bbrc.2016.06.095 · Cited by 23
Primary Sequence and Glycation at Lysine-548 of Bovine Serum Albumin
Wada, Y. (1996) · Journal of Mass Spectrometry · doi:10.1002/(sici)1096-9888(199603)31:3 · Cited by 19
Kang, Y. J., Emery, D. G., & Enger, M. D. (1991) · Cell Biology and Toxicology · doi:10.1007/bf00250979 · Cited by 13
Efficacy of Novel Glutaminase Inhibitor CB-839 in Acute Myeloid Leukemia
Matre, P. R., Shariati, M., Vélez, J., Qi, Y., Konoplev, S. N., Su, X., Dinardo, C. D., Daver, N. G., Majeti, R., Andreeff, M., et al. (2014) · Blood · doi:10.1182/blood.v124.21.3763.3763 · Cited by 12
Cited by
Sorted by citations
Galluzzi, L., Vitale, I., Aaronson, S. A., Abrams, J. M., Adam, D., Agostinis, P., Alnemri, E. S., Altucci, L., Amelio, I., Andrews, D. W., et al. (2018) · Cell Death & Differentiation · doi:10.1038/s41418-017-0012-4 · Cited by 6,680
Cystine transporter SLC7A11/xCT in cancer: ferroptosis, nutrient dependency, and cancer therapy
Koppula, P., Zhuang, L., & Gan, B. (2020) · Protein & Cell · doi:10.1007/s13238-020-00789-5 · Cited by 2,640
The multifaceted contributions of mitochondria to cellular metabolism
Spinelli, J. B., & Haigis, M. C. (2018) · Nature Cell Biology · doi:10.1038/s41556-018-0124-1 · Cited by 1,935
Metabolic regulation of cell growth and proliferation
Zhu, J., & Thompson, C. B. (2019) · Nature Reviews Molecular Cell Biology · doi:10.1038/s41580-019-0123-5 · Cited by 1,154
The development of the concept of ferroptosis
Hirschhorn, T., & Stockwell, B. R. (2019) · Free Radical Biology and Medicine · doi:10.1016/j.freeradbiomed.2018.09.043 · Cited by 1,052
Metadata
- Authors
- Muir, A., Danai, L. V., Gui, D. Y., Waingarten, C. Y., Lewis, C. A., & Vander Heiden, M. G.
- Affiliations
- Koch Institute for Integrative Cancer Research At MIT (US)
- Whitehead Institute for Biomedical Research (US)
- Koch Institute for Integrative Cancer Research and Department of Biology, Massachusetts Institute of Technology, Cambridge, United States
- Venue
- eLife
- Publisher
- eLife Sciences Publications, Ltd
- Published
- 2017-08-15
- Volume
- 6
- ISSN
- 2050-084X (ISSN-L)
- PMC
- PMC5589418
- OpenAlex
- W2606822414
- Cited by
- 311
- References
- 85
- Citations by year
- 2026: 19 · 2025: 26 · 2024: 37 · 2023: 36 · 2022: 29 · 2021: 39 · 2020: 52 · 2019: 42 · 2018: 22 · 2017: 8
- FWCI
- 11.39
- Type
- journal article
- Language
- en
- Open access
- gold
- doi.org
- Licence
- Locations
- eLife (publishedVersion, cc-by)
- bioRxiv (Cold Spring Harbor Laboratory) (acceptedVersion, cc-by-nc)
- Europe PMC (PubMed Central) (publishedVersion, cc-by)
- PubMed Central (publishedVersion, cc-by)
- PubMed (publishedVersion)
- DOAJ (DOAJ: Directory of Open Access Journals) (submittedVersion, cc-by-sa)
- DSpace@MIT (Massachusetts Institute of Technology) (submittedVersion, cc-by-nc)
- Funders
- National Institutes of Health (R01 CA168653, R01 CA201276, P30CA1405141, F32CA213810, F32CA210421, T32GM007753)
- Lustgarten Foundation (Research Investigator Award)
- Stand Up To Cancer (Innovative Research Grant)
- Ludwig Institute for Cancer Research (Ludwig Center at MIT)
- Howard Hughes Medical Institute (HHMI Faculty Scholar)
- Topics
- Life Sciences › Biochemistry, Genetics and Molecular Biology › Cancer Research › Cancer, Hypoxia, and Metabolism
- Life Sciences › Biochemistry, Genetics and Molecular Biology › Biochemistry › Amino Acid Enzymes and Metabolism
- Life Sciences › Biochemistry, Genetics and Molecular Biology › Biochemistry › Sulfur Compounds in Biology
- Keywords
- cystine, glutamine anaplerosis, glutaminase inhibition, SLC7A11, glutamine catabolism, TCA cycle, cancer metabolism, bovine serum, culture medium composition, glutamine addiction
- MeSH terms
- Animals, Cattle, Cystine, Glutaminase, Glutamine, Humans, Mice, Nude, Neoplasms, Tumor Cells, Cultured, Amino Acid Transport System y+, Cell Proliferation, Tumor Microenvironment
About these checks
Registry, retraction, Cites and statistics results are computed, not judged, with one exception: a printed reference that no index lists is read once by a model before it counts as a citation error. Claims are extracted by a model and kept only when their quote appears verbatim in the text; each cited source is then checked, with a model’s help, for whether it says what the claim relies on. Those verdicts can be wrong — read the claim’s quote and the cited source before relying on one.
Statistics and arithmetic are recomputed, not judged.
Confidence bands are shown only for fields calibrated on our annotated test set. None is calibrated yet, so no band is shown.
What counts as a claim ›How we measure confidence ›How we check this ›
Are you an author, or do you see a problem with this page? Request a review
