Student or educator? Sign up with your school email and get 6 months of Pro free.
Cited by 46

The DOI matches its Crossref record; 13 of the 13 references it cites were found in a registry or an index.

Salient experiences are represented by unique transcriptional signatures in the mouse brain

Mukherjee, Diptendu, Ignatowska-Jankowska, Bogna Marta, Itskovits, Eyal, Gonzales, Ben Jerry, Turm, Hagit, Izakson, Liz, Haritan, Doron, Bleistein, Noa, Cohen, Chen, Amit, Ido, Shay, Tal, Grueter, Brad, Zaslaver, Alon, Citri, Ami·2018·eLife

Published version of a preprint

Abstract

It is well established that inducible transcription is essential for the consolidation of salient experiences into long-term memory. However, whether inducible transcription relays information about the identity and affective attributes of the experience being encoded, has not been explored. To this end, we analyzed transcription induced by a variety of rewarding and aversive experiences, across multiple brain regions. Our results describe the existence of robust transcriptional signatures uniquely representing distinct experiences, enabling near-perfect decoding of recent experiences. Furthermore, experiences with shared attributes display commonalities in their transcriptional signatures, exemplified in the representation of valence, habituation and reinforcement. This study introduces the concept of a neural transcriptional code, which represents the encoding of experiences in the mouse brain. This code is comprised of distinct transcriptional signatures that correlate to attributes of the experiences that are being committed to long-term memory.

Overview

The claims and statistics of this paper haven’t been checked yet.

Run the check — free, no account needed. It reads the open-access text and checks the sources it cites.

A few free checks a day · papers already verified open instantly · results are public

Integrity signals

Registry

Crossref · 10.7554/elife.31220

Cites

13 of 13 references verified0 citation errors · 0 not checkable

Statistics

Figures

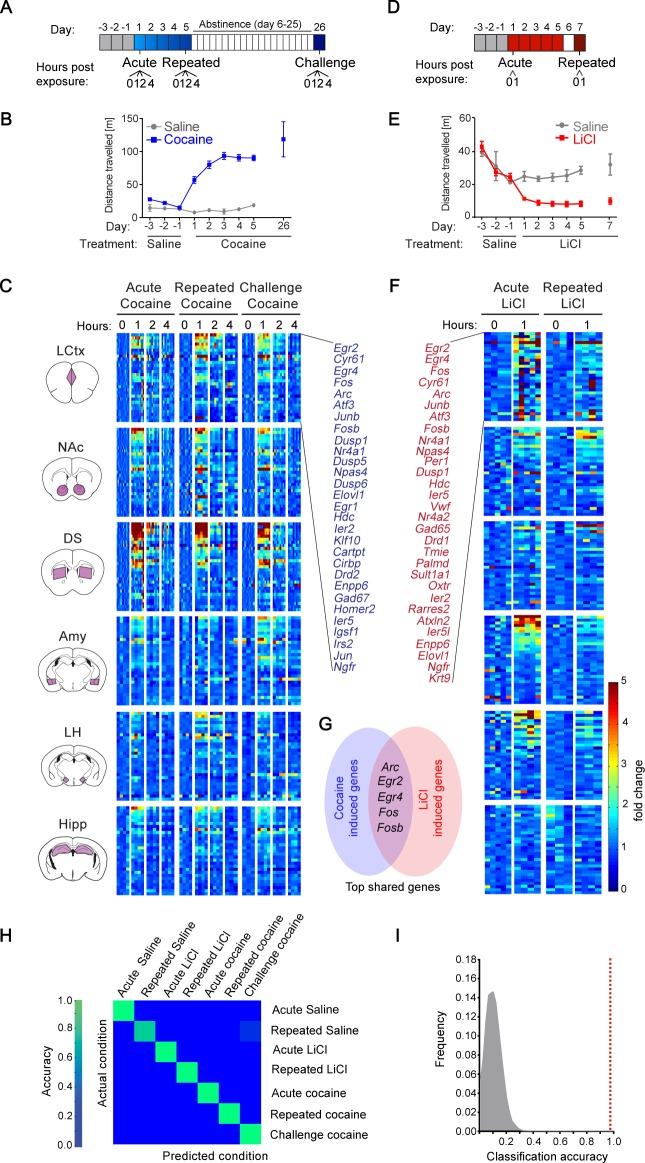
Figure 1. Transcriptional signatures representing recent experience. (A) Schematic of experimental paradigm for cocaine sensitization. Mice were exposed to cocaine (i.p., 20 mg/kg) or saline, either acutely, repeatedly or re-exposed following abstinence (challenge), with transcriptional dynamics studied at 0, 1, 2 or 4 hr. (B) Locomotor activity of mice following acute, repeated or challenge cocaine experiences (compared to saline). Sample size: acute and repeated saline n = 4; acute cocaine n = 30; repeated cocaine n = 22; challenge cocaine n = 19 mice. Results indicate mean ± s.e.m. (C) Expression matrix of IEG induction dynamics following cocaine experiences. Individual animals are represented in columns sorted according to time points of cocaine experiences [sample numbers per time point - LCtx: limbic cortex (n = 5–11), NAc: nucleus accumbens (n = 5–12), DS: dorsal striatum (n = 5–12), Amy: amygdala (n = 3–4), LH: lateral hypothalamus (n = 2–4), Hipp: hippocampus (n = 2–4)]. Fold induction is graded from blue (low) to red (high). Genes represented were induced at least 2-fold over control in any one of the brain regions studied. Genes were sorted according to peak induction in the DS. (D) Schematic of experimental paradigm for LiCl exposure. Mice were exposed to LiCl (i.p.) or saline, either acutely (150 or 250 mg/kg) or repeatedly (150 mg/kg). (E) Locomotor activity of mice following acute or repeated LiCl exposure (as in panel C). Sample size: n = 4–5. (F) Expression matrix of IEG induction dynamics following LiCl experiences (n = 4–5). Genes were sorted according to peak induction in the Amy. (G) Venn diagram indicating the identity of the most robustly induced genes common to cocaine and LiCl experiences (most appearances and lowest variance). (H) Confusion matrix representing the classification accuracy of decoding the recent experience (acute, chronic and challenge cocaine, acute and repeated LiCl and acute and repeated saline) of individual mice based on expression of Arc, Egr2, Egr4, Fos and Fosb induction in the LCtx, NAc, DS, Amy and LH using a KNN classifier. Accuracy is scaled from blue to green, with bright green corresponding to 100% accuracy (n = 37 mice). Overall accuracy = 97.3%. (I) Results of a permutation test for verifying classification. A randomization test was performed, in which the classifier was run on 105 random permutations of the association of individual mice to the appropriate experience, and the frequency of classification accuracies is plotted in grey, while the red dotted line represents the classification accuracy obtained for non-randomized data (97.3%).
Figure 1. Transcriptional signatures representing recent experience. (A) Schematic of experimental paradigm for cocaine sensitization. Mice were exposed to cocaine (i.p., 20 mg/kg) or saline, either acutely, repeatedly or re-exposed following abstinence (challenge), with transcriptional dynamics studied at 0, 1, 2 or 4 hr. (B) Locomotor activity of mice following acute, repeated or challenge cocaine experiences (compared to saline). Sample size: acute and repeated saline n = 4; acute cocaine n = 30; repeated cocaine n = 22; challenge cocaine n = 19 mice. Results indicate mean ± s.e.m. (C) Expression matrix of IEG induction dynamics following cocaine experiences. Individual animals are represented in columns sorted according to time points of cocaine experiences [sample numbers per time point - LCtx: limbic cortex (n = 5–11), NAc: nucleus accumbens (n = 5–12), DS: dorsal striatum (n = 5–12), Amy: amygdala (n = 3–4), LH: lateral hypothalamus (n = 2–4), Hipp: hippocampus (n = 2–4)]. Fold induction is graded from blue (low) to red (high). Genes represented were induced at least 2-fold over control in any one of the brain regions studied. Genes were sorted according to peak induction in the DS. (D) Schematic of experimental paradigm for LiCl exposure. Mice were exposed to LiCl (i.p.) or saline, either acutely (150 or 250 mg/kg) or repeatedly (150 mg/kg). (E) Locomotor activity of mice following acute or repeated LiCl exposure (as in panel C). Sample size: n = 4–5. (F) Expression matrix of IEG induction dynamics following LiCl experiences (n = 4–5). Genes were sorted according to peak induction in the Amy. (G) Venn diagram indicating the identity of the most robustly induced genes common to cocaine and LiCl experiences (most appearances and lowest variance). (H) Confusion matrix representing the classification accuracy of decoding the recent experience (acute, chronic and challenge cocaine, acute and repeated LiCl and acute and repeated saline) of individual mice based on expression of Arc, Egr2, Egr4, Fos and Fosb induction in the LCtx, NAc, DS, Amy and LH using a KNN classifier. Accuracy is scaled from blue to green, with bright green corresponding to 100% accuracy (n = 37 mice). Overall accuracy = 97.3%. (I) Results of a permutation test for verifying classification. A randomization test was performed, in which the classifier was run on 105 random permutations of the association of individual mice to the appropriate experience, and the frequency of classification accuracies is plotted in grey, while the red dotted line represents the classification accuracy obtained for non-randomized data (97.3%).CC BY · PubMed Central
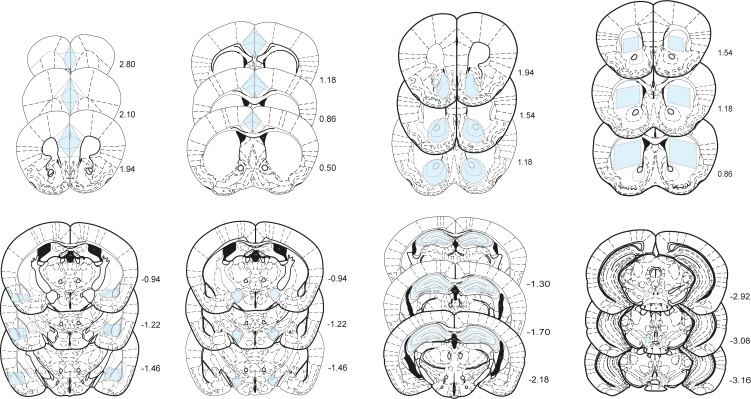
Figure 1—figure supplement 1. Boundaries of dissected structures. Shaded regions in blue represent areas cut out from 400 µm slices for LCtx (limbic cortex), NAc (nucleus accumbens), DS (dorsal striatum), Amy (amygdala), LH (lateral hypothalamus), and Hipp (hippocampus) and 200 µm slices for VTA (ventral tegmental area), providing reproducible tissue samples for analysis of transcription. Distance from Bregma on the rostral-caudal axis is indicated in mm.
Figure 1—figure supplement 1. Boundaries of dissected structures. Shaded regions in blue represent areas cut out from 400 µm slices for LCtx (limbic cortex), NAc (nucleus accumbens), DS (dorsal striatum), Amy (amygdala), LH (lateral hypothalamus), and Hipp (hippocampus) and 200 µm slices for VTA (ventral tegmental area), providing reproducible tissue samples for analysis of transcription. Distance from Bregma on the rostral-caudal axis is indicated in mm.CC BY · PubMed Central
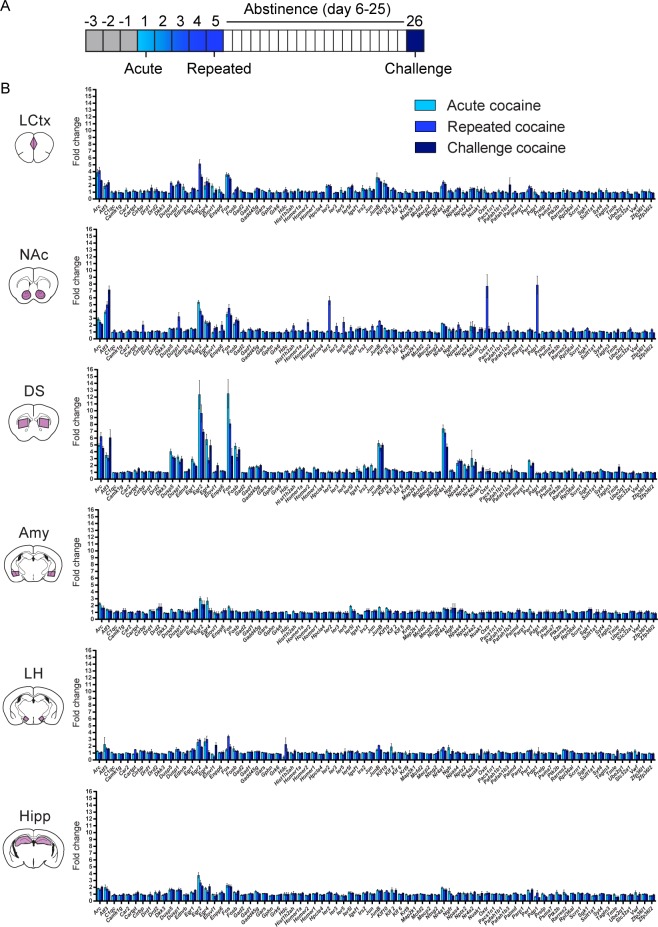
Figure 1—figure supplement 2. Acute, repeated and challenge cocaine experiences induce distinct transcriptional programs across brain structures. (A) Schematic of the experimental paradigm. (B) Average transcriptional induction of 78 genes one hour following acute, repeated or challenge cocaine experiences in six brain nuclei [LCtx: limbic cortex (n = 6–10), NAc: nucleus accumbens (n = 6–10), DS: dorsal striatum (n = 6–10), Amy: amygdala (n = 4), LH: lateral hypothalamus (n = 4), Hipp: hippocampus (n = 4)]. Genes are sorted alphabetically. Results indicate mean ± s.e.m.
Figure 1—figure supplement 2. Acute, repeated and challenge cocaine experiences induce distinct transcriptional programs across brain structures. (A) Schematic of the experimental paradigm. (B) Average transcriptional induction of 78 genes one hour following acute, repeated or challenge cocaine experiences in six brain nuclei [LCtx: limbic cortex (n = 6–10), NAc: nucleus accumbens (n = 6–10), DS: dorsal striatum (n = 6–10), Amy: amygdala (n = 4), LH: lateral hypothalamus (n = 4), Hipp: hippocampus (n = 4)]. Genes are sorted alphabetically. Results indicate mean ± s.e.m.CC BY · PubMed Central
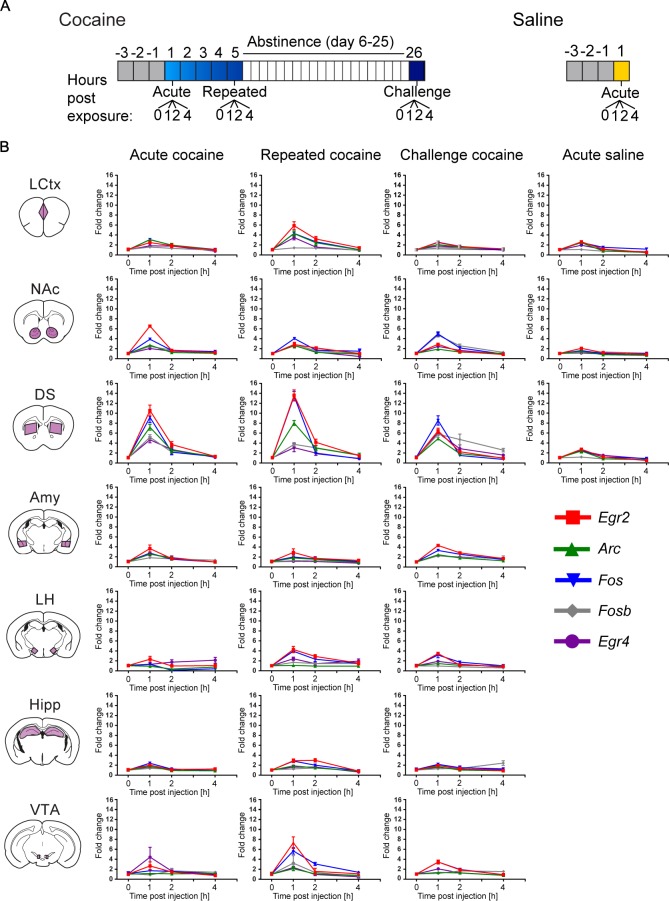
Figure 1—figure supplement 3. Time course of transcriptional induction of a minimal set of markers representing cocaine-induced transcriptional dynamics. (A) Schematic of the experimental paradigms. (B) Arc, Egr2, Egr4, Fos and Fosb induction (0, 1, 2, 4 hr) following acute, repeated and challenge cocaine in seven brain nuclei (LCtx: limbic cortex, NAc: nucleus accumbens, DS: dorsal striatum, Amy: amygdala, LH: lateral hypothalamus, Hipp: hippocampus and VTA: ventral tegmental area), as well as acute saline (in the LCtx, NAc and DS). Subject numbers for each time point: n = 6–16 (LCtx, NAc and DS), n = 4–8 (Amy, LH and Hipp) and n = 2–4 (VTA) for acute, chronic and challenge cocaine. Acute saline included 6–8 animals in each time point for LCtx, NAc and DS. Results indicate mean ± s.e.m.
Figure 1—figure supplement 3. Time course of transcriptional induction of a minimal set of markers representing cocaine-induced transcriptional dynamics. (A) Schematic of the experimental paradigms. (B) Arc, Egr2, Egr4, Fos and Fosb induction (0, 1, 2, 4 hr) following acute, repeated and challenge cocaine in seven brain nuclei (LCtx: limbic cortex, NAc: nucleus accumbens, DS: dorsal striatum, Amy: amygdala, LH: lateral hypothalamus, Hipp: hippocampus and VTA: ventral tegmental area), as well as acute saline (in the LCtx, NAc and DS). Subject numbers for each time point: n = 6–16 (LCtx, NAc and DS), n = 4–8 (Amy, LH and Hipp) and n = 2–4 (VTA) for acute, chronic and challenge cocaine. Acute saline included 6–8 animals in each time point for LCtx, NAc and DS. Results indicate mean ± s.e.m.CC BY · PubMed Central
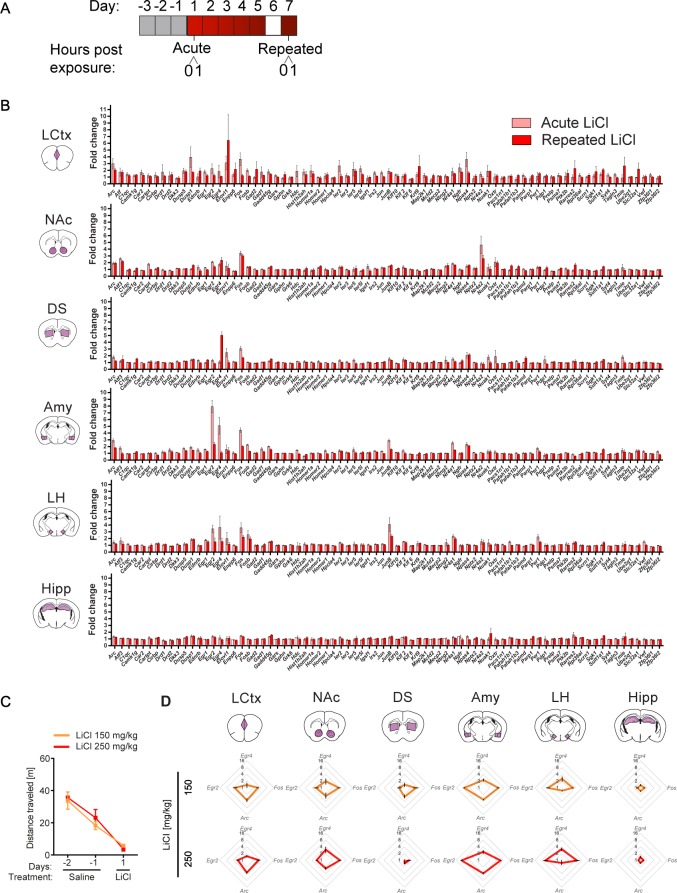
Figure 1—figure supplement 4. Transcriptional representation of LiCl experience. (A) Schematic of experimental paradigm. (B) Comparison of average transcriptional induction of 78 genes following acute LiCl (n = 5) or repeated LiCl (n = 4) at 1 hr time point, in limbic cortex (LCtx), nucleus accumbens (NAc), dorsal striatum (DS), amygdala (Amy), lateral hypothalamus (LH), hippocampus (Hipp). Genes are sorted alphabetically. Results indicate mean ± s.e.m. (C) Locomotor activity of mice following acute i.p. exposure to 150 mg/kg (n = 4) or 250 mg/kg LiCl (n = 4). (D) Radar plots representing the transcriptional response 1 hr following 150 mg/kg and 250 mg/kg of LiCl in the LCtx, NAc, DS, Amy, LH and Hipp. Results indicate mean ± s.e.m.
Figure 1—figure supplement 4. Transcriptional representation of LiCl experience. (A) Schematic of experimental paradigm. (B) Comparison of average transcriptional induction of 78 genes following acute LiCl (n = 5) or repeated LiCl (n = 4) at 1 hr time point, in limbic cortex (LCtx), nucleus accumbens (NAc), dorsal striatum (DS), amygdala (Amy), lateral hypothalamus (LH), hippocampus (Hipp). Genes are sorted alphabetically. Results indicate mean ± s.e.m. (C) Locomotor activity of mice following acute i.p. exposure to 150 mg/kg (n = 4) or 250 mg/kg LiCl (n = 4). (D) Radar plots representing the transcriptional response 1 hr following 150 mg/kg and 250 mg/kg of LiCl in the LCtx, NAc, DS, Amy, LH and Hipp. Results indicate mean ± s.e.m.CC BY · PubMed Central
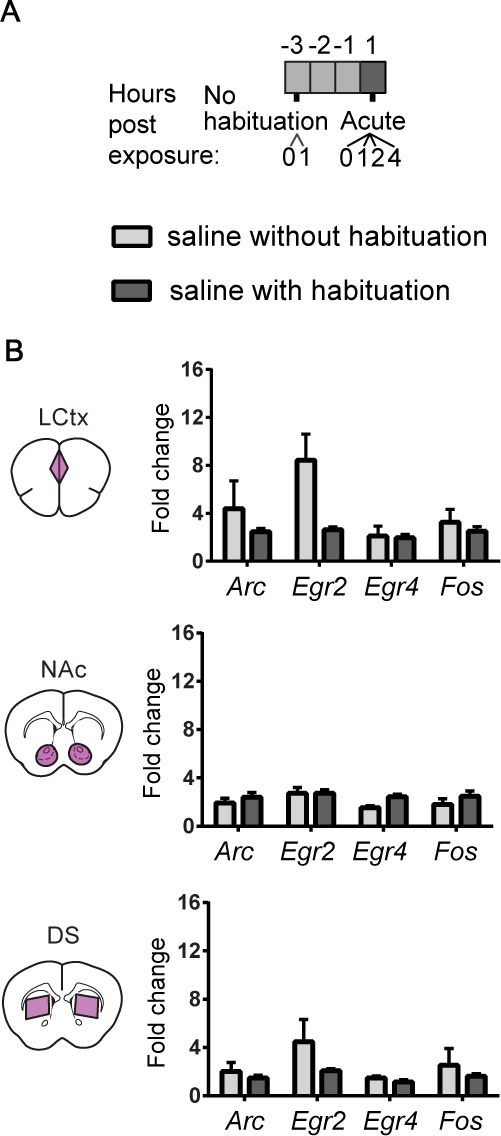
Figure 1—figure supplement 5. Characterization of repeated saline exposures illustrates the effect of habituation on induced transcription. (A) Experimental paradigm for i.p. saline injections. (B) Bar graphs demonstrating the transcriptional induction of Arc, Egr2, Egr4 and Fos in the LCtx, NAc, and DS (limbic cortex, nucleus accumbens, and dorsal striatum, respectively) 1 hr following i.p. injection of saline with no prior habituation (n = 4), or following three days of habituation (n = 5). Results show mean ± s.e.m.
Figure 1—figure supplement 5. Characterization of repeated saline exposures illustrates the effect of habituation on induced transcription. (A) Experimental paradigm for i.p. saline injections. (B) Bar graphs demonstrating the transcriptional induction of Arc, Egr2, Egr4 and Fos in the LCtx, NAc, and DS (limbic cortex, nucleus accumbens, and dorsal striatum, respectively) 1 hr following i.p. injection of saline with no prior habituation (n = 4), or following three days of habituation (n = 5). Results show mean ± s.e.m.CC BY · PubMed Central
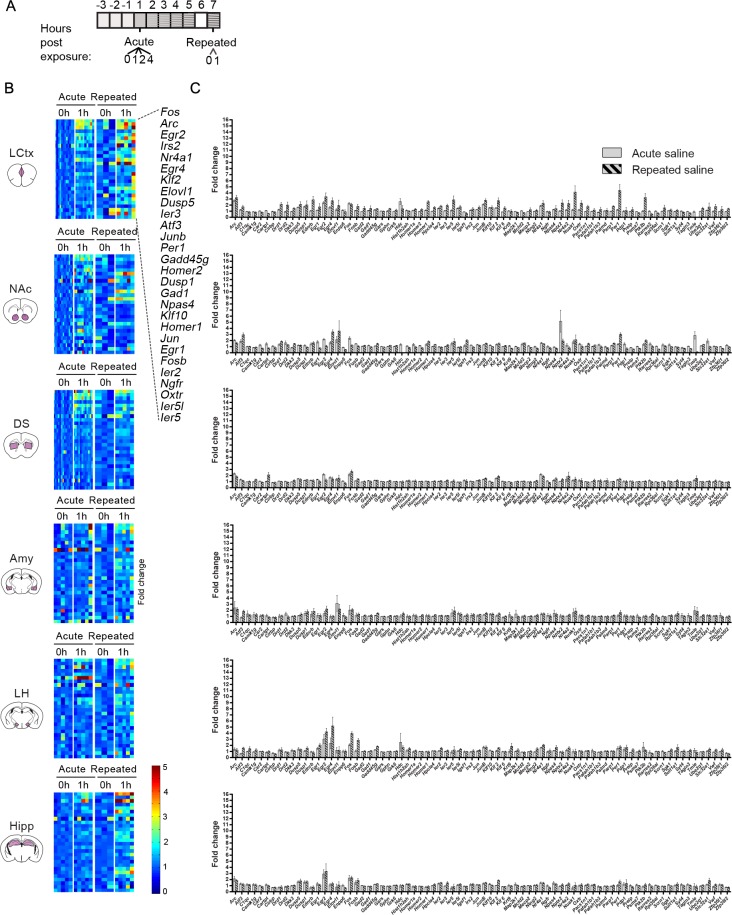
Figure 1—figure supplement 6. Characterization of the transcription induced by acute and repeated saline experiences. (A) Schematic of the experimental paradigm of i.p. injections of saline. (B) Expression matrix of the transcriptional induction of IEGs following acute or repeated saline experiences. Each column represents the transcriptional profile of an individual mouse. Sample numbers for each time point for acute saline: n = 10–12 in LCtx (limbic cortex); n = 12–13 in NAc (nucleus accumbens) and DS (dorsal striatum); n = 5 in Amy (amygdala), LH (lateral hypothalamus), Hipp (hippocampus). Sample numbers for each time point for repeated saline: n = 3–5 in LCtx, NAc, DS, Amy, LH and Hipp. Transcriptional induction is graded from blue (low) to red (high). Genes represented were induced on average at least 1.5-fold following either cocaine or LiCl experiences in any one of the studied brain nuclei. Genes are sorted according to peak induction in the LCtx. (C) Average transcriptional induction of 78 genes 1 hr following acute or repeated saline experience in the LCtx, NAc, DS, Amy, LH and Hipp. Genes are sorted alphabetically. Sample sizes: LCtx: n = 10 for acute saline and n = 5 for repeated saline; NAc: n = 12 for acute saline and n = 5 for repeated saline; DS: n = 12 for acute saline and n = 5 for repeated saline; Amy: n = 5 for acute saline and n = 5 for repeated saline; LH: n = 5 for acute saline and n = 5 for repeated saline; Hipp: n = 6 for acute saline and n = 5 for repeated saline. Results indicate mean ± s.e.m.
Figure 1—figure supplement 6. Characterization of the transcription induced by acute and repeated saline experiences. (A) Schematic of the experimental paradigm of i.p. injections of saline. (B) Expression matrix of the transcriptional induction of IEGs following acute or repeated saline experiences. Each column represents the transcriptional profile of an individual mouse. Sample numbers for each time point for acute saline: n = 10–12 in LCtx (limbic cortex); n = 12–13 in NAc (nucleus accumbens) and DS (dorsal striatum); n = 5 in Amy (amygdala), LH (lateral hypothalamus), Hipp (hippocampus). Sample numbers for each time point for repeated saline: n = 3–5 in LCtx, NAc, DS, Amy, LH and Hipp. Transcriptional induction is graded from blue (low) to red (high). Genes represented were induced on average at least 1.5-fold following either cocaine or LiCl experiences in any one of the studied brain nuclei. Genes are sorted according to peak induction in the LCtx. (C) Average transcriptional induction of 78 genes 1 hr following acute or repeated saline experience in the LCtx, NAc, DS, Amy, LH and Hipp. Genes are sorted alphabetically. Sample sizes: LCtx: n = 10 for acute saline and n = 5 for repeated saline; NAc: n = 12 for acute saline and n = 5 for repeated saline; DS: n = 12 for acute saline and n = 5 for repeated saline; Amy: n = 5 for acute saline and n = 5 for repeated saline; LH: n = 5 for acute saline and n = 5 for repeated saline; Hipp: n = 6 for acute saline and n = 5 for repeated saline. Results indicate mean ± s.e.m.CC BY · PubMed Central
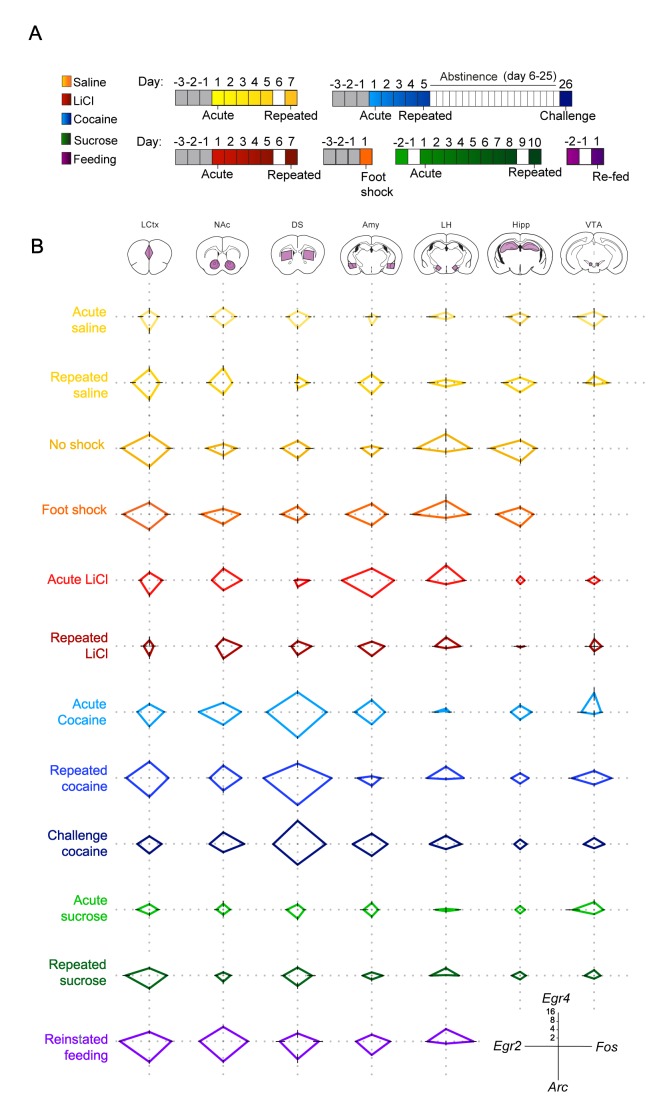
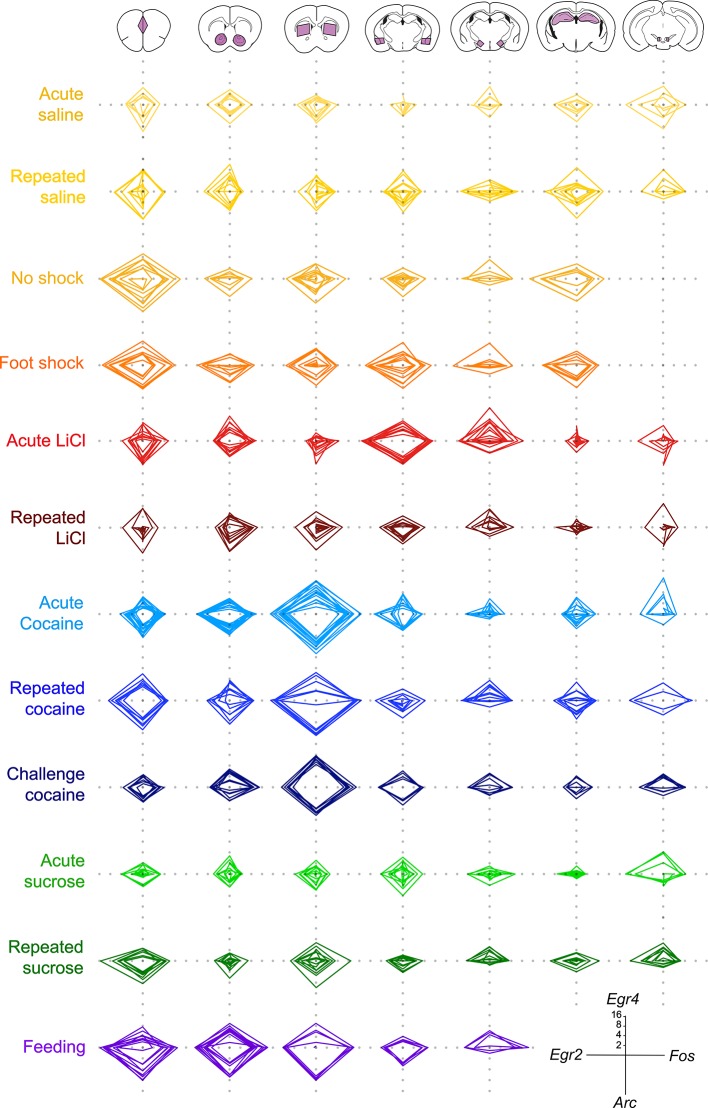
Figure 2. Salient experiences are represented by unique transcriptional signatures. (A) Schematic of experimental paradigms. Experiences analyzed include saline (acute and repeated); foot shock (acute shock and no-shock controls exposed to the same environment); LiCl (acute and repeated); cocaine (acute, repeated and challenge following abstinence); sucrose (acute and repeated) and reinstatement of feeding (following 18 hr of deprivation). (B) Radar plots representing the transcriptional induction of Arc, Egr2, Egr4 and Fos across seven brain structures 1 hr after the different experiences [LCtx: limbic cortex (n = 4–14), NAc: nucleus accumbens (n = 4–14), DS: dorsal striatum (n = 4–14), Amy: amygdala (n = 4–9), LH: lateral hypothalamus (n = 3–9), Hipp: hippocampus (n = 4–9); VTA: ventral tegmental area (n = 2–8)]. Results are shown in log2 scale as mean ± s.e.m. of induction over baseline control.
Figure 2. Salient experiences are represented by unique transcriptional signatures. (A) Schematic of experimental paradigms. Experiences analyzed include saline (acute and repeated); foot shock (acute shock and no-shock controls exposed to the same environment); LiCl (acute and repeated); cocaine (acute, repeated and challenge following abstinence); sucrose (acute and repeated) and reinstatement of feeding (following 18 hr of deprivation). (B) Radar plots representing the transcriptional induction of Arc, Egr2, Egr4 and Fos across seven brain structures 1 hr after the different experiences [LCtx: limbic cortex (n = 4–14), NAc: nucleus accumbens (n = 4–14), DS: dorsal striatum (n = 4–14), Amy: amygdala (n = 4–9), LH: lateral hypothalamus (n = 3–9), Hipp: hippocampus (n = 4–9); VTA: ventral tegmental area (n = 2–8)]. Results are shown in log2 scale as mean ± s.e.m. of induction over baseline control.CC BY · PubMed Central
Figure 2—figure supplement 1. Low variability of the individual transcriptional representations of recent experience. Radar plots representing the transcriptional induction of Arc, Egr2, Egr4 and Fos, in seven brain nuclei [LCtx: limbic cortex (n = 4–14), NAc: nucleus accumbens (n = 4–14), DS: dorsal striatum (n = 4–14), Amy: amygdala (n = 4–9), LH: lateral hypothalamus (n = 3–9), Hipp: hippocampus (n = 4–8), VTA: ventral tegmental area, (n = 2–8)] 1 hr following the defined experiences. Results indicate fold induction at 1 hr in log2 scale, of individual subjects over relevant control conditions.
Figure 2—figure supplement 1. Low variability of the individual transcriptional representations of recent experience. Radar plots representing the transcriptional induction of Arc, Egr2, Egr4 and Fos, in seven brain nuclei [LCtx: limbic cortex (n = 4–14), NAc: nucleus accumbens (n = 4–14), DS: dorsal striatum (n = 4–14), Amy: amygdala (n = 4–9), LH: lateral hypothalamus (n = 3–9), Hipp: hippocampus (n = 4–8), VTA: ventral tegmental area, (n = 2–8)] 1 hr following the defined experiences. Results indicate fold induction at 1 hr in log2 scale, of individual subjects over relevant control conditions.CC BY · PubMed Central
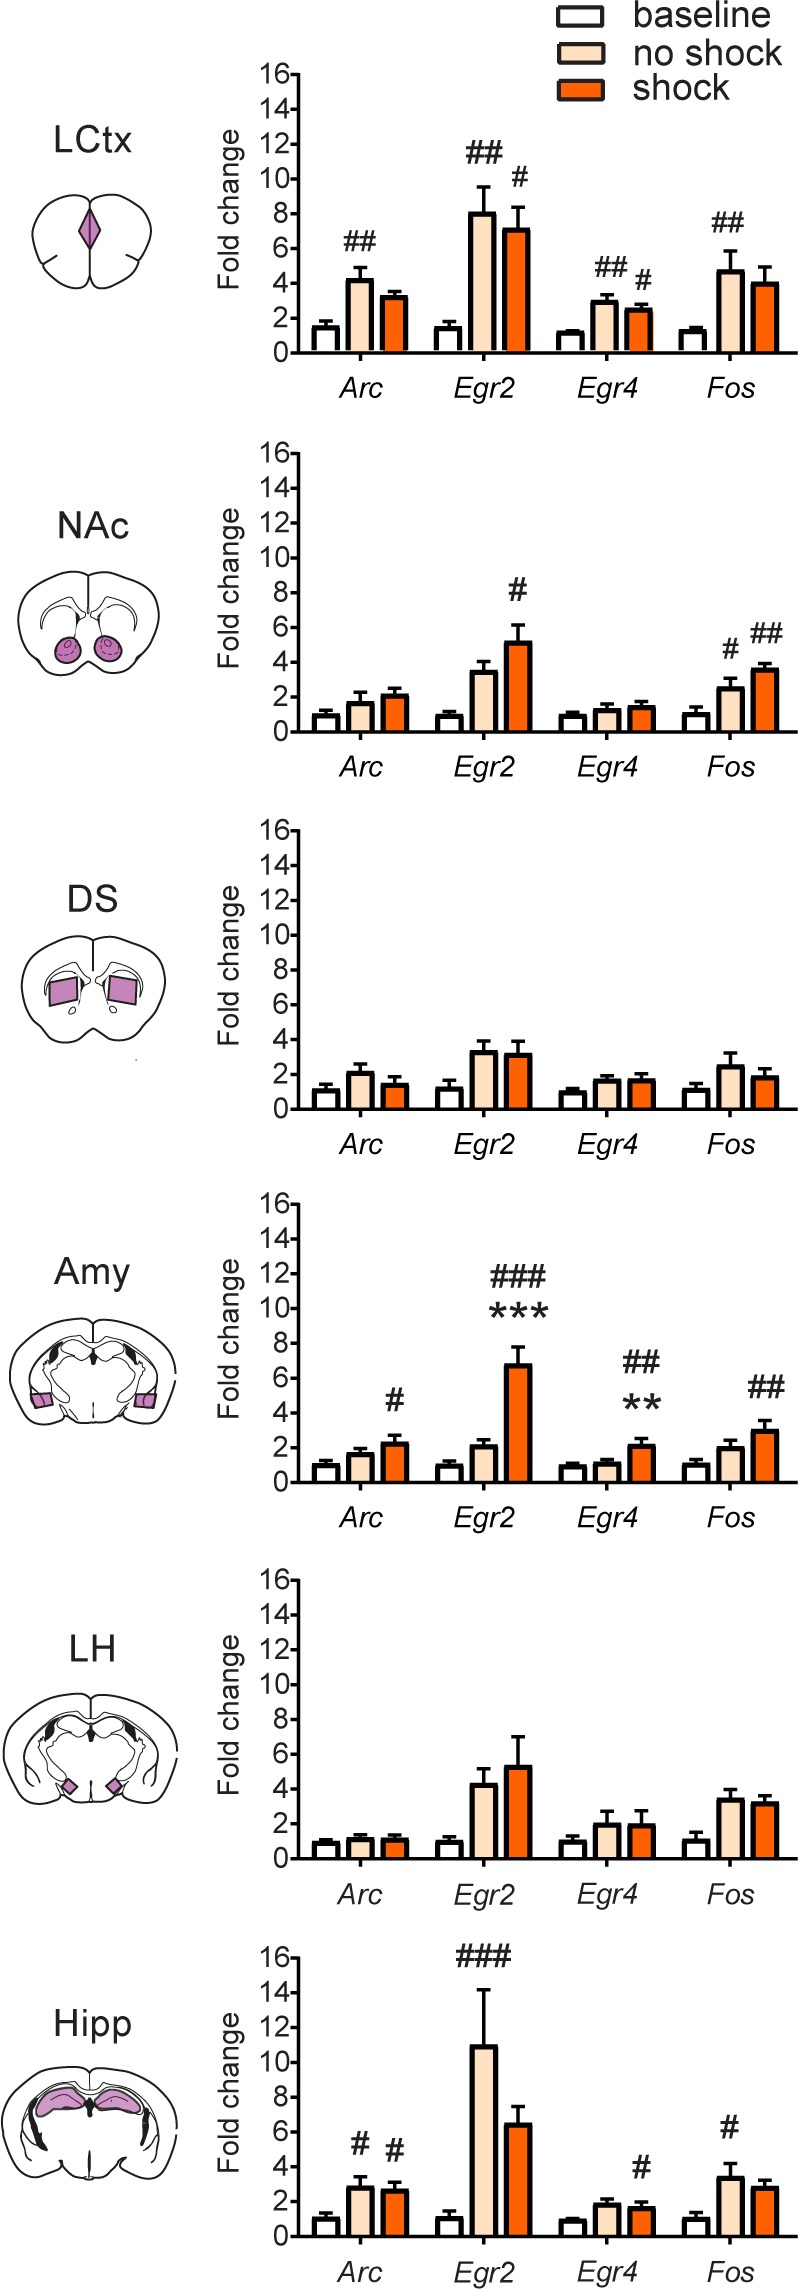
Figure 2—figure supplement 2. Transcriptional representation of negative valence in the amygdala. Comparison of average transcriptional induction of Arc, Egr2, Egr4 and Fos in the LCtx, NAc, DS, Amy, LH and Hipp, 1 hr following acute exposure to the fear-conditioning chamber (no shock) or brief foot shock within the chamber (shock), to mice not exposed to chamber (baseline controls). Sample sizes across structures n = 3–8. Results indicate mean ± s.e.m. One-way ANOVA with Tukey post hoc comparison: **p<0.01, ***p<0.001 vs no shock control, #p<0.05, ##p<0.01, ###p<0.001 vs baseline control.
Figure 2—figure supplement 2. Transcriptional representation of negative valence in the amygdala. Comparison of average transcriptional induction of Arc, Egr2, Egr4 and Fos in the LCtx, NAc, DS, Amy, LH and Hipp, 1 hr following acute exposure to the fear-conditioning chamber (no shock) or brief foot shock within the chamber (shock), to mice not exposed to chamber (baseline controls). Sample sizes across structures n = 3–8. Results indicate mean ± s.e.m. One-way ANOVA with Tukey post hoc comparison: **p<0.01, ***p<0.001 vs no shock control, #p<0.05, ##p<0.01, ###p<0.001 vs baseline control.CC BY · PubMed Central
Figure 2—figure supplement 3. Transcriptional representation of habituation and reinforcement. Comparison of the transcriptional profiles induced by acute and repeated aversive (LiCl) and rewarding (cocaine and sucrose) experiences reveal distinctions and commonalities in the encoding of an anticipated experience of defined valence. Results indicate mean ± s.e.m Sample numbers for each time point- LCtx: limbic cortex (n = 6–14), NAc: nucleus accumbens (n = 6–14), DS: dorsal striatum (n = 6–14), Amy: amygdala (n = 4–9), LH: lateral hypothalamus (n = 3–9), Hipp: hippocampus (n = 4–9); VTA: ventral tegmental area (n = 2–8)]. Two-way ANOVA followed by Tukey post hoc comparison: *p<0.05, **p<0.01, ***p<0.001 vs control (saline or water), #p<0.05, #p<0.01, ###p<0.001 vs acute/repeated treatment.
Figure 2—figure supplement 3. Transcriptional representation of habituation and reinforcement. Comparison of the transcriptional profiles induced by acute and repeated aversive (LiCl) and rewarding (cocaine and sucrose) experiences reveal distinctions and commonalities in the encoding of an anticipated experience of defined valence. Results indicate mean ± s.e.m Sample numbers for each time point- LCtx: limbic cortex (n = 6–14), NAc: nucleus accumbens (n = 6–14), DS: dorsal striatum (n = 6–14), Amy: amygdala (n = 4–9), LH: lateral hypothalamus (n = 3–9), Hipp: hippocampus (n = 4–9); VTA: ventral tegmental area (n = 2–8)]. Two-way ANOVA followed by Tukey post hoc comparison: *p<0.05, **p<0.01, ***p<0.001 vs control (saline or water), #p<0.05, #p<0.01, ###p<0.001 vs acute/repeated treatment.CC BY · PubMed Central
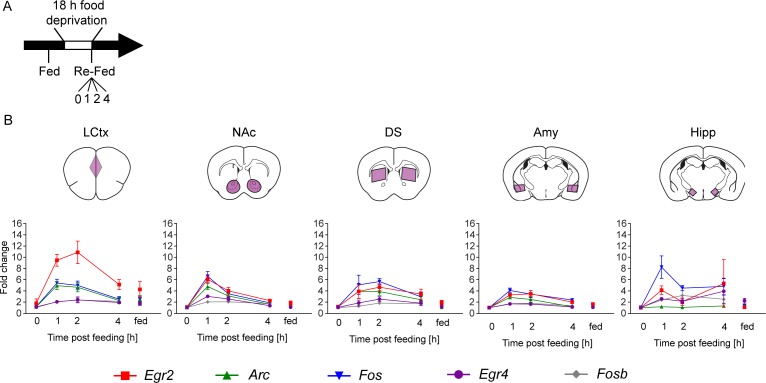
Figure 2—figure supplement 4. Reinstatement of feeding is represented by robust transcriptional dynamics. (A) Schematic of experimental paradigm for reinstatement of feeding. Mice were continuously fed or food deprived for 18 hr, followed by analysis of transcription at 0, 1, 2, 4 hr after reinstatement of feeding. (B) Time course (at 0, 1, 2, 4 hr following reinstatement of feeding, in comparison to continuously fed mice, ‘fed’) of transcriptional induction of Arc, Egr2, Egr4, Fos and Fosb in five brain nuclei. Data for each group was normalized to the 0 hr baseline controls. Sample numbers for each time point: LCtx, limbic cortex n = 10–11; NAc, nucleus accumbens n = 10–11; DS, dorsal striatum n = 7–9; Amy, amygdala n = 3–4; LH, lateral hypothalamus n = 2–4. Results indicate mean ± s.e.m.
Figure 2—figure supplement 4. Reinstatement of feeding is represented by robust transcriptional dynamics. (A) Schematic of experimental paradigm for reinstatement of feeding. Mice were continuously fed or food deprived for 18 hr, followed by analysis of transcription at 0, 1, 2, 4 hr after reinstatement of feeding. (B) Time course (at 0, 1, 2, 4 hr following reinstatement of feeding, in comparison to continuously fed mice, ‘fed’) of transcriptional induction of Arc, Egr2, Egr4, Fos and Fosb in five brain nuclei. Data for each group was normalized to the 0 hr baseline controls. Sample numbers for each time point: LCtx, limbic cortex n = 10–11; NAc, nucleus accumbens n = 10–11; DS, dorsal striatum n = 7–9; Amy, amygdala n = 3–4; LH, lateral hypothalamus n = 2–4. Results indicate mean ± s.e.m.CC BY · PubMed Central
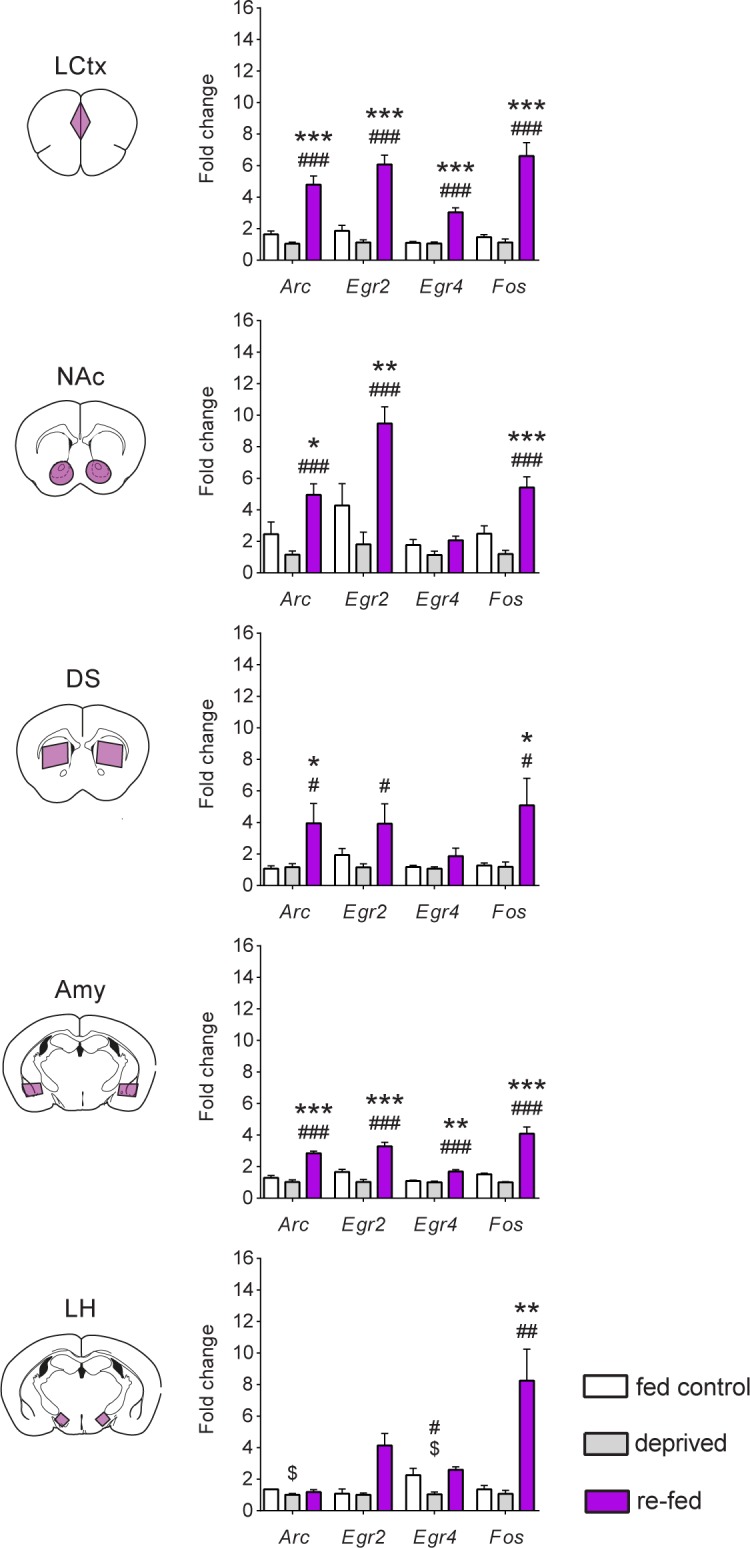
Figure 2—figure supplement 5. Reinstatement of feeding is represented by robust transcriptional dynamics. Comparison of transcriptional induction of Arc, Egr2, Egr4 and Fos, at 0 (deprived) and 1 hr following reinstatement of feeding (re-fed), and continuously fed mice (fed control) across five brain nuclei. Sample numbers for each time point: LCtx, limbic cortex n = 10–11; NAc, nucleus accumbens n = 10–11; DS, dorsal striatum n = 7–9; Amy, amygdala n = 3–4; LH, lateral hypothalamus n = 2–4. Results indicate mean ± s.e.m. One-way ANOVA followed by Tukey post hoc comparison: *p<0.05, **p<0.01, ***p<0.001 vs fed control; #p<0.05, ##p<0.01, ###p<0.001 vs deprived; $p<0.05 vs fed control.
Figure 2—figure supplement 5. Reinstatement of feeding is represented by robust transcriptional dynamics. Comparison of transcriptional induction of Arc, Egr2, Egr4 and Fos, at 0 (deprived) and 1 hr following reinstatement of feeding (re-fed), and continuously fed mice (fed control) across five brain nuclei. Sample numbers for each time point: LCtx, limbic cortex n = 10–11; NAc, nucleus accumbens n = 10–11; DS, dorsal striatum n = 7–9; Amy, amygdala n = 3–4; LH, lateral hypothalamus n = 2–4. Results indicate mean ± s.e.m. One-way ANOVA followed by Tukey post hoc comparison: *p<0.05, **p<0.01, ***p<0.001 vs fed control; #p<0.05, ##p<0.01, ###p<0.001 vs deprived; $p<0.05 vs fed control.CC BY · PubMed Central
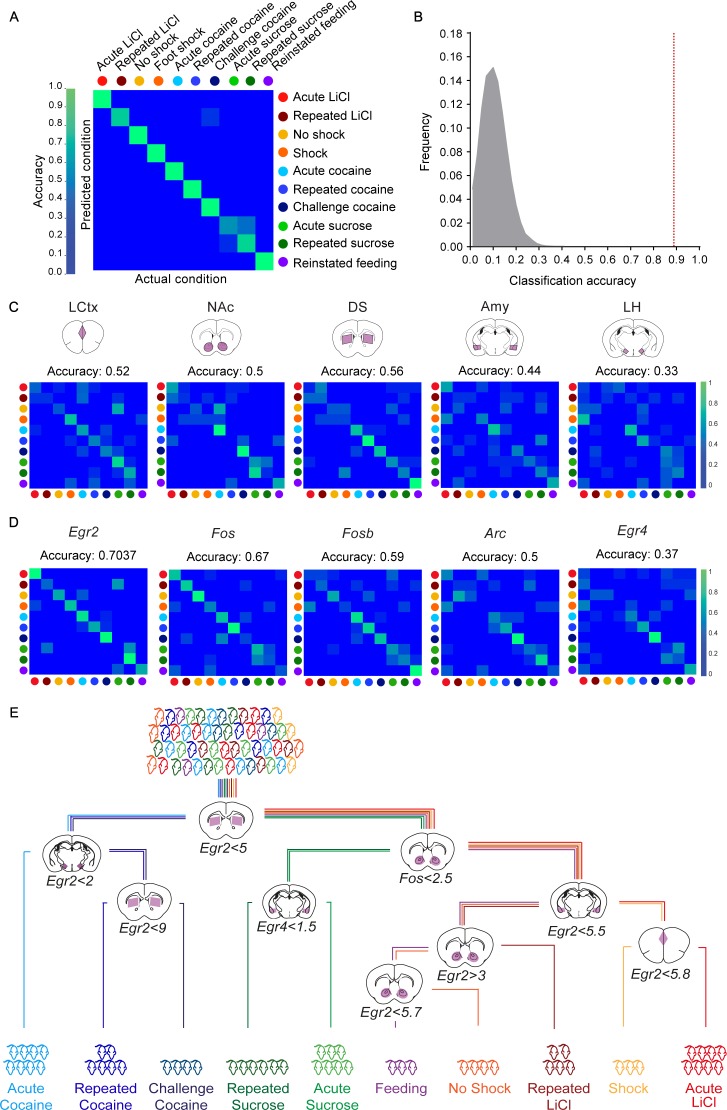
Figure 3. Decoding the recent experience of individual mice from minimal transcriptional signatures. (A) Confusion matrix representing the classification accuracy (90.7%) of decoding the recent experience of individual mice based on 25 features. Efficiency is scaled from blue to green, with bright green corresponding to 100% efficiency (n = 54 mice). (B) Verification of classification validity. A randomization test was performed, in which the classifier was run on 105 random permutations of the association of individual mice to the appropriate experience, and the frequency of classification accuracies is plotted in grey, while the red dotted line represents the classification accuracy obtained for non-randomized data (90.7%). (C, D) Confusion matrices representing the classification accuracy of decoding utilizing transcriptional measurements from individual brain structures (five genes in one structure, (C) or individual genes (single genes across five structures, (D). Dots represent the identity of the experience, color-coded according to A. X and Y axes denote the actual and predicted conditions. (E) A decision tree enabling the classification of mice according to experience by minimal gene expression (one of many possible trees which can equivalently segregate the data). Mice are classified based on features that enable maximal segregation at each internal node. The thresholds define the allocation of mice to the left branch of the tree at each bifurcation. Mice are color-coded according to experience.
Figure 3. Decoding the recent experience of individual mice from minimal transcriptional signatures. (A) Confusion matrix representing the classification accuracy (90.7%) of decoding the recent experience of individual mice based on 25 features. Efficiency is scaled from blue to green, with bright green corresponding to 100% efficiency (n = 54 mice). (B) Verification of classification validity. A randomization test was performed, in which the classifier was run on 105 random permutations of the association of individual mice to the appropriate experience, and the frequency of classification accuracies is plotted in grey, while the red dotted line represents the classification accuracy obtained for non-randomized data (90.7%). (C, D) Confusion matrices representing the classification accuracy of decoding utilizing transcriptional measurements from individual brain structures (five genes in one structure, (C) or individual genes (single genes across five structures, (D). Dots represent the identity of the experience, color-coded according to A. X and Y axes denote the actual and predicted conditions. (E) A decision tree enabling the classification of mice according to experience by minimal gene expression (one of many possible trees which can equivalently segregate the data). Mice are classified based on features that enable maximal segregation at each internal node. The thresholds define the allocation of mice to the left branch of the tree at each bifurcation. Mice are color-coded according to experience.CC BY · PubMed Central
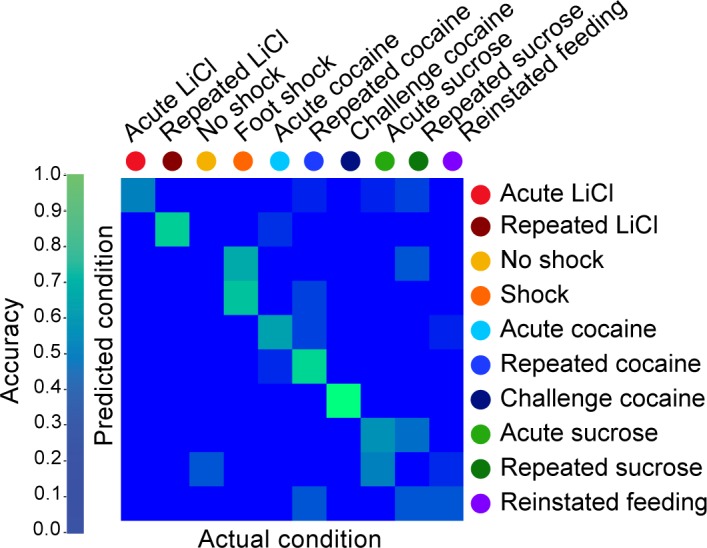
Figure 3—figure supplement 1. Decoding the recent experience of individual mice from averaged gene expression across different brain regions. Confusion matrix representing the classification accuracy (55.6%) of decoding the recent experience of individual mice based on averaged transcriptional induction of Arc, Egr2, Egr4, Fos and Fosb) across five structures (LCtx, limbic cortex; NAc, nucleus accumbens; DS, dorsal striatum; Amy, amygdala; LH, lateral hypothalamus and Hipp, hippocampus). Classification was performed using k-Nearest Neighbor Algorithm with a leave one out approach. Accuracy is scaled from blue to green, with bright green corresponding to 100% accuracy (n = 54 mice).
Figure 3—figure supplement 1. Decoding the recent experience of individual mice from averaged gene expression across different brain regions. Confusion matrix representing the classification accuracy (55.6%) of decoding the recent experience of individual mice based on averaged transcriptional induction of Arc, Egr2, Egr4, Fos and Fosb) across five structures (LCtx, limbic cortex; NAc, nucleus accumbens; DS, dorsal striatum; Amy, amygdala; LH, lateral hypothalamus and Hipp, hippocampus). Classification was performed using k-Nearest Neighbor Algorithm with a leave one out approach. Accuracy is scaled from blue to green, with bright green corresponding to 100% accuracy (n = 54 mice).CC BY · PubMed Central
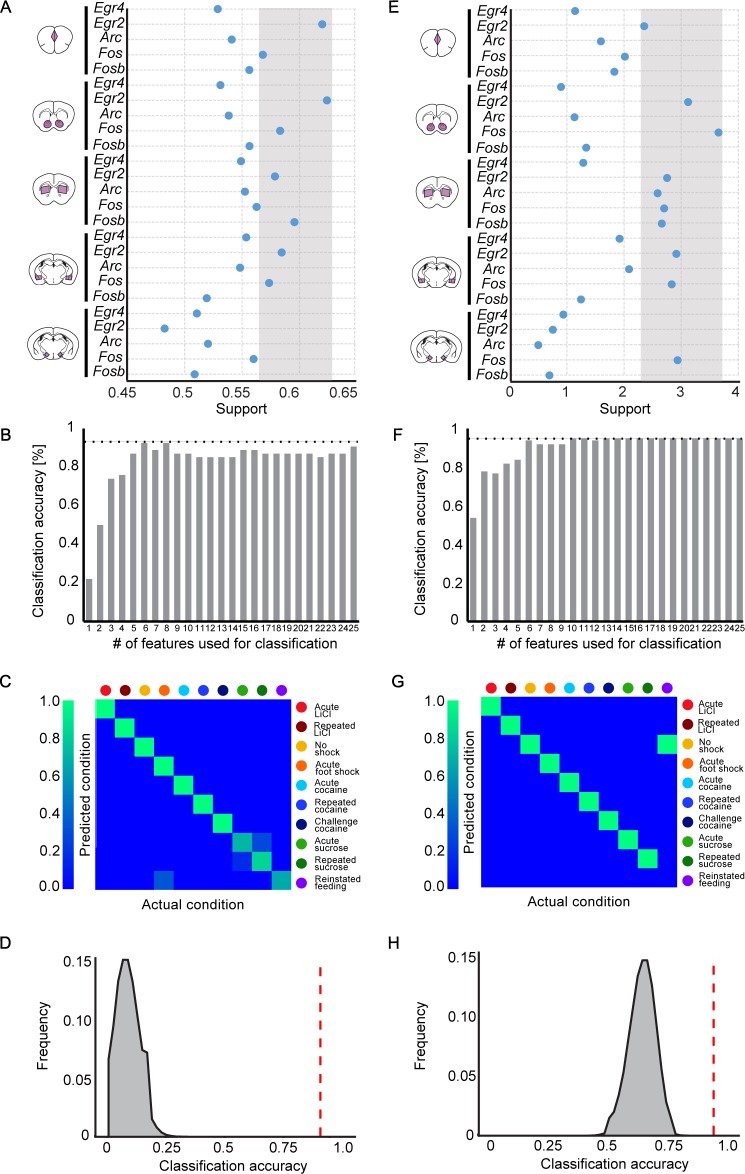
Figure 3—figure supplement 2. Feature selection to identify the features contributing most significantly to decoding. (A, E) Selection of features (expression of IEG in a brain structure) with the highest potential to contribute to the classification of recent experiences (‘support’). Support was defined by running 106 classifiers with varying composition of features, and calculating the mean accuracy for each feature over all the iterations to which it contributed, using the Random k-Nearest Neighbors algorithm (RKNN; A) or by calculating the decrease in Gini gain for each feature, using the Random Forest algorithm (RF; E). The grey zone defines the features with the highest support values, selected for classification. (B, F) Accuracy of classification obtained with an increase in the number of features. For each # (subset) of features, the features ranking highest in support were chosen and a KNN (B) or RF (F) classifier was evaluated using only those features. (C, G) Confusion matrix representing the classification accuracy of decoding the recent experience of individual mice based on the most informative features for KNN (Accuracy-93.6%; C) or most informative features for RF (Accuracy: 94.4%; G). Efficiency is scaled from blue to green, with bright green corresponding to 100% efficiency (n = 54 mice). (D, H) Verification of classification validity. A randomization test was performed, in which the classifier was run on 106 random permutations of the association of individual mice to the appropriate experience, and the frequency of classification accuracies is plotted in grey, while the red dotted line represents the classification accuracy obtained for non-randomized data.
Figure 3—figure supplement 2. Feature selection to identify the features contributing most significantly to decoding. (A, E) Selection of features (expression of IEG in a brain structure) with the highest potential to contribute to the classification of recent experiences (‘support’). Support was defined by running 106 classifiers with varying composition of features, and calculating the mean accuracy for each feature over all the iterations to which it contributed, using the Random k-Nearest Neighbors algorithm (RKNN; A) or by calculating the decrease in Gini gain for each feature, using the Random Forest algorithm (RF; E). The grey zone defines the features with the highest support values, selected for classification. (B, F) Accuracy of classification obtained with an increase in the number of features. For each # (subset) of features, the features ranking highest in support were chosen and a KNN (B) or RF (F) classifier was evaluated using only those features. (C, G) Confusion matrix representing the classification accuracy of decoding the recent experience of individual mice based on the most informative features for KNN (Accuracy-93.6%; C) or most informative features for RF (Accuracy: 94.4%; G). Efficiency is scaled from blue to green, with bright green corresponding to 100% efficiency (n = 54 mice). (D, H) Verification of classification validity. A randomization test was performed, in which the classifier was run on 106 random permutations of the association of individual mice to the appropriate experience, and the frequency of classification accuracies is plotted in grey, while the red dotted line represents the classification accuracy obtained for non-randomized data.CC BY · PubMed Central

Verification

Claims the paper makes

The claims and statistics of this paper haven’t been checked yet.

Run the check — free, no account needed. It reads the open-access text and checks the sources it cites.

A few free checks a day · papers already verified open instantly · results are public

Claims other papers make about this one

Each is checked against this paper’s own text: does it say what the citing paper says it does?

Self-check

Percentages, sums and reported differences re-computed from the paper’s own numbers.

The self-check needs the paper’s full text.

Citations

Cites

Show all 13 references

Research works printed but not linked: 36

  1. Bali, 2015, Electric foot shock stress: a useful tool in neuropsychiatric studies, Reviews in the Neurosciences, 26, 655, 10.1515/revneuro-2015-0015 · DOI
  2. Bialek, 1991, Reading a neural code, Science, 252, 1854, 10.1126/science.2063199 · DOI · Paper page
  3. Breiman, 1984, Classification and Regression Trees (The Wadsworth Statistics/Probability Series), 19
  4. Breiman, 2001, Random forests, Machine Learning, 45, 5, 10.1023/A:1010933404324 · DOI · Paper page
  5. Citri, 2011, Comprehensive qPCR profiling of gene expression in single neuronal cells, Nature Protocols, 7, 118, 10.1038/nprot.2011.430 · DOI
  6. Clayton, 2000, The genomic action potential, Neurobiology of Learning and Memory, 74, 185, 10.1006/nlme.2000.3967 · DOI · Paper page
  7. Collins, 2015, A new initiative on precision medicine, New England Journal of Medicine, 372, 793, 10.1056/NEJMp1500523 · DOI · Paper page
  8. Cruz, 2013, New technologies for examining the role of neuronal ensembles in drug addiction and fear, Nature Reviews Neuroscience, 14, 743, 10.1038/nrn3597 · DOI
  9. Eguchi, 2009, In vivo and in vitro visualization of gene expression dynamics over extensive areas of the brain, NeuroImage, 44, 1274, 10.1016/j.neuroimage.2008.10.046 · DOI
  10. Flavell, 2008, Signaling mechanisms linking neuronal activity to gene expression and plasticity of the nervous system, Annual Review of Neuroscience, 31, 563, 10.1146/annurev.neuro.31.060407.125631 · DOI · Paper page
  11. Fortin, 2016, The aversive agent lithium chloride suppresses phasic dopamine release through central GLP-1 receptors, Neuropsychopharmacology, 41, 906, 10.1038/npp.2015.220 · DOI
  12. Haber, 2010, The reward circuit: linking primate anatomy and human imaging, Neuropsychopharmacology, 35, 4, 10.1038/npp.2009.129 · DOI · Paper page
  13. Han H, Guo X, Yu H. 2016. Variable selection using mean decrease accuracy and mean decrease gini based on random forest. 7th IEEE Int. Conf. Softw.Eng. Serv. Sci.
  14. Horikawa, 2013, Neural decoding of visual imagery during sleep, Science, 340, 639, 10.1126/science.1234330 · DOI · Paper page
  15. Hyman, 2006, Neural mechanisms of addiction: the role of reward-related learning and memory, Annual Review of Neuroscience, 29, 565, 10.1146/annurev.neuro.29.051605.113009 · DOI · Paper page
  16. Kragel, 2016, Decoding spontaneous emotional states in the human brain, PLoS Biology, 14, e2000106, 10.1371/journal.pbio.2000106 · DOI
  17. Lanahan, 1998, Immediate-early genes and synaptic function, Neurobiology of Learning and Memory, 70, 37, 10.1006/nlme.1998.3836 · DOI
  18. Li, 2011, Random KNN feature selection - a fast and stable alternative to Random Forests, BMC Bioinformatics, 12, 450, 10.1186/1471-2105-12-450 · DOI
  19. Lin, 2005, Encoding social signals in the mouse main olfactory bulb, Nature, 434, 470, 10.1038/nature03414 · DOI · Paper page
  20. Lüscher, 2016, The emergence of a circuit model for addiction, Annual Review of Neuroscience, 39, 257, 10.1146/annurev-neuro-070815-013920 · DOI
  21. McKinney, 2010, A CD8+ T cell transcription signature predicts prognosis in autoimmune disease, Nature Medicine, 16, 586, 10.1038/nm.2130 · DOI · Paper page
  22. Minatohara, 2015, Role of immediate-early genes in synaptic plasticity and neuronal ensembles underlying the memory trace, Frontiers in Molecular Neuroscience, 8, 78, 10.3389/fnmol.2015.00078 · DOI
  23. Namburi, 2016, Architectural representation of valence in the limbic system, Neuropsychopharmacology, 41, 1697, 10.1038/npp.2015.358 · DOI
  24. Nestler, 2002, Common molecular and cellular substrates of addiction and memory, Neurobiology of Learning and Memory, 78, 637, 10.1006/nlme.2002.4084 · DOI
  25. Okuno, 2011, Regulation and function of immediate-early genes in the brain: beyond neuronal activity markers, Neuroscience Research, 69, 175, 10.1016/j.neures.2010.12.007 · DOI · Paper page
  26. Piechota, 2010, The dissection of transcriptional modules regulated by various drugs of abuse in the mouse striatum, Genome Biology, 11, R48, 10.1186/gb-2010-11-5-r48 · DOI
  27. Reber, 2002, Neural correlates of successful encoding identified using functional magnetic resonance imaging, Journal of Neuroscience, 22, 9541, 10.1523/JNEUROSCI.22-21-09541.2002 · DOI
  28. Robbins, 2008, Drug addiction and the memory systems of the brain, Annals of the New York Academy of Sciences, 1141, 1, 10.1196/annals.1441.020 · DOI
  29. Robinson, 2008, Review. The incentive sensitization theory of addiction: some current issues, Philosophical Transactions of the Royal Society B: Biological Sciences, 363, 3137, 10.1098/rstb.2008.0093 · DOI · Paper page
  30. Robison, 2011, Transcriptional and epigenetic mechanisms of addiction, Nature Reviews Neuroscience, 12, 623, 10.1038/nrn3111 · DOI · Paper page
  31. Russell, 1980, A circumplex model of affect, Journal of Personality and Social Psychology, 39, 1161, 10.1037/h0077714 · DOI · Paper page
  32. Santoro, 2017, Reconstructing the spectrotemporal modulations of real-life sounds from fMRI response patterns, PNAS, 114, 4799, 10.1073/pnas.1617622114 · DOI
  33. Stanley, 2013, Reading and writing the neural code, Nature Neuroscience, 16, 259, 10.1038/nn.3330 · DOI
  34. Sylwestrak, 2016, Multiplexed intact-tissue transcriptional analysis at cellular resolution, Cell, 164, 792, 10.1016/j.cell.2016.01.038 · DOI
  35. Turm, 2014, Comprehensive analysis of transcription dynamics from brain samples following behavioral experience, Journal of Visualized Experiments, 10.3791/51642 · DOI
  36. Ye, 2016, Wiring and molecular features of prefrontal ensembles representing distinct experiences, Cell, 165, 1776, 10.1016/j.cell.2016.05.010 · DOI · Paper page

Cited by

See all 46

Metadata

Authors
Mukherjee, D., Ignatowska-Jankowska, B. M., Itskovits, E., Gonzales, B. J., Turm, H., Izakson, L., Haritan, D., Bleistein, N., Cohen, C., Amit, I., Shay, T., Grueter, B., Zaslaver, A., & Citri, A.
Affiliations
  • Department of Biological Chemistry, Silberman Institute of Life Sciences, The Hebrew University, Jerusalem, Israel
  • The Edmond and Lily Safra Center for Brain Sciences, The Hebrew University, Jerusalem, Israel
  • Department of Genetics, Silberman Institute of Life Sciences, The Hebrew University, Jerusalem, Israel
  • Department of Immunology, Weizmann Institute of Science, Rehovot, Israel
  • Department of Life Sciences, Ben-Gurion University of the Negev, Beer-Sheva, Israel
  • Department of Psychiatry, Vanderbilt University School of Medicine, Nashville, United States
Venue
eLife
Published
2018-02-07
Volume
7
ISSN
2050-084X
Cited by
46
References
13
Language
en
Funders
  • Shimon Peres Postdoctoral Award (Postdoctoral stipend)
  • ELSC Postdoctoral Award (Postdoctoral stipend)
  • Lady Davis Fellowship Trust, Hebrew University of Jerusalem (Postdoctoral stipend)
  • Israel Science Foundation (Personal Grant 393/12 & I-CORE 1796/12, 2341/1)
  • German-Israeli Foundation for Scientific Research and Development (Young Investigator Award 2299-2291.1./2011)
  • Brain and Behavior Research Foundation (Young Investigator Award #18795)
  • Canadian Institute for Advanced Research (Research Support)
  • Binational United-States Israel Research Foundation (Research Grant #2011266)
  • Milton Rosenbaum Research Foundation (Research Grant)
  • National Institute for Psychobiology in Israel, Hebrew University of Jerusalem (Research Grant 109-15-16)
  • H2020 Marie Skłodowska-Curie Actions (PCIG13-GA-2013–61820)
  • Stewart Resnick Foundation

About these checks

Registry, retraction, Cites and statistics results are computed, not judged, with one exception: a printed reference that no index lists is read once by a model before it counts as a citation error. Claims are extracted by a model and kept only when their quote appears verbatim in the text; each cited source is then checked, with a model’s help, for whether it says what the claim relies on. Those verdicts can be wrong — read the claim’s quote and the cited source before relying on one.

Statistics and arithmetic are recomputed, not judged.

Confidence bands are shown only for fields calibrated on our annotated test set. None is calibrated yet, so no band is shown.

What counts as a claim ›How we measure confidence ›How we check this ›

Are you an author, or do you see a problem with this page? Request a review

How to cite

Cite CoChat for the checks on this page, and the paper for its own findings.

This page
CoChat. (2026). Citation check: Salient experiences are represented by unique transcriptional signatures in the mouse brain. https://app.cochat.ai/papers/10.7554/elife.31220
The paper
Mukherjee, D., Ignatowska-Jankowska, B. M., Itskovits, E., Gonzales, B. J., Turm, H., Izakson, L., Haritan, D., Bleistein, N., Cohen, C., Amit, I., Shay, T., Grueter, B., Zaslaver, A., & Citri, A. (2018). Salient experiences are represented by unique transcriptional signatures in the mouse brain. eLife. https://doi.org/10.7554/elife.31220

Data sources

Bibliographic data: Semantic Scholar, OpenAlex, Crossref.

Contains information from the Semantic Scholar Academic Graph Datasets, made available under the ODC Attribution License (ODC-BY 1.0).

Semantic Scholar’s data is described in: Kinney, R., et al. (2023). The Semantic Scholar Open Data Platform. arXiv:2301.10140.