

The DOI matches its Crossref record; 137 of the 140 references it cites were found in a registry or an index; 27 of the 40 sources its claims cite were checked for support.
Thyroid hormone regulates distinct paths to maturation in pigment cell lineages
Open accessPublished version of a preprint
Abstract
Thyroid hormone (TH) regulates diverse developmental events and can drive disparate cellular outcomes. In zebrafish, TH has opposite effects on neural crest derived pigment cells of the adult stripe pattern, limiting melanophore population expansion, yet increasing yellow/orange xanthophore numbers. To learn how TH elicits seemingly opposite responses in cells having a common embryological origin, we analyzed individual transcriptomes from thousands of neural crest-derived cells, reconstructed developmental trajectories, identified pigment cell-lineage specific responses to TH, and assessed roles for TH receptors. We show that TH promotes maturation of both cell types but in distinct ways. In melanophores, TH drives terminal differentiation, limiting final cell numbers. In xanthophores, TH promotes accumulation of orange carotenoids, making the cells visible. TH receptors act primarily to repress these programs when TH is limiting. Our findings show how a single endocrine factor integrates very different cellular activities during the generation of adult form.
Overview
AI snapshot
Written from the paper’s full text.
TL;DR
Thyroid hormone (TH) promotes maturation of both melanophore and xanthophore lineages in zebrafish, but through distinct mechanisms rather than by biasing fate specification or having discordant lineage-specific effects. Single-cell transcriptomics and functional assays show TH drives terminal differentiation/proliferative arrest in melanophores and carotenoid-dependent repigmentation in xanthophores, with unliganded TH receptors acting primarily as repressors.
Key findings
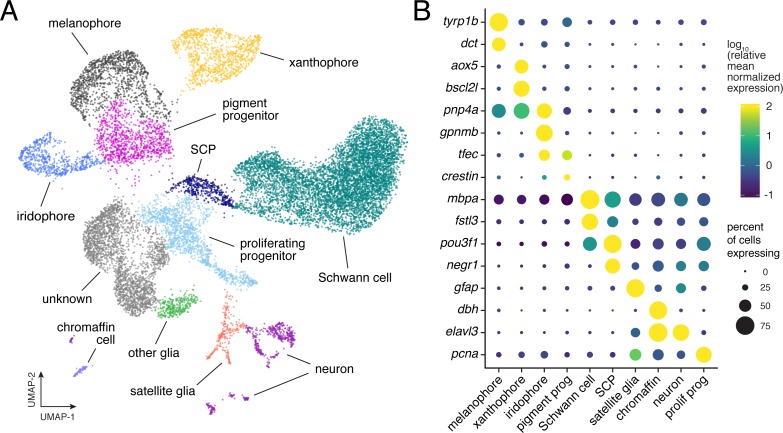
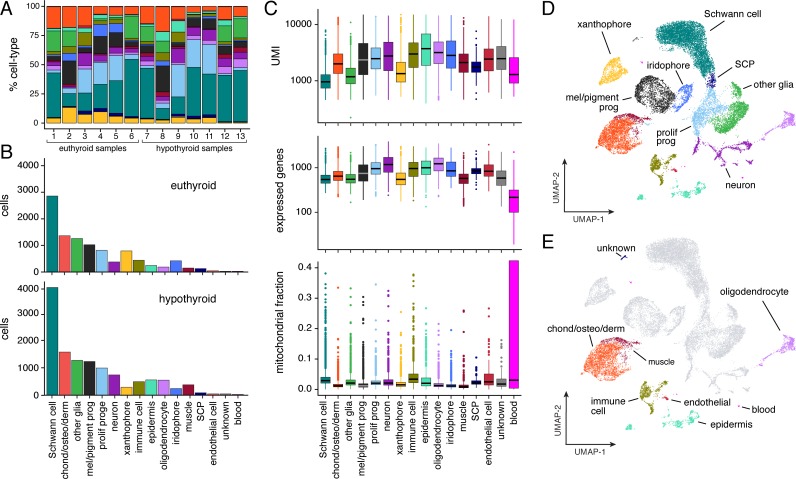
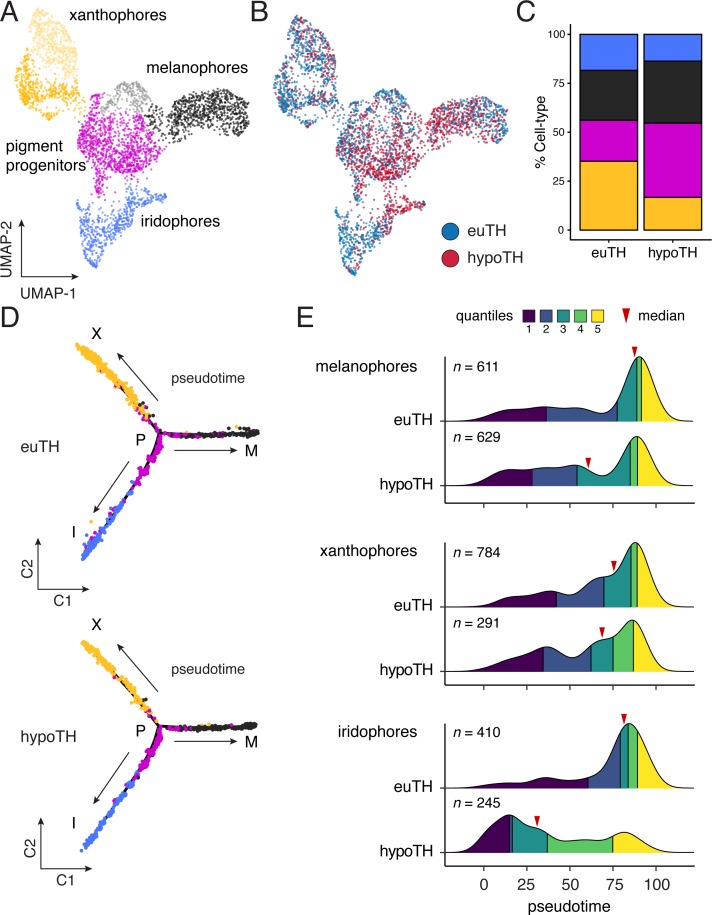
- Single-cell RNA sequencing of 16,150 neural crest-derived cells from euthyroid and hypothyroid zebrafish identified melanophores, xanthophores, iridophores, pigment progenitors, neurons, Schwann cells, other glia, and chromaffin cells; hypothyroid and euthyroid trajectories were topologically equivalent, and progenitors were not depleted in hypothyroid fish.
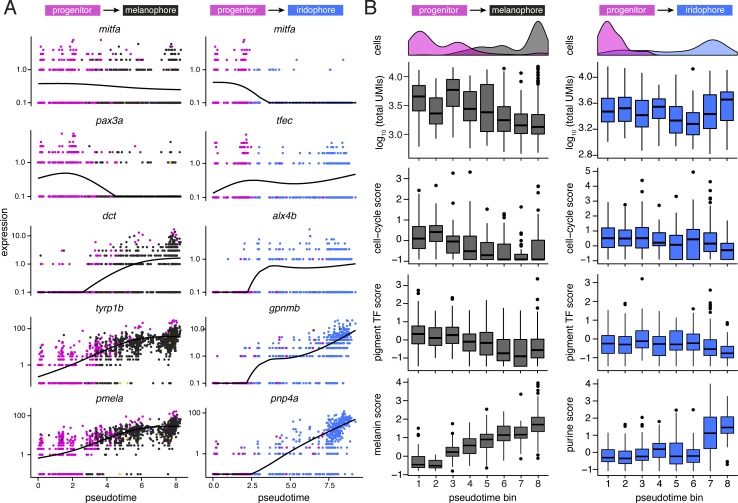
- Hypothyroid pigment cells were biased toward early pseudotime across all pigment lineages (Wilcoxon signed-rank tests: melanophores Z = −6.54, p<0.0001; xanthophores Z = −4.54, p<0.0001; iridophores Z = −13.55, p<0.0001), arguing against TH controlling fate specification or lineage-specific amplification/restraint.
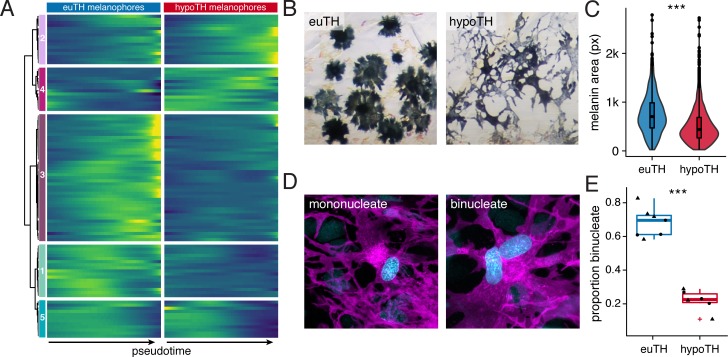
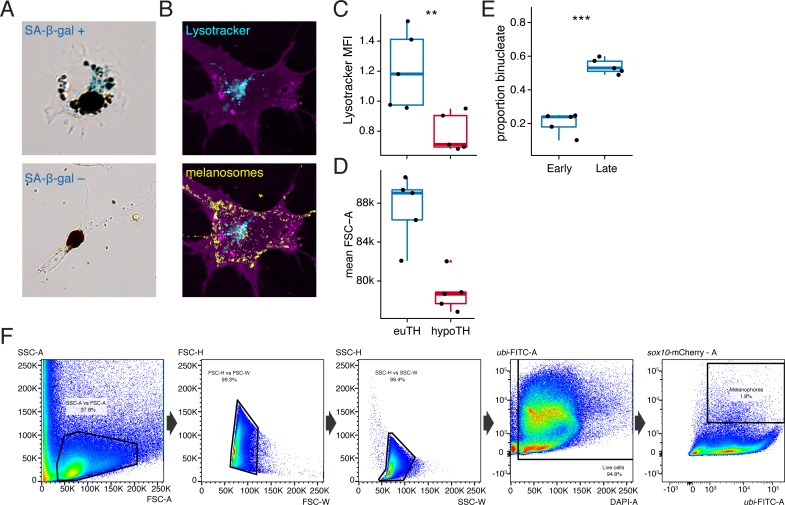
- TH promoted melanophore maturation: euthyroid melanophores had more melanin (F1,2710=271.2, p<0.0001; ~1.7× total melanin content by area estimate), greater lysosomal content, larger forward scatter, and more binucleation (~70% vs ~25% in stage-matched hypothyroid fish; χ2=230.3, d.f.=1, p<0.0001).
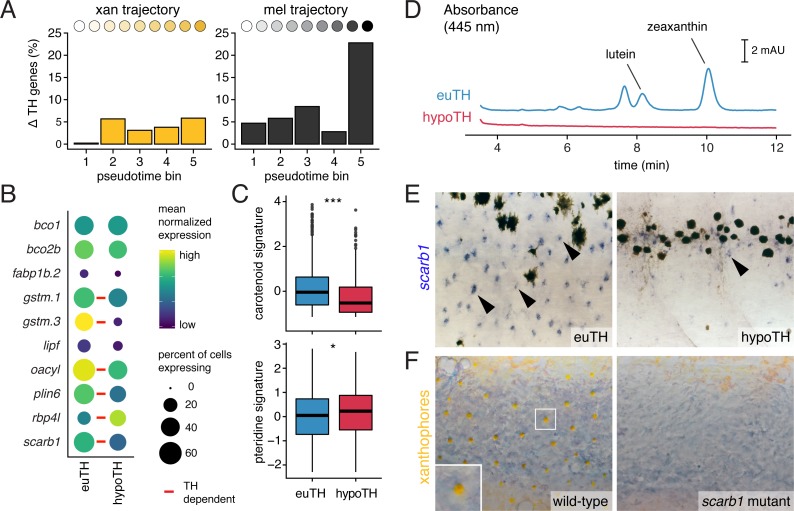
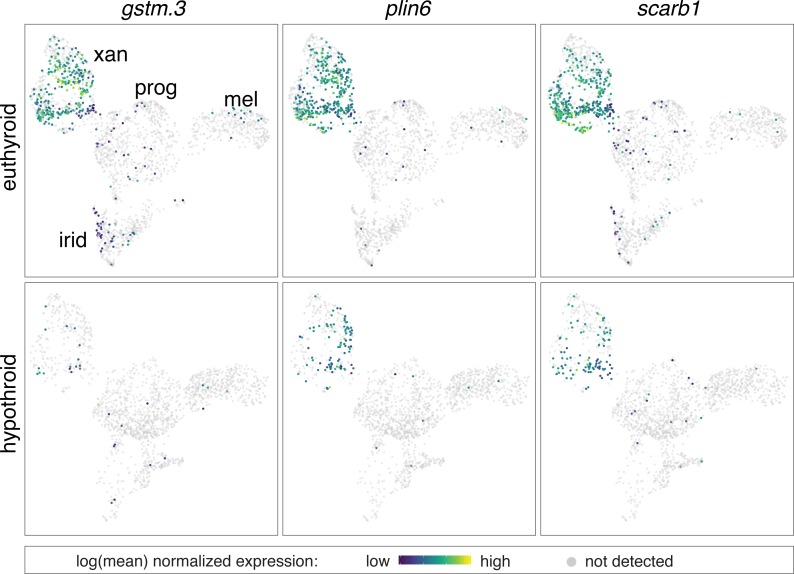
- TH promoted xanthophore carotenoid repigmentation: xanthophores had fewer TH-dependent genes than melanophores (3.6% vs 9%; 160 vs 519 DEGs, only 58 overlapping), carotenoid pathway scores were higher in euthyroid xanthophores (p=1.5E-15), scarb1 was expressed more highly in euthyroid xanthophores (q=1.1E-10), and scarb1 mutants lacked mature yellow xanthophores; TR mutations rescued hypothyroid melanophore and xanthophore phenotypes.
Methods
- Zebrafish were made hypothyroid by nitroreductase-mediated thyroid ablation in Tg(tg:nVenus-v2a-nfnB) fish; euthyroid and hypothyroid siblings were compared.
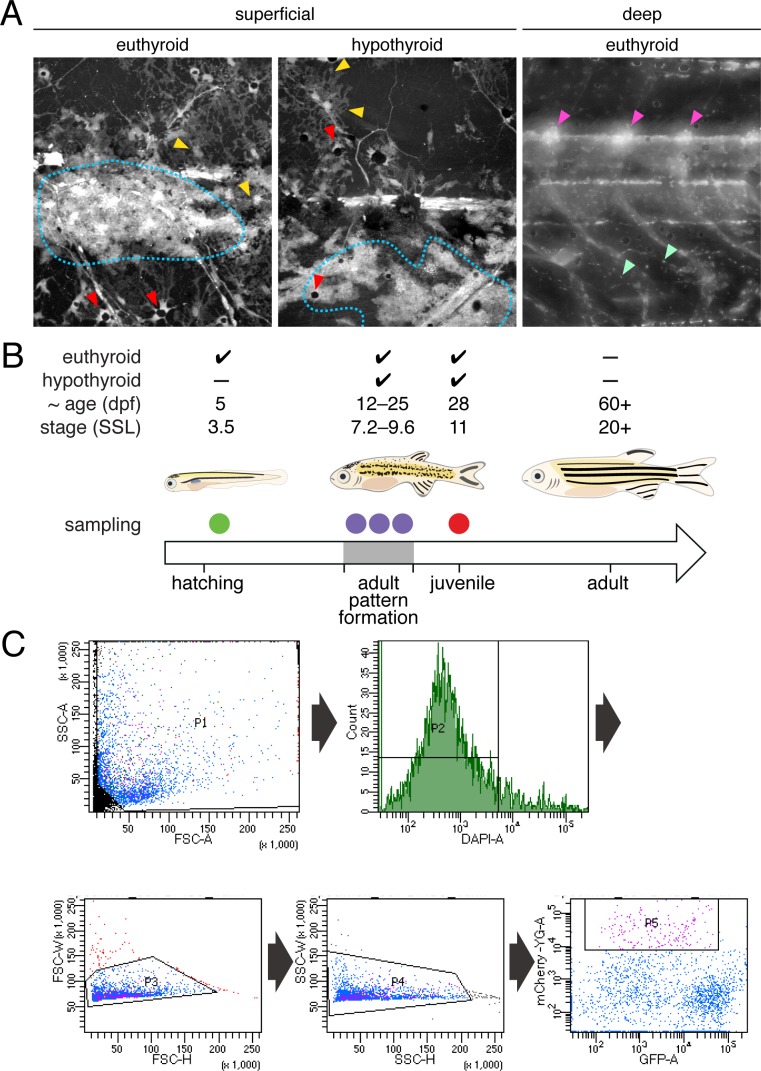
- Neural crest-derived cells were lineage-labeled with Tg(sox10:Cre; ubi:switch), dissociated from trunks/skins, FACS-purified, and processed for 10X Chromium single-cell RNA sequencing across 5 dpf, 7.2 SSL, 8.6 SSL, 9.6 SSL, and 11 SSL; the gene-barcode matrix contained ~25,000 barcoded cells, with 16,150 cells assigned in Figure 2A.
- Analyses included UMAP/louvain clustering, Monocle pseudotime and BEAM, differential expression across pseudotime, pathway signature scores, plus imaging, cell counts, HPLC for carotenoids, FACS for lysosomal content, TEM, and CRISPR/Cas9 mutants for scarb1 and TH receptors.
Limitations
- Stated: the analyses cannot indicate whether TH acts directly on pigment cells through autonomous TR activity; TH could act on stromal or other cell types, and iridophores/stromal cells also regulate melanophore and xanthophore numbers.
- Stated: roles for TRs are likely complex and context-dependent; loss of TRs in euthyroid fish did not cause precocious xanthophore pigmentation, suggesting other late-stage factors are required.
- Stated/evident: SA-β-gal staining could not be scored reliably across TH conditions; FSC-A can be influenced by cell-size-independent factors; pseudotime is inferred rather than true developmental time, and the reconstructed trajectory topology differed from known lineage relationships.
Model-written summary. Check it against the paper before relying on it.
Integrity signals
Registry
Cites
Statistics
Figures
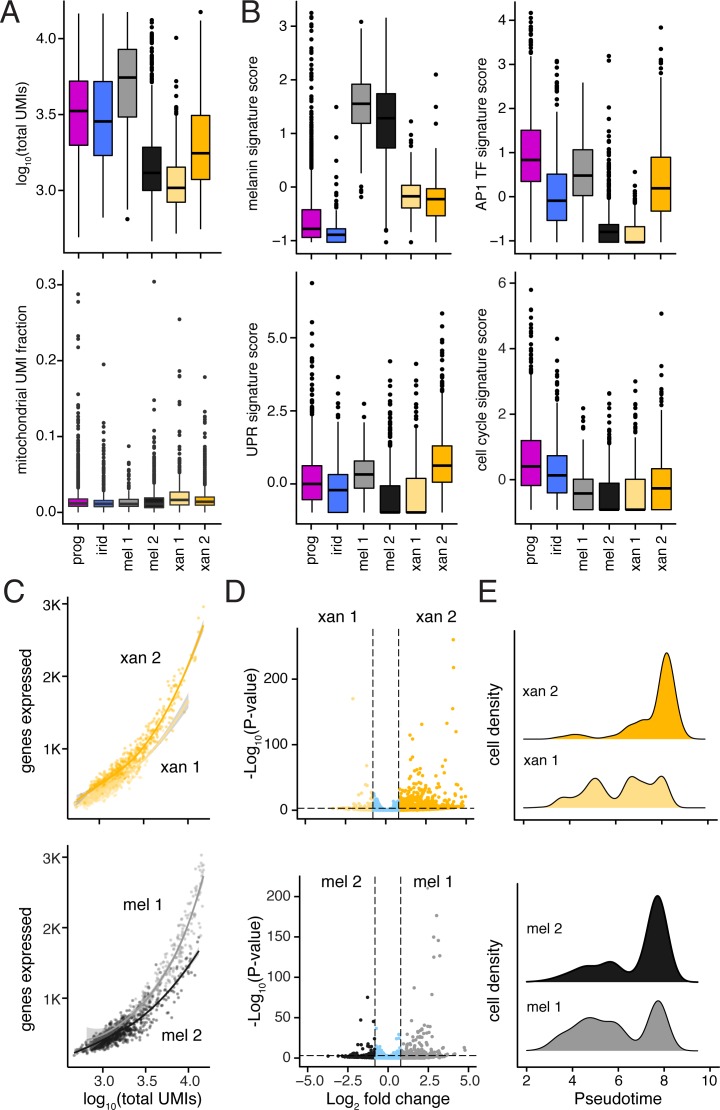
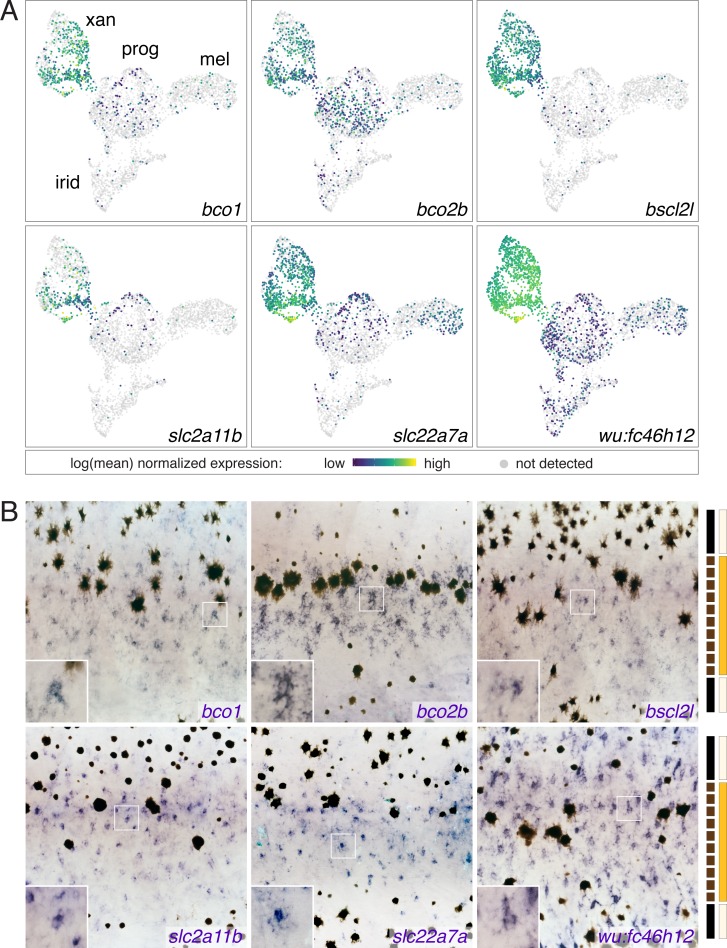
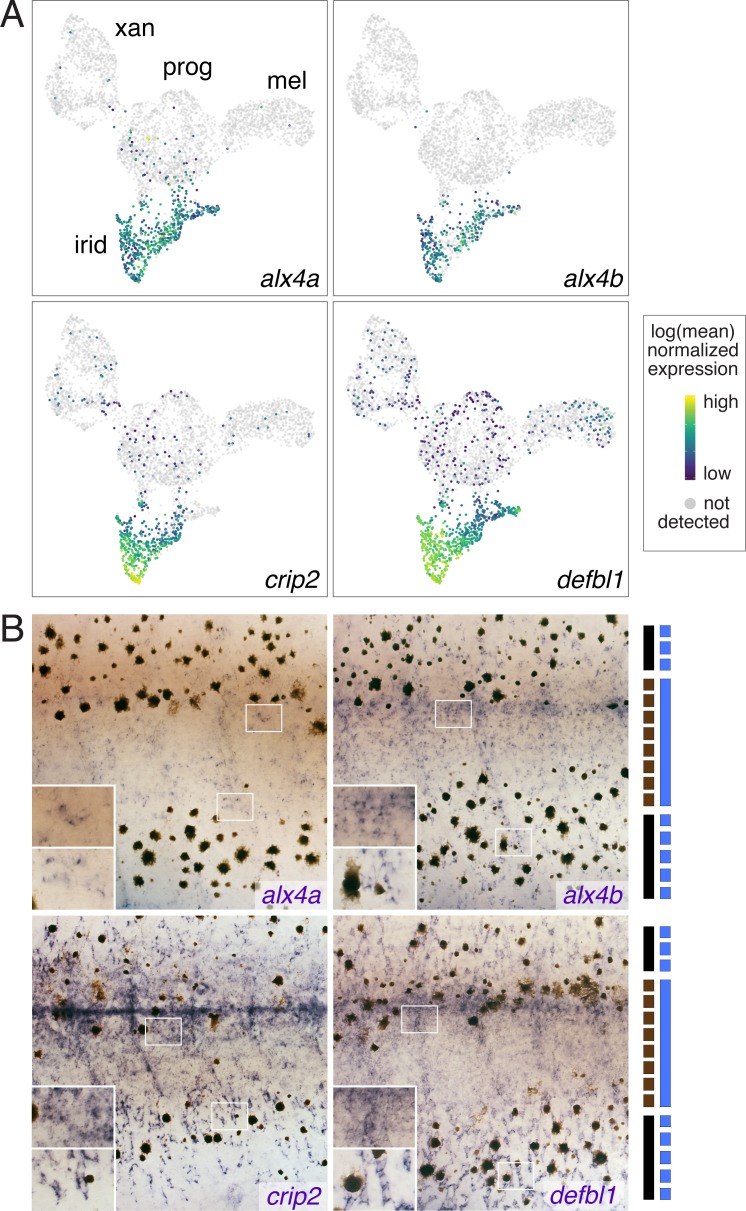
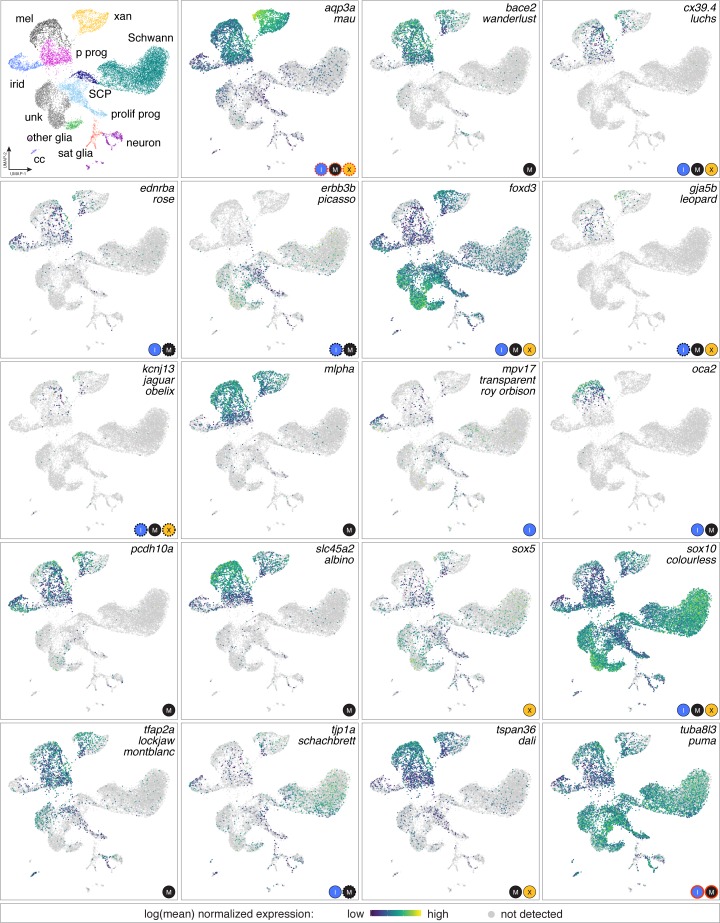
Verification
Claims the paper makes
58 Own result · 20 Own interpretation · 17 Own method · 15 Partly supported · 4 No full text of the sources · 3 Supported · 2 Supported so far · 1 Not checked yet · 1 No basis given · accuracy not yet measured
The cited sources support only part of this claim — read each source’s verdict below.
In the paper
“In contrast to adult melanophores that arise from a transit-amplifying progenitor”
§ Thyroid hormone regulates distinct paths to maturation in pigment cell lineages > Discussion
What the sources say
- Partly supportedcites McMenamin et al., 2014 sourceExperimental — accuracy not yet measured
The passage labeled Abstract (page unavailable) says adult body melanophores arise from extra-hypodermal, peripheral nerve-associated precursors and describes presumptive melanophore precursors differentiating. It does not identify those precursors as transit-amplifying, so the specific progenitor type is unsupported. (LLM, conf=0.83)
- Partly supportedcites Patterson et al., 2014 sourceExperimental — accuracy not yet measured
The Discussion (page unavailable in our copy) says adult melanophores arise from motile precursors that migrate to the hypodermis and begin differentiating. It does not describe those precursors as transit-amplifying, so the specific progenitor type is unsupported. (LLM, conf=0.82)
plaindirect- Asserted: passes — The authors put it forward as true.
- Checkable: passes — It can be checked against evidence.
- Load-bearing: passes — The paper’s conclusions depend on it.
- Based: passes — The paper gives a reason why it holds.
- Partly supported
Every source the paper cites for this claim was checked and supports it.
In the paper
“Our findings are broadly consistent with a role for TH in balancing proliferation and differentiation (Brent, 2012)”
§ Thyroid hormone regulates distinct paths to maturation in pigment cell lineages > Discussion
What the sources say
- Supportedcites Brent, 2012 source
The ‘TR isoforms and neural development’ section describes thyroid hormone receptors promoting neural differentiation, while the ‘Association of thyroid hormone receptor mutations with cancer’ section describes thyroid hormone signaling and receptor mutations affecting cellular proliferation. Together, these passages support the citing authors’ broad, hedged interpretation that thyroid hormone has a role in balancing the two processes; the source does not assess the citing authors’ own findings. (LLM, conf=0.83)
hedgedconditional- Asserted: passes — The authors put it forward as true.
- Checkable: passes — It can be checked against evidence.
- Load-bearing: passes — The paper’s conclusions depend on it.
- Based: passes — The paper gives a reason why it holds.
- Supported
The cited sources support only part of this claim — read each source’s verdict below.
In the paper
“TH similarly promotes the melanization of melanoblasts ex vivo and a cessation of proliferative activity in vivo (McMenamin et al., 2014).”
§ Thyroid hormone regulates distinct paths to maturation in pigment cell lineages > Discussion
What the sources say
- Partly supportedcites McMenamin et al., 2014 sourceExperimental — accuracy not yet measured
The passage discussing Fig. 4A reports that melanophores rarely divided in euthyroid larvae but divided frequently in hypothyroid larvae. It concludes that TH represses melanophore proliferation in vivo; it does not show a complete cessation of proliferation. (LLM, conf=0.84)
plaindirect- Asserted: passes — The authors put it forward as true.
- Checkable: passes — It can be checked against evidence.
- Load-bearing: passes — The paper’s conclusions depend on it.
- Based: passes — The paper gives a reason why it holds.
- Partly supported
The cited sources support only part of this claim — read each source’s verdict below.
In the paper
“Indeed, prior analyses showed that addition of exogenous TH to hypothyroid cells ex vivo can promote differentiation of unpigmented melanoblasts to melanophores (McMenamin et al., 2014), contrary to the idea that TH specifically blocks melanophore development.”
§ Thyroid hormone regulates distinct paths to maturation in pigment cell lineages > Results > TH-independence of pigment cell fate specification and absence of lineage-specific restraints on developmental progress
What the sources say
- Partly supportedcites McMenamin et al., 2014 sourceExperimental — accuracy not yet measured
In the passage labeled Abstract (page unavailable), the paper reports that melanophore precursors in hypothyroid larvae were less likely to differentiate and concludes that TH promotes their differentiation. It does not report adding TH to hypothyroid cells ex vivo or observing unpigmented melanoblasts become melanophores in that setting. (LLM, conf=0.86)
plaindirect- Asserted: passes — The authors put it forward as true.
- Checkable: passes — It can be checked against evidence.
- Load-bearing: passes — The paper’s conclusions depend on it.
- Based: passes — The paper gives a reason why it holds.
- Partly supported
The cited sources support only part of this claim — read each source’s verdict below.
In the paper
“TH similarly promotes the melanization of melanoblasts ex vivo and a cessation of proliferative activity in vivo (McMenamin et al., 2014).”
§ Thyroid hormone regulates distinct paths to maturation in pigment cell lineages > Discussion
What the sources say
- Partly supportedcites McMenamin et al., 2014 sourceExperimental — accuracy not yet measured
The passage on melanophore lineage development (section labeled Abstract; page unavailable) says thyroid hormone promotes melanophore precursor differentiation and represses melanophore proliferation in larvae. It does not report that thyroid hormone promotes melanoblast melanization ex vivo; the experiments described were in fish. (LLM, conf=0.85)
plaindirect- Asserted: passes — The authors put it forward as true.
- Checkable: passes — It can be checked against evidence.
- Load-bearing: passes — The paper’s conclusions depend on it.
- Based: passes — The paper gives a reason why it holds.
- Partly supported
The cited sources support only part of this claim — read each source’s verdict below.
In the paper
“most adult xanthophores develop directly from EL xanthophores that lose their pigment and then regain color late in adult pattern formation”
§ Thyroid hormone regulates distinct paths to maturation in pigment cell lineages > Discussion
What the sources say
- Partly supportedcites McMenamin et al., 2014 sourceExperimental — accuracy not yet measured
The fate-mapping passage (section labeled Abstract; page unavailable) reports that some adult xanthophores arise directly from embryonic/early larval xanthophores that lose pigment and later redifferentiate. It also identifies an independent source of adult xanthophores, so it does not establish the claim that most arise from the early larval cells. (LLM, conf=0.89)
- Partly supportedcites Patterson et al., 2014 sourceExperimental — accuracy not yet measured
The Discussion (page unavailable) says that D. rerio adult interstripe xanthophores develop from cells already in the hypodermis, including embryonic xanthophores that temporarily lose pigment and later reacquire it. It does not say that most adult xanthophores follow this route, so the claim overstates the proportion and extends the description beyond interstripe xanthophores. (LLM, conf=0.87)
plaindirect- Asserted: passes — The authors put it forward as true.
- Checkable: passes — It can be checked against evidence.
- Load-bearing: passes — The paper’s conclusions depend on it.
- Based: passes — The paper gives a reason why it holds.
- Partly supported
The cited sources support only part of this claim — read each source’s verdict below.
In the paper
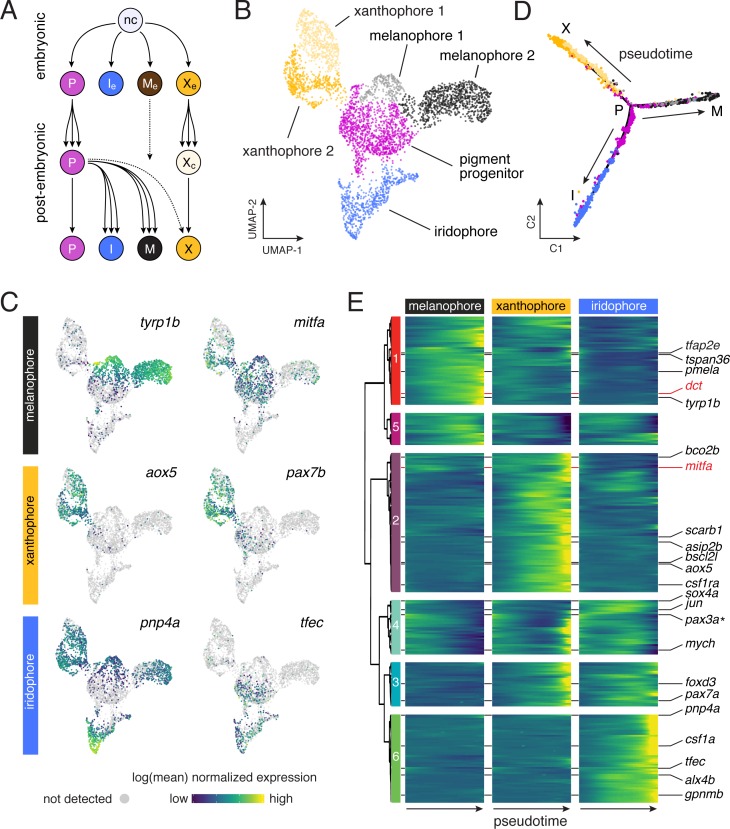
“Most adult xanthophores develop directly from EL xanthophores that lose their pigment and then reacquire it late in adult pattern formation (Figure 3A) (McMenamin et al., 2014).”
§ Thyroid hormone regulates distinct paths to maturation in pigment cell lineages > Results > TH promotes carotenoid-dependent xanthophore re-pigmentation during adult development
What the sources say
- Partly supportedcites McMenamin et al., 2014 sourceExperimental — accuracy not yet measured
The fate-mapping passage (section labeled Abstract; page unavailable) says that some adult xanthophores arise directly from embryonic/early larval xanthophores that lose pigment and later reacquire it. It also identifies an independent source of adult xanthophores and does not establish that the embryonic/early larval lineage accounts for most of them. (LLM, conf=0.88)
plaindirect- Asserted: passes — The authors put it forward as true.
- Checkable: passes — It can be checked against evidence.
- Load-bearing: passes — The paper’s conclusions depend on it.
- Based: passes — The paper gives a reason why it holds.
- Partly supported
The cited sources support only part of this claim — read each source’s verdict below.
In the paper
“stromal cells of the hypodermis (Lang et al., 2009) and also iridophores (Frohnhöfer et al., 2013; Patterson and Parichy, 2013) regulate melanophore and xanthophore numbers during adult pigment pattern formation”
§ Thyroid hormone regulates distinct paths to maturation in pigment cell lineages > Discussion
What the sources say
- Supportedcites Lang et al., 2009 source
The Results section on cell transplantation reports that wild-type hypodermal cells were associated with denser melanophore patches and that their effect was non-autonomous. The Discussion reports that bnc2 acts non-autonomously to promote persistence of melanophores and xanthophores in the hypodermis during adult pattern formation. The separate claim about iridophores is attributed to other citations, not Lang et al. (LLM, conf=0.86)
- Partly supportedcites Frohnhöfer et al., 2013 sourceExperimental — accuracy not yet measured
The Results section, “Development of the adult pattern in iridophore mutants” (page unavailable), reports markedly fewer melanophores in mutants with reduced or absent iridophores. It describes delayed xanthophore appearance and altered distribution, but does not establish that iridophores regulate xanthophore numbers. The stromal-cell part of the sentence is attributed to a different citation and is not judged here. (LLM, conf=0.86)
- Supportedcites Patterson and Parichy, 2013 source
The Results report that iridophore-ablated fish developed a growing xanthophore deficiency (Figure 5C). They also report significantly more melanophores in an iridophore-ablated interstripe region (Figure 8E). These findings support the part of the sentence attributed to Patterson and Parichy: that iridophores affect the numbers of both cell types during adult pigment pattern formation. (LLM, conf=0.92)
plaindirect- Asserted: passes — The authors put it forward as true.
- Checkable: passes — It can be checked against evidence.
- Load-bearing: unclear — It is unclear whether the paper’s conclusions depend on it.
- Based: passes — The paper gives a reason why it holds.
- Supported
The sources with a verdict support this claim; the rest weren’t checked yet, have no full text we could read, or their verdicts aren’t rated yet.
In the paper
“Loss of TRs similarly allows the survival of congenitally hypothyroid mice”
§ Thyroid hormone regulates distinct paths to maturation in pigment cell lineages > Discussion
What the sources say
- Supportedcites Flamant et al., 2002 source
In “Survival Without Thyroid Gland and TR” (page not specified), the paper reports that most congenitally hypothyroid Pax8−/− mice lacking TRα survived to adulthood. It also reports one adult survivor lacking both TRα and TRβ; loss of TRβ alone did not rescue survival. (LLM, conf=0.91)
- Not checked — no full text of the sourcecites Flamant and Samarut, 2003 source
plaindirect- Asserted: passes — The authors put it forward as true.
- Checkable: passes — It can be checked against evidence.
- Load-bearing: unclear — It is unclear whether the paper’s conclusions depend on it.
- Based: passes — The paper gives a reason why it holds.
- Supported
The cited sources support only part of this claim — read each source’s verdict below.
In the paper
“TRs may therefore prevent the inappropriate activation of gene expression programs required for lineage maturation when TH levels are low”
§ Thyroid hormone regulates distinct paths to maturation in pigment cell lineages > Discussion
What the sources say
- Supportedcites Choi et al., 2015 source
The Discussion reports that TRα represses thyroid-hormone-response genes before hormone enters circulation, delaying hind-limb development in Xenopus tadpoles. This supports the hedged claim that TRs may prevent premature activation of developmental gene programs when thyroid hormone is low. (LLM, conf=0.87)
- Partly supportedcites Shi, 2013 sourceExperimental — accuracy not yet measured
Section 2 says that, in the absence of TH, unliganded TR represses TH-inducible genes and prevents premature metamorphic organ transformations in tadpoles. Section 5 likewise says TR-RXR can prevent precocious metamorphosis of an organ. These passages support the proposed low-TH repression mechanism, but the paper frames its developmental finding around frog metamorphosis, not lineage maturation generally. (LLM, conf=0.82)
hedgedconditional- Asserted: passes — The authors put it forward as true.
- Checkable: passes — It can be checked against evidence.
- Load-bearing: passes — The paper’s conclusions depend on it.
- Based: passes — The paper gives a reason why it holds.
- Supported
- Probably not a substantial claim. 22
- It may state two separate claims as one. 45
Every source the paper cites for this claim was checked and supports it.
In the paper
“although FSC-A can be influenced by cell-size-independent factors as well (Tzur et al., 2011).”
§ Thyroid hormone regulates distinct paths to maturation in pigment cell lineages > Results > TH promotes a melanophore maturation program
What the sources say
- Supportedcites Tzur et al., 2011 source
The Introduction explicitly says that FSC-A measurements are influenced not only by particle size but also by refractive-index differences, absorbing substances, and the optical design of the measurement system. This directly supports the citing sentence's qualified claim. (LLM, conf=0.95)
plaincorrelational- Asserted: passes — The authors put it forward as true.
- Checkable: passes — It can be checked against evidence.
- Load-bearing: fails — The paper’s conclusions may not depend on it.
- Based: passes — The paper gives a reason why it holds.
Probably not a substantial claim. The paper’s conclusions may not depend on it.
- Supported
The cited sources support only part of this claim — read each source’s verdict below.
In the paper
“Fish lacking TH have gross defects in pigment cell numbers and pattern with ~two fold the normal complement of melanophores and the simultaneous absence of visible xanthophores (McMenamin et al., 2014).”
§ Thyroid hormone regulates distinct paths to maturation in pigment cell lineages > Discussion
What the sources say
- Partly supportedcites McMenamin et al., 2014 sourceExperimental — accuracy not yet measured
The paper’s thyroid-ablation passage (section labeled Abstract; page unavailable) reports excess melanophores and a lack of adult body xanthophores in juvenile fish. It also says some xanthophores developed later, and the passages do not establish the claimed approximately twofold melanophore count. (LLM, conf=0.86)
plaindirect- Asserted: passes — The authors put it forward as true.
- Checkable: passes — It can be checked against evidence.
- Load-bearing: passes — The paper’s conclusions depend on it.
- Based: passes — The paper gives a reason why it holds.
It may state two separate claims as one.
- Partly supported
The cited sources support only part of this claim — read each source’s verdict below.
In the paper
“fish lacking TH have about twice the normal number of melanophores and lack visible xanthophores (Figure 1A) (McMenamin et al., 2014).”
§ Thyroid hormone regulates distinct paths to maturation in pigment cell lineages > Introduction
What the sources say
- Partly supportedcites McMenamin et al., 2014 sourceExperimental — accuracy not yet measured
The passage labeled Abstract (no page supplied), describing Fig. 1, reports that fish thyroid-ablated early in development lacked adult body xanthophores and had excess melanophores. It does not quantify the excess as about twice the normal number. It also notes that some xanthophores developed later, so their absence is not permanent. (LLM, conf=0.86)
plaindirect- Asserted: passes — The authors put it forward as true.
- Checkable: passes — It can be checked against evidence.
- Load-bearing: passes — The paper’s conclusions depend on it.
- Based: passes — The paper gives a reason why it holds.
It may state two separate claims as one.
- Partly supported
The cited sources support only part of this claim — read each source’s verdict below.
In the paper
“Prior analyses indicated that melanophores of euthyroid fish fail to divide whereas those of hypothyroid fish continue to do so (McMenamin et al., 2014).”
§ Thyroid hormone regulates distinct paths to maturation in pigment cell lineages > Results > TH promotes a melanophore maturation program
What the sources say
- Partly supportedcites McMenamin et al., 2014 sourceExperimental — accuracy not yet measured
The indexed passage labeled Abstract reports that melanophores in euthyroid larvae rarely divided, while those in hypothyroid larvae divided frequently. It supports the comparison, but “fail to divide” overstates the finding that division was rare, not absent. (LLM, conf=0.88)
hedgedcorrelational- Asserted: passes — The authors put it forward as true.
- Checkable: passes — It can be checked against evidence.
- Load-bearing: passes — The paper’s conclusions depend on it.
- Based: passes — The paper gives a reason why it holds.
Probably not a substantial claim. It may state two separate claims as one.
- Partly supported
The cited sources support only part of this claim — read each source’s verdict below.
In the paper
“Multipotent progenitors that give rise to adult melanophores, some xanthophores, and iridophores are established in the embryo and reside within peripheral nerves as development progresses (Budi et al., 2011; Budi et al., 2008; Camargo-Sosa et al., 2019; Dooley et al., 2013a; Singh et al., 2016).”
§ Thyroid hormone regulates distinct paths to maturation in pigment cell lineages > Discussion
What the sources say
- Partly supportedcites Budi et al., 2011 sourceExperimental — accuracy not yet measured
The Discussion (page unavailable) describes embryonically established precursors to adult melanophores and iridophores that subsequently associate with peripheral nerves and ganglia. It does not include xanthophores among their descendants; the Figure 12 discussion instead says metamorphic xanthophores presumably arise from a different precursor population. (LLM, conf=0.90)
- Not checked — no full text of the sourcecites Budi et al., 2008 source
- Partly supportedcites Camargo-Sosa et al., 2019 sourceExperimental — accuracy not yet measured
The Introduction says adult pigment stem cells are set aside from neural crest cells during embryogenesis, with at least some occupying a niche within dorsal root ganglia. The Discussion says these cells produce adult melanophores and iridophores, with a small contribution to xanthophores. The claim overstates their location: the paper places at least some in ganglia and links others to the peripheral nervous system, but does not establish that the progenitors generally reside within peripheral nerves. (LLM, conf=0.84)
plaincorrelational- Asserted: passes — The authors put it forward as true.
- Checkable: passes — It can be checked against evidence.
- Load-bearing: fails — The paper’s conclusions may not depend on it.
- Based: passes — The paper gives a reason why it holds.
Probably not a substantial claim. The paper’s conclusions may not depend on it. It may state two separate claims as one.
- Partly supported
Every source the paper cites for this claim was checked and supports it.
In the paper
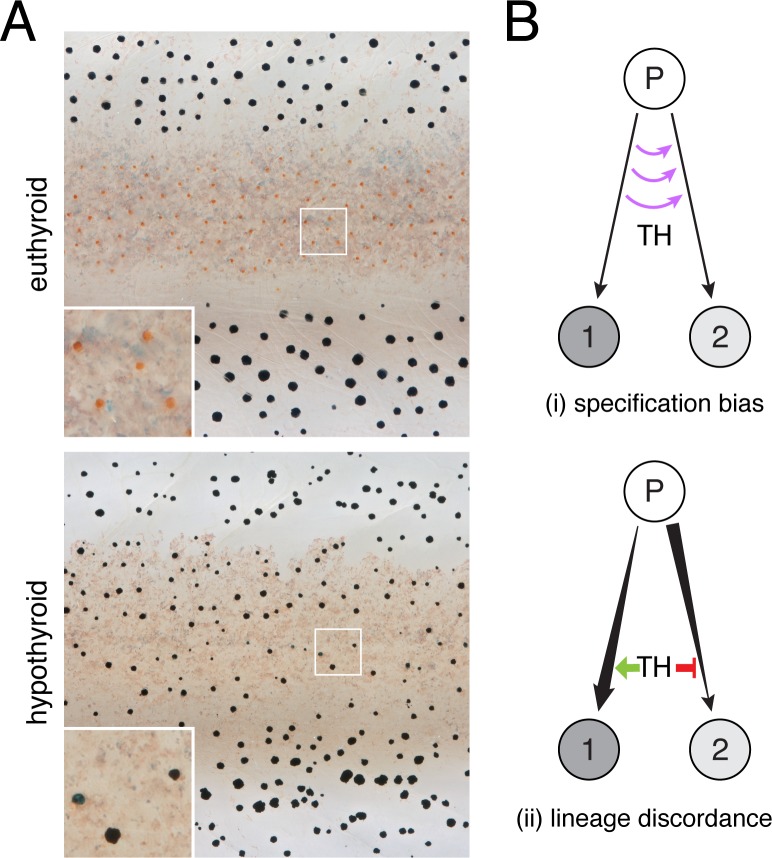
“In zebrafish, TH has opposite effects on neural crest derived pigment cells of the adult stripe pattern, limiting melanophore population expansion, yet increasing yellow/orange xanthophore numbers.”
- Also stated in: § Introduction · hedged
“Remarkably, TH has seemingly opposite effects on two classes of NC-derived pigment cells, curtailing the population of black melanophores yet promoting development of yellow/orange xanthophores; fish lacking TH have about twice the normal number of melanophores and lack visible xanthophores (Figure 1A) (McMenamin et al., 2014).”
§ Thyroid hormone regulates distinct paths to maturation in pigment cell lineages > Abstract
What the sources say
- Supportedcites McMenamin et al., 2014 source
The paper’s Abstract states that thyroid hormone represses melanophore numbers and promotes xanthophore development in the adult pigment pattern. It also reports that thyroid-ablated fish had excess melanophores and lacked adult body xanthophores, supporting the opposite effects described in the claim. (LLM, conf=0.94)
plaindirect- Asserted: passes — The authors put it forward as true.
- Checkable: passes — It can be checked against evidence.
- Load-bearing: passes — The paper’s conclusions depend on it.
- Based: passes — The paper gives a reason why it holds.
It may state two separate claims as one.
- Also stated in: § Introduction · hedged
The cited sources support only part of this claim — read each source’s verdict below.
In the paper
“Melanoblasts derived from peripheral-nerve associated progenitors are proliferative during adult pigment pattern formation yet this activity largely ceases as the cells differentiate (Budi et al., 2011; McMenamin et al., 2014).”
§ Thyroid hormone regulates distinct paths to maturation in pigment cell lineages > Discussion
What the sources say
- Supportedcites Budi et al., 2011 source
The Results section on nerve-associated precursors reports that melanophore precursors proliferate during pigment pattern metamorphosis. The Results section on morphogenesis and differentiation contrasts proliferation of unmelanized cells with rare division of differentiated melanophores in wild-type fish (0.1%). No page number is available in our copy. (LLM, conf=0.94)
- Partly supportedcites McMenamin et al., 2014 sourceExperimental — accuracy not yet measured
The passage labeled Abstract says adult melanophores arise from peripheral nerve-associated precursors. It also reports that melanophores rarely divided in euthyroid larvae, but it does not establish that their precursors proliferate or that proliferation ceases as they differentiate; melanophores divided frequently in hypothyroid larvae. (LLM, conf=0.85)
plaincorrelational- Asserted: passes — The authors put it forward as true.
- Checkable: passes — It can be checked against evidence.
- Load-bearing: passes — The paper’s conclusions depend on it.
- Based: passes — The paper gives a reason why it holds.
It may state two separate claims as one.
- Supported
The cited sources support only part of this claim — read each source’s verdict below.
In the paper
“for example mitfa, encoding a transcription factor required for melanophore fate specification (Lister et al., 1999) was expressed in melanophores and progenitors, but also xanthophores (Figure 3C), consistent with prior reports (Eom et al., 2012; Parichy et al., 2000b).”
§ Thyroid hormone regulates distinct paths to maturation in pigment cell lineages > Results > Pigment cell sub-classes and gene expression dynamics across differentiation
What the sources say
- Partly supportedcites Eom et al., 2012 sourceExperimental — accuracy not yet measured
In the Results section on igsf11 expression (Figure 5C,E), mitfa:GFP marks pigment-cell precursors, and the paper also uses a mitfa-driven transgene in melanophores (Figure 4). It does not establish mitfa expression in xanthophores: Figure 5F measures igsf11, not mitfa, in xanthophore-enriched cells. Page numbers were not provided in our copy. (LLM, conf=0.84)
- Not matchedcites Parichy et al., 2000b
Couldn’t be matched to a paper in Crossref, so it can’t be checked.
plaincorrelational- Asserted: passes — The authors put it forward as true.
- Checkable: passes — It can be checked against evidence.
- Load-bearing: fails — The paper’s conclusions may not depend on it.
- Based: passes — The paper gives a reason why it holds.
Probably not a substantial claim. The paper’s conclusions may not depend on it. It may state two separate claims as one.
- Partly supported
The cited sources support only part of this claim — read each source’s verdict below.
In the paper
“Ablated thyroid glands fail to regenerate (McMenamin et al., 2014) and absence of regeneration in this study was confirmed by continued absence of nVenus expression.”
§ Thyroid hormone regulates distinct paths to maturation in pigment cell lineages > Materials and methods > Nitroreductase-mediated cell ablation
What the sources say
- Partly supportedcites McMenamin et al., 2014 sourceExperimental — accuracy not yet measured
The paper’s section labeled Abstract (page unavailable) reports that fish thyroid-ablated at 4 days post-fertilization still lacked tg mRNA and T4 as juveniles, supporting persistent loss of thyroid function. It does not establish that the glands themselves cannot regenerate. The nVenus observation is described as a finding of the citing study, not attributed to McMenamin et al. (LLM, conf=0.78)
plain- Asserted: passes — The authors put it forward as true.
- Checkable: passes — It can be checked against evidence.
- Load-bearing: passes — The paper’s conclusions depend on it.
- Based: passes — The paper gives a reason why it holds.
It may state two separate claims as one.
- Partly supported
The sources with a verdict support this claim; the rest weren’t checked yet, have no full text we could read, or their verdicts aren’t rated yet.
In the paper
“The yellow-orange color of xanthophores can depend on pteridine pigments, carotenoid pigments, or both”
§ Thyroid hormone regulates distinct paths to maturation in pigment cell lineages > Discussion
What the sources say
- Not checked — no full text of the sourcecites Bagnara and Matsumoto, 2006 source
- Supportedcites Granneman et al., 2017 source
The Results section (‘Plin6 is expressed in xanthophores and traffics with carotenoid droplets’) describes xanthophores as concentrating yellow/orange pigment and says teleost xanthophores contain yellow pteridines and red/orange carotenoids. Figure 6 also describes yellow carotenoid pigmentation, supporting the claim that either pigment type can contribute to yellow-orange color. (LLM, conf=0.90)
- Not checked — no full text of the sourcecites Lister, 2019 source
plainconditional- Asserted: passes — The authors put it forward as true.
- Checkable: passes — It can be checked against evidence.
- Load-bearing: passes — The paper’s conclusions depend on it.
- Based: passes — The paper gives a reason why it holds.
Probably not a substantial claim.
A result the paper reports from its own data — it cites no other source for it, so there is none to check. The quote shows it is in the paper.
In the paper
“Measurements of forward scatter (FSC-A) also suggested that melanophores from juvenile euthyroid fish were larger than melanophores from hypothyroid fish (Figure 5—figure supplement 1D), although FSC-A can be influenced by cell-size-independent factors as well (Tzur et al., 2011).”
§ Thyroid hormone regulates distinct paths to maturation in pigment cell lineages > Results > TH promotes a melanophore maturation program
hedgedcorrelational- Asserted: passes — The authors put it forward as true.
- Checkable: passes — It can be checked against evidence.
- Load-bearing: unclear — It is unclear whether the paper’s conclusions depend on it.
- Based: passes — The paper gives a reason why it holds.
It may state two separate claims as one.
A result the paper reports from its own data — it cites no other source for it, so there is none to check. The quote shows it is in the paper.
In the paper
“In stage-matched comparisons for TH status, ~70% of melanophores from euthyroid fish were binucleated, whereas only ~25% of melanophores from hypothyroid fish were in this state (Figure 5D and E).”
§ Thyroid hormone regulates distinct paths to maturation in pigment cell lineages > Results > TH promotes a melanophore maturation program
plaincorrelational- Asserted: passes — The authors put it forward as true.
- Checkable: passes — It can be checked against evidence.
- Load-bearing: passes — The paper’s conclusions depend on it.
- Based: passes — The paper gives a reason why it holds.
It may state two separate claims as one.
A result the paper reports from its own data — it cites no other source for it, so there is none to check. The quote shows it is in the paper.
In the paper
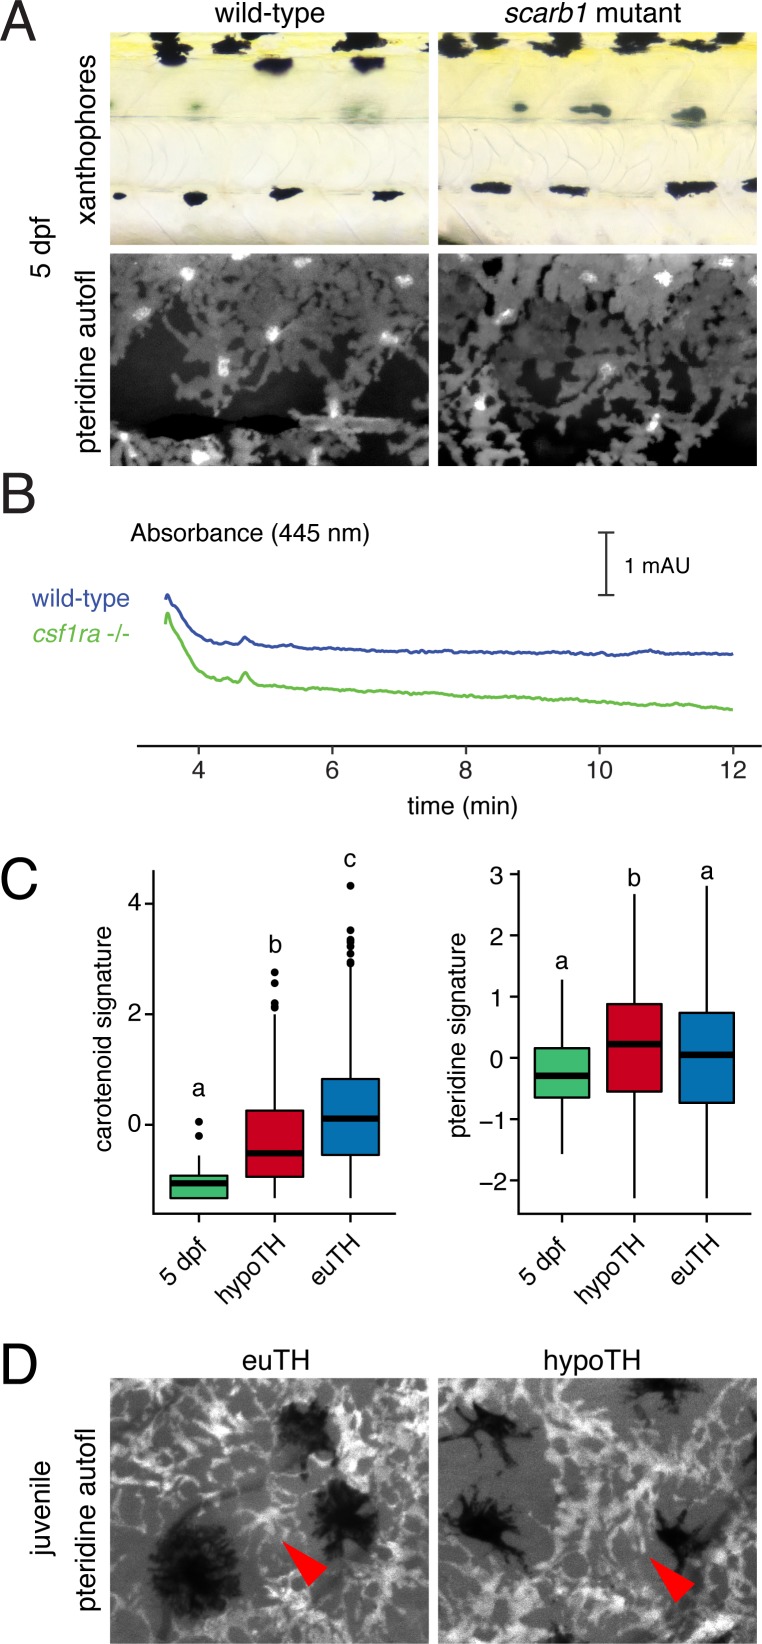
“By contrast, pteridine pathway genes tended to be expressed similarly across stages regardless of TH status and were even moderately upregulated in hypothyroid xanthophores (Figure 6C, Figure 6—figure supplement 4C).”
§ Thyroid hormone regulates distinct paths to maturation in pigment cell lineages > Results > TH promotes carotenoid-dependent xanthophore re-pigmentation during adult development
plain- Asserted: passes — The authors put it forward as true.
- Checkable: passes — It can be checked against evidence.
- Load-bearing: passes — The paper’s conclusions depend on it.
- Based: passes — The paper gives a reason why it holds.
It may state two separate claims as one.
A result the paper reports from its own data — it cites no other source for it, so there is none to check. The quote shows it is in the paper.
In the paper
“For example, cells of subcluster melanophore 2 exhibited low levels of transcriptional activity and expressed fewer genes, suggesting a more advanced state of differentiation, as compared to cells of melanophore 1 (Figure 3—figure supplement 1).”
§ Thyroid hormone regulates distinct paths to maturation in pigment cell lineages > Results > Pigment cell sub-classes and gene expression dynamics across differentiation
hedgedcorrelational- Asserted: passes — The authors put it forward as true.
- Checkable: passes — It can be checked against evidence.
- Load-bearing: unclear — It is unclear whether the paper’s conclusions depend on it.
- Based: passes — The paper gives a reason why it holds.
It may state two separate claims as one.
A result the paper reports from its own data — it cites no other source for it, so there is none to check. The quote shows it is in the paper.
In the paper
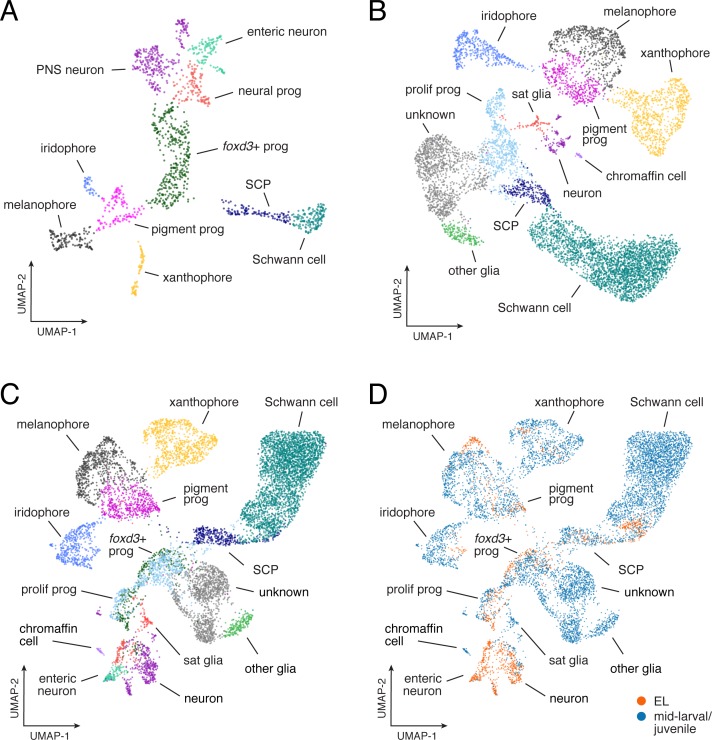
“These data do not indicate markedly different transcriptomic programs of NC-derived cell types across life stages, despite the existence of some stage-specific requirements for particular genes and pathways.”
- Also stated in: § Post-embryonic NC-derived subpopulations revealed by single-cell RNA sequencing · plain
“Combining profiles for cells at different stages failed to reveal non-contiguous, life-stage-specific clusters, although some EL cells occupied subsets of transcriptomic space relative to their broader cell type (e.g. melanophores) (Figure 2—figure supplement 5B–D).”
§ Thyroid hormone regulates distinct paths to maturation in pigment cell lineages > Results > Post-embryonic NC-derived subpopulations revealed by single-cell RNA sequencing
plain- Asserted: passes — The authors put it forward as true.
- Checkable: passes — It can be checked against evidence.
- Load-bearing: passes — The paper’s conclusions depend on it.
- Based: passes — The paper gives a reason why it holds.
It may state two separate claims as one.
- Also stated in: § Post-embryonic NC-derived subpopulations revealed by single-cell RNA sequencing · plain
A result the paper reports from its own data — it cites no other source for it, so there is none to check. The quote shows it is in the paper.
In the paper
“When plated ex vivo, some stripe melanophores exhibited senescence-associated β-galactosidase (SA-β-gal) activity (Figure 5—figure supplement 1A), although we were unable to score such staining reliably, precluding comparisons across TH conditions.”
§ Thyroid hormone regulates distinct paths to maturation in pigment cell lineages > Results > TH promotes a melanophore maturation program
plain- Asserted: passes — The authors put it forward as true.
- Checkable: passes — It can be checked against evidence.
- Load-bearing: fails — The paper’s conclusions may not depend on it.
- Based: passes — The paper gives a reason why it holds.
Probably not a substantial claim. The paper’s conclusions may not depend on it. It may state two separate claims as one.
A result the paper reports from its own data — it cites no other source for it, so there is none to check. The quote shows it is in the paper.
In the paper
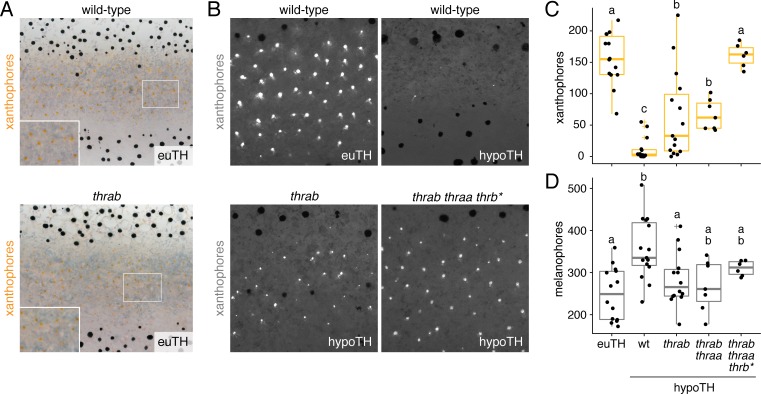
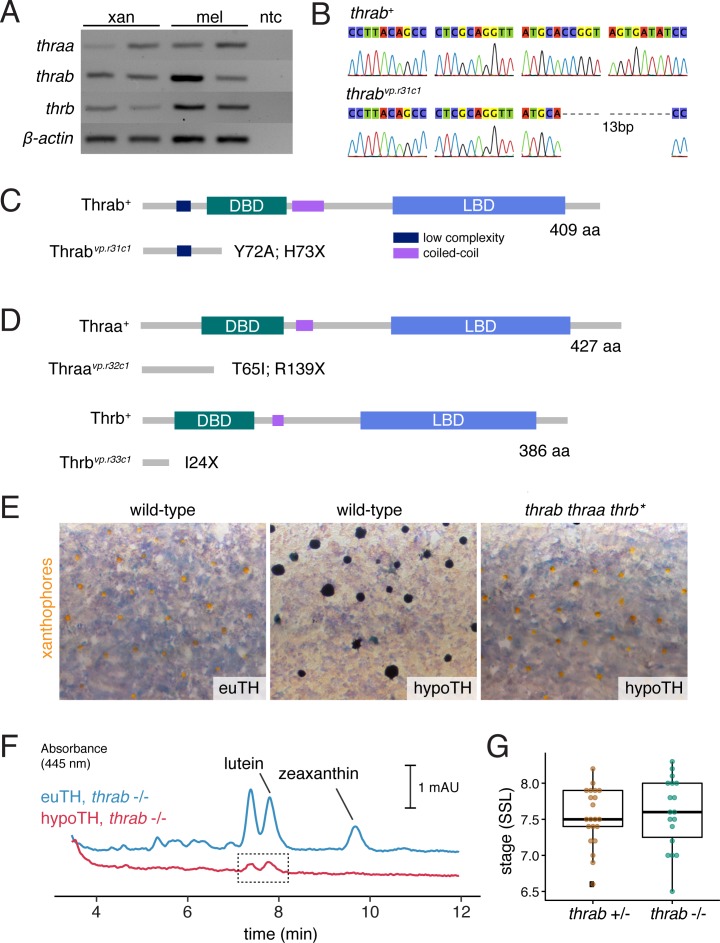
“Loss of thrab, on its own or in conjunction with loss of thraa, partially restored the deposition of carotenoids in interstripe xanthophoes; mutation of all three receptors fully rescued the number of carotenoid-containing xanthophores (Figure 7B and C; Figure 7—figure supplement 1E and F).”
§ Thyroid hormone regulates distinct paths to maturation in pigment cell lineages > Results > Adult pigment cell maturation programs are gated by TH receptors
plaindirect- Asserted: passes — The authors put it forward as true.
- Checkable: passes — It can be checked against evidence.
- Load-bearing: passes — The paper’s conclusions depend on it.
- Based: passes — The paper gives a reason why it holds.
It may state two separate claims as one.
A result the paper reports from its own data — it cites no other source for it, so there is none to check. The quote shows it is in the paper.
In the paper
“In euthyroid fish, ~20% of melanophores were binucleate near the onset of adult melanophore differentiation but >50% were binucleate by juvenile stages, confirming an overall increase in binucleation with somatic stage and melanophore age (Figure 5—figure supplement 1E).”
§ Thyroid hormone regulates distinct paths to maturation in pigment cell lineages > Results > TH promotes a melanophore maturation program
plaincorrelational- Asserted: passes — The authors put it forward as true.
- Checkable: passes — It can be checked against evidence.
- Load-bearing: passes — The paper’s conclusions depend on it.
- Based: passes — The paper gives a reason why it holds.
It may state two separate claims as one.
A result the paper reports from its own data — it cites no other source for it, so there is none to check. The quote shows it is in the paper.
In the paper
“Carotenoids were undetectable in euthyroid 5 dpf larvae, and carotenoid-related genes were expressed at lower levels in EL xanthophores than adult xanthophores (Figure 6—figure supplement 4B and C).”
§ Thyroid hormone regulates distinct paths to maturation in pigment cell lineages > Results > TH promotes carotenoid-dependent xanthophore re-pigmentation during adult development
plain- Asserted: passes — The authors put it forward as true.
- Checkable: passes — It can be checked against evidence.
- Load-bearing: passes — The paper’s conclusions depend on it.
- Based: passes — The paper gives a reason why it holds.
It may state two separate claims as one.
A result the paper reports from its own data — it cites no other source for it, so there is none to check. The quote shows it is in the paper.
In the paper
“For example, transcripts per cell declined in melanophores but not iridophores, consistent with an expectation of reduced RNA abundance as melanophores—but not iridophores—exit the cell cycle with maturation (Figure 3—figure supplement 5B) (Budi et al., 2011; Darzynkiewicz et al., 1980; McMenamin et al., 2014; Spiewak et al., 2018).”
§ Thyroid hormone regulates distinct paths to maturation in pigment cell lineages > Results > Pigment cell sub-classes and gene expression dynamics across differentiation
plaincorrelational- Asserted: passes — The authors put it forward as true.
- Checkable: passes — It can be checked against evidence.
- Load-bearing: unclear — It is unclear whether the paper’s conclusions depend on it.
- Based: passes — The paper gives a reason why it holds.
It may state two separate claims as one.
A result the paper reports from its own data — it cites no other source for it, so there is none to check. The quote shows it is in the paper.
In the paper
“Our collected cell-types, which include immature and mature glia, differentiating pigment cells, and presumptive progenitors of different types identify new candidate genes for promoting—and recognizing—distinct states of differentiation and morphogenetic activities”
§ Thyroid hormone regulates distinct paths to maturation in pigment cell lineages > Discussion
plain- Asserted: passes — The authors put it forward as true.
- Checkable: passes — It can be checked against evidence.
- Load-bearing: passes — The paper’s conclusions depend on it.
- Based: passes — The paper gives a reason why it holds.
It may state two separate claims as one.
None of the sources cited for this claim have been checked yet.
In the paper
“Likewise cells of xanthophore 1 had fewer transcripts and expressed fewer genes than cells of xanthophore 2, suggesting they may represent undifferentiated, cryptic xanthophores and actively differentiating populations, respectively (McMenamin et al., 2014).”
§ Thyroid hormone regulates distinct paths to maturation in pigment cell lineages > Results > Pigment cell sub-classes and gene expression dynamics across differentiation
hedgedcorrelational- Asserted: passes — The authors put it forward as true.
- Checkable: passes — It can be checked against evidence.
- Load-bearing: unclear — It is unclear whether the paper’s conclusions depend on it.
- Based: passes — The paper gives a reason why it holds.
It may state two separate claims as one.
A result the paper reports from its own data — it cites no other source for it, so there is none to check. The quote shows it is in the paper.
In the paper
“An additional cluster expressed markers suggestive of proliferative, non-pigmentary progenitors, and one large cluster (‘unknown’) was not readily assignable to NC-derived populations described previously.”
§ Thyroid hormone regulates distinct paths to maturation in pigment cell lineages > Results > Post-embryonic NC-derived subpopulations revealed by single-cell RNA sequencing
hedgedn = 16,150- Asserted: passes — The authors put it forward as true.
- Checkable: passes — It can be checked against evidence.
- Load-bearing: unclear — It is unclear whether the paper’s conclusions depend on it.
- Based: passes — The paper gives a reason why it holds.
It may state two separate claims as one.
A result the paper reports from its own data — it cites no other source for it, so there is none to check. The quote shows it is in the paper.
In the paper
“Overall, our survey captured numerous NC-derived cell types, including abundant pigment cells and progenitors, and revealed substantial variation in gene expression programs among them.”
§ Thyroid hormone regulates distinct paths to maturation in pigment cell lineages > Results > Post-embryonic NC-derived subpopulations revealed by single-cell RNA sequencing
plaincorrelational- Asserted: passes — The authors put it forward as true.
- Checkable: passes — It can be checked against evidence.
- Load-bearing: passes — The paper’s conclusions depend on it.
- Based: passes — The paper gives a reason why it holds.
It may state two separate claims as one.
A result the paper reports from its own data — it cites no other source for it, so there is none to check. The quote shows it is in the paper.
In the paper
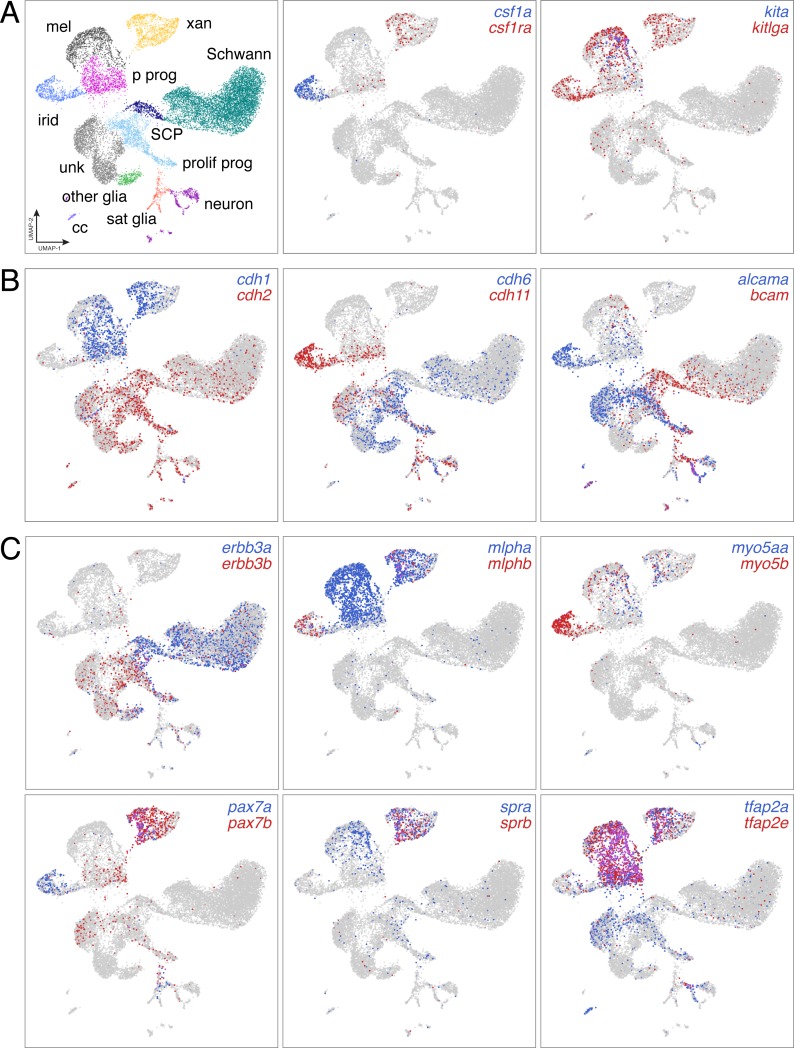
“Genes encoding each of the three zebrafish TRs (thraa, thrab, thrb) were expressed by melanophores and xanthophores, yet presumptive null alleles for each unexpectedly had pigment cell complements and patterns that resembled the wild type (Figure 7A; Figure 7—figure supplement 1A–D).”
§ Thyroid hormone regulates distinct paths to maturation in pigment cell lineages > Results > Adult pigment cell maturation programs are gated by TH receptors
plain- Asserted: passes — The authors put it forward as true.
- Checkable: passes — It can be checked against evidence.
- Load-bearing: passes — The paper’s conclusions depend on it.
- Based: passes — The paper gives a reason why it holds.
It may state two separate claims as one.
A result the paper reports from its own data — it cites no other source for it, so there is none to check. The quote shows it is in the paper.
In the paper
“Euthyroid melanophores tended to be highly melanized and stellate, whereas hypothyroid melanophores were variably melanized and often dendritic.”
- Also stated in: § TH promotes a melanophore maturation program · hedged
“Melanophores of juvenile euthyroid fish tended to be uniformly well-melanized and stellate, whereas melanophores of juvenile hypothyroid fish were variably melanized and dendritic (Figure 5B), reminiscent of earlier stages of melanophore development in wild-type (Eom et al., 2012; Parichy and Turner, 2003).”
§ Thyroid hormone regulates distinct paths to maturation in pigment cell lineages > Results > TH promotes a melanophore maturation program
hedgedcorrelational- Asserted: passes — The authors put it forward as true.
- Checkable: passes — It can be checked against evidence.
- Load-bearing: passes — The paper’s conclusions depend on it.
- Based: passes — The paper gives a reason why it holds.
It may state two separate claims as one.
- Also stated in: § TH promotes a melanophore maturation program · hedged
A result the paper reports from its own data — it cites no other source for it, so there is none to check. The quote shows it is in the paper.
In the paper
“This topology differed from known lineage relationships (Figure 3A) but was consistent with similarity of EL and mid-larval/juvenile gene expression programs (Figure 2—figure supplement 5D).”
§ Thyroid hormone regulates distinct paths to maturation in pigment cell lineages > Results > Pigment cell sub-classes and gene expression dynamics across differentiation
plaincorrelational- Asserted: passes — The authors put it forward as true.
- Checkable: passes — It can be checked against evidence.
- Load-bearing: passes — The paper’s conclusions depend on it.
- Based: passes — The paper gives a reason why it holds.
It may state two separate claims as one.
A result the paper reports from its own data — it cites no other source for it, so there is none to check. The quote shows it is in the paper.
In the paper
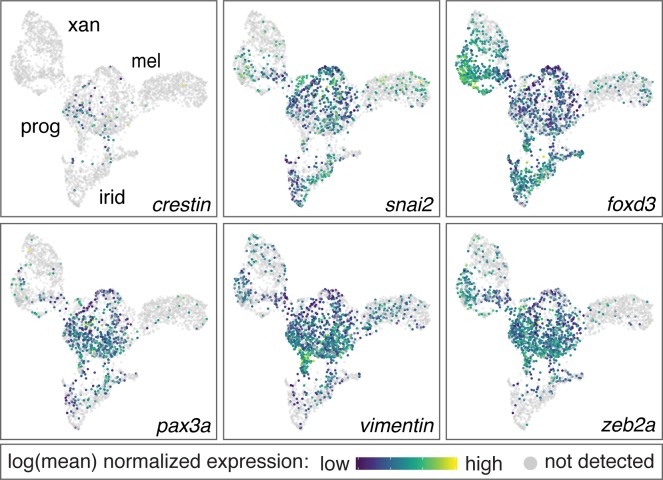
“Additional surveys of these data revealed new markers of xanthophore and iridophore lineages (Figure 3—figure supplements 2 and 3), and cell-type-specific expression of some previously identified markers [e.g. tyrp1b, aox5, tfec (Lister et al., 2011; McMenamin et al., 2014) (Figure 3C).”
§ Thyroid hormone regulates distinct paths to maturation in pigment cell lineages > Results > Pigment cell sub-classes and gene expression dynamics across differentiation
plain- Asserted: passes — The authors put it forward as true.
- Checkable: passes — It can be checked against evidence.
- Load-bearing: unclear — It is unclear whether the paper’s conclusions depend on it.
- Based: passes — The paper gives a reason why it holds.
It may state two separate claims as one.
A result the paper reports from its own data — it cites no other source for it, so there is none to check. The quote shows it is in the paper.
In the paper
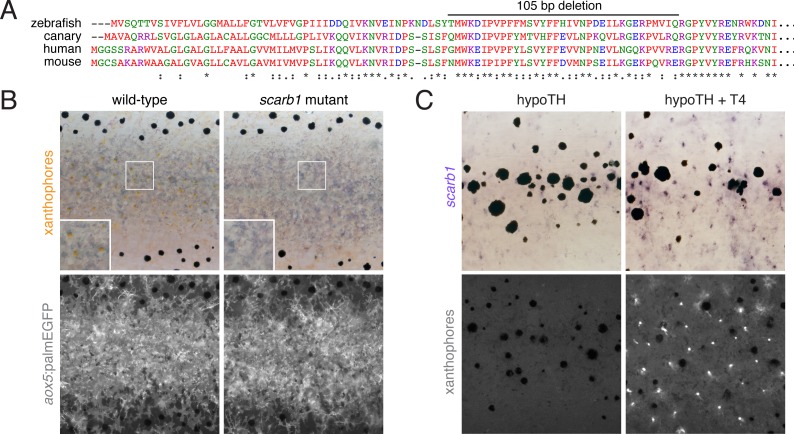
“Among carotenoid genes, scavenger receptor B1 (scarb1) encodes a high-density lipoprotein receptor essential for carotenoid accumulation in birds and invertebrates (Kiefer et al., 2002; Toomey et al., 2017) and we found it to be required in zebrafish for carotenoid deposition, although not cell persistence (Figure 6—figure supplement 3A and B).”
§ Thyroid hormone regulates distinct paths to maturation in pigment cell lineages > Results > TH promotes carotenoid-dependent xanthophore re-pigmentation during adult development
plaindirect- Asserted: passes — The authors put it forward as true.
- Checkable: passes — It can be checked against evidence.
- Load-bearing: passes — The paper’s conclusions depend on it.
- Based: passes — The paper gives a reason why it holds.
It may state two separate claims as one.
A result the paper reports from its own data — it cites no other source for it, so there is none to check. The quote shows it is in the paper.
In the paper
“exogenous TH was sufficient to rescue both expression and carotenoid deposition (Figure 6F; Figure 6—figure supplement 3C).”
§ Thyroid hormone regulates distinct paths to maturation in pigment cell lineages > Results > TH promotes carotenoid-dependent xanthophore re-pigmentation during adult development
plaindirect- Asserted: passes — The authors put it forward as true.
- Checkable: passes — It can be checked against evidence.
- Load-bearing: passes — The paper’s conclusions depend on it.
- Based: passes — The paper gives a reason why it holds.
It may state two separate claims as one.
A result the paper reports from its own data — it cites no other source for it, so there is none to check. The quote shows it is in the paper.
In the paper
“q < 6.0E-11 for all genes, except for pax3a”
§ Thyroid hormone regulates distinct paths to maturation in pigment cell lineages > Materials and methods > Branched Expression Analysis Modeling (BEAM)
plain- Asserted: passes — The authors put it forward as true.
- Checkable: passes — It can be checked against evidence.
- Load-bearing: fails — The paper’s conclusions may not depend on it.
- Based: passes — The paper gives a reason why it holds.
Probably not a substantial claim. The paper’s conclusions may not depend on it.
A result the paper reports from its own data — it cites no other source for it, so there is none to check. The quote shows it is in the paper.
In the paper
“We showed that TH directly or indirectly regulates carotenoid-associated genes and carotenoid deposition, allowing cryptic xanthophores to reacquire visible pigmentation.”
§ Thyroid hormone regulates distinct paths to maturation in pigment cell lineages > Discussion
plaindirect- Asserted: passes — The authors put it forward as true.
- Checkable: passes — It can be checked against evidence.
- Load-bearing: passes — The paper’s conclusions depend on it.
- Based: passes — The paper gives a reason why it holds.
It may state two separate claims as one.
A result the paper reports from its own data — it cites no other source for it, so there is none to check. The quote shows it is in the paper.
In the paper
“except for pax3a (starred, q = 0.03)”
§ Thyroid hormone regulates distinct paths to maturation in pigment cell lineages > Materials and methods > Branched Expression Analysis Modeling (BEAM)
plain- Asserted: passes — The authors put it forward as true.
- Checkable: passes — It can be checked against evidence.
- Load-bearing: fails — The paper’s conclusions may not depend on it.
- Based: passes — The paper gives a reason why it holds.
Probably not a substantial claim. The paper’s conclusions may not depend on it.
A conclusion the paper draws from its own results — it cites no other source for it, so there is none to check. The quote shows it is in the paper.
In the paper
“In melanophores, TH drives terminal differentiation, limiting final cell numbers.”
§ Thyroid hormone regulates distinct paths to maturation in pigment cell lineages > Abstract
plaindirect- Asserted: passes — The authors put it forward as true.
- Checkable: passes — It can be checked against evidence.
- Load-bearing: passes — The paper’s conclusions depend on it.
- Based: passes — The paper gives a reason why it holds.
It may state two separate claims as one.
A conclusion the paper draws from its own results — it cites no other source for it, so there is none to check. The quote shows it is in the paper.
In the paper
“We show that TH promotes maturation of both cell types but in distinct ways.”
- Also stated in: § Introduction · plain
“Our analyses showed that TH drives maturation of cells committed to melanophore and xanthophore fates through different mechanisms, promoting terminal differentiation and proliferative arrest in melanophores, and carotenoid-dependent repigmentation in xanthophores.”
§ Thyroid hormone regulates distinct paths to maturation in pigment cell lineages > Abstract
plaindirect- Asserted: passes — The authors put it forward as true.
- Checkable: passes — It can be checked against evidence.
- Load-bearing: passes — The paper’s conclusions depend on it.
- Based: passes — The paper gives a reason why it holds.
It may state two separate claims as one.
- Also stated in: § Introduction · plain
A conclusion the paper draws from its own results — it cites no other source for it, so there is none to check. The quote shows it is in the paper.
In the paper
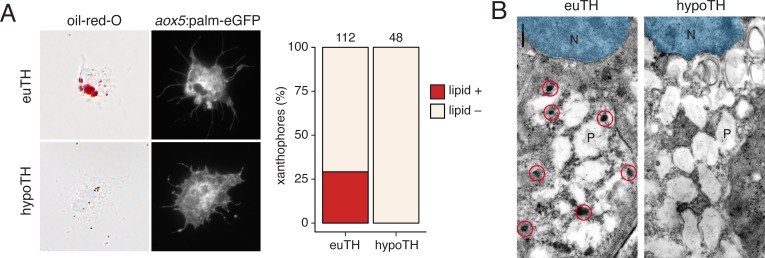
“Together these findings demonstrate an essential role for TH in carotenoid pigmentation and suggest that TH modulation of a suite of carotenoid pathway genes is required for cryptic xanthophores to re-pigment during adult pattern formation.”
§ Thyroid hormone regulates distinct paths to maturation in pigment cell lineages > Results > TH promotes carotenoid-dependent xanthophore re-pigmentation during adult development
hedgeddirect- Asserted: passes — The authors put it forward as true.
- Checkable: passes — It can be checked against evidence.
- Load-bearing: passes — The paper’s conclusions depend on it.
- Based: passes — The paper gives a reason why it holds.
It may state two separate claims as one.
A conclusion the paper draws from its own results — it cites no other source for it, so there is none to check. The quote shows it is in the paper.
In the paper
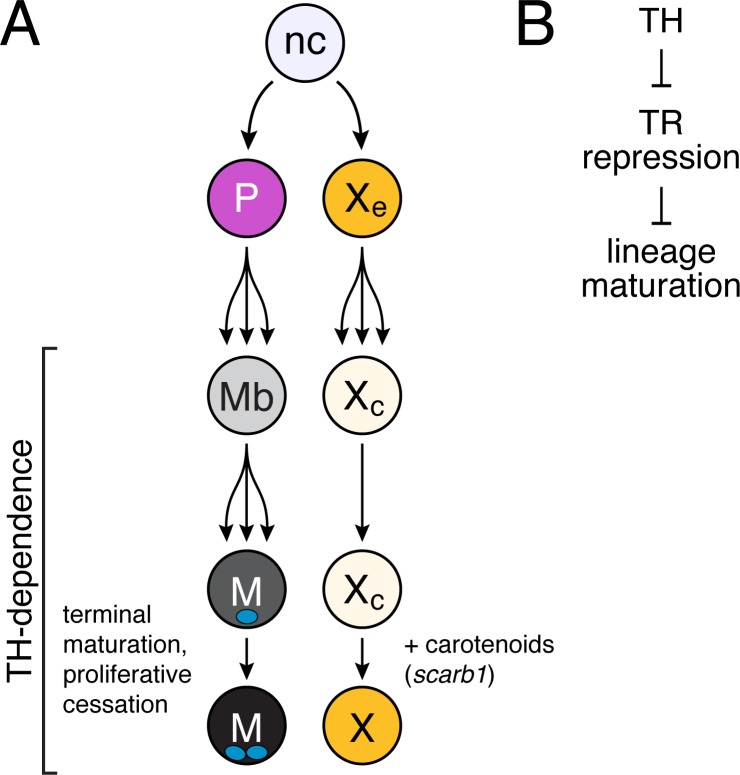
“These findings suggest that repression by unliganded TRs contributes to pigment-associated phenotypes in hypothyroid fish, implying a function for TRs in repressing the repigmentation of xanthophores and terminal differentiation of melanophores until late stages in adult pigment pattern development.”
§ Thyroid hormone regulates distinct paths to maturation in pigment cell lineages > Results > Adult pigment cell maturation programs are gated by TH receptors
hedgedconditional- Asserted: passes — The authors put it forward as true.
- Checkable: passes — It can be checked against evidence.
- Load-bearing: passes — The paper’s conclusions depend on it.
- Based: passes — The paper gives a reason why it holds.
It may state two separate claims as one.
A conclusion the paper draws from its own results — it cites no other source for it, so there is none to check. The quote shows it is in the paper.
In the paper
“Collectively, our observations and those of McMenamin et al. (2014) suggest a model in which TH drives melanophores into a terminally differentiated state of increased melanization, larger size and lysosomal content, binucleation, and proliferative cessation.”
§ Thyroid hormone regulates distinct paths to maturation in pigment cell lineages > Results > TH promotes a melanophore maturation program
hedgeddirect- Asserted: passes — The authors put it forward as true.
- Checkable: passes — It can be checked against evidence.
- Load-bearing: passes — The paper’s conclusions depend on it.
- Based: passes — The paper gives a reason why it holds.
It may state two separate claims as one.
A conclusion the paper draws from its own results — it cites no other source for it, so there is none to check. The quote shows it is in the paper.
In the paper
“TH therefore drives maturation of both xanthophores and melanophores yet has markedly different roles in each lineage.”
§ Thyroid hormone regulates distinct paths to maturation in pigment cell lineages > Results > TH promotes carotenoid-dependent xanthophore re-pigmentation during adult development
plaindirect- Asserted: passes — The authors put it forward as true.
- Checkable: passes — It can be checked against evidence.
- Load-bearing: passes — The paper’s conclusions depend on it.
- Based: passes — The paper gives a reason why it holds.
It may state two separate claims as one.
A claim is checked only against the cited paper’s full text, never its abstract, and none is available for its sources.
In the paper
“human melanoma is associated with hypothyroidism and recurrent TH pathway mutations (Ellerhorst et al., 2003; Shah et al., 2006; Sisley et al., 1993)”
§ Thyroid hormone regulates distinct paths to maturation in pigment cell lineages > Discussion
What the sources say
plaincorrelational- Asserted: passes — The authors put it forward as true.
- Checkable: passes — It can be checked against evidence.
- Load-bearing: unclear — It is unclear whether the paper’s conclusions depend on it.
- Based: passes — The paper gives a reason why it holds.
It may state two separate claims as one.
A conclusion the paper draws from its own results — it cites no other source for it, so there is none to check. The quote shows it is in the paper.
In the paper
“Together, these observations imply that TH induces new, carotenoid-based pigmentation, allowing transiently cryptic xanthophores to reacquire coloration during adult pattern development.”
§ Thyroid hormone regulates distinct paths to maturation in pigment cell lineages > Results > TH promotes carotenoid-dependent xanthophore re-pigmentation during adult development
hedgeddirect- Asserted: passes — The authors put it forward as true.
- Checkable: passes — It can be checked against evidence.
- Load-bearing: passes — The paper’s conclusions depend on it.
- Based: passes — The paper gives a reason why it holds.
It may state two separate claims as one.
A conclusion the paper draws from its own results — it cites no other source for it, so there is none to check. The quote shows it is in the paper.
In the paper
“Yet, we found no evidence for early pigmentation of xanthophores in euthyroid fish homozygous for thrab mutation (Figure 7—figure supplement 1G), suggesting essential roles for other factors present only at later stages (Patterson and Parichy, 2013).”
§ Thyroid hormone regulates distinct paths to maturation in pigment cell lineages > Results > Adult pigment cell maturation programs are gated by TH receptors
hedged- Asserted: passes — The authors put it forward as true.
- Checkable: passes — It can be checked against evidence.
- Load-bearing: passes — The paper’s conclusions depend on it.
- Based: passes — The paper gives a reason why it holds.
It may state two separate claims as one.
What the paper did — it cites no source for this, so there is none to check. The quote shows it is in the paper.
In the paper
“although we were unable to score such staining reliably, precluding comparisons across TH conditions.”
§ Thyroid hormone regulates distinct paths to maturation in pigment cell lineages > Results > TH promotes a melanophore maturation program
plain- Asserted: passes — The authors put it forward as true.
- Checkable: passes — It can be checked against evidence.
- Load-bearing: fails — The paper’s conclusions may not depend on it.
- Based: passes — The paper gives a reason why it holds.
Probably not a substantial claim. The paper’s conclusions may not depend on it. It may state two separate claims as one.
What the paper did — it cites no source for this, so there is none to check. The quote shows it is in the paper.
In the paper
“Single transgene controls and wild-type cells were used to adjust voltage and gating.”
§ Thyroid hormone regulates distinct paths to maturation in pigment cell lineages > Materials and methods > Melanophore maturation assays
plain- Asserted: passes — The authors put it forward as true.
- Checkable: passes — It can be checked against evidence.
- Load-bearing: fails — The paper’s conclusions may not depend on it.
- Based: passes — The paper gives a reason why it holds.
Probably not a substantial claim. The paper’s conclusions may not depend on it. It may state two separate claims as one.
What the paper did — it cites no source for this, so there is none to check. The quote shows it is in the paper.
In the paper
“Guides were tested for mutagenicity by Sanger sequencing”
§ Thyroid hormone regulates distinct paths to maturation in pigment cell lineages > Materials and methods > Mutant and transgenic line production
plain- Asserted: passes — The authors put it forward as true.
- Checkable: passes — It can be checked against evidence.
- Load-bearing: fails — The paper’s conclusions may not depend on it.
- Based: passes — The paper gives a reason why it holds.
Probably not a substantial claim. The paper’s conclusions may not depend on it.
A conclusion the paper draws from its own results — it cites no other source for it, so there is none to check. The quote shows it is in the paper.
In the paper
“That cryptic xanthophores appear poised to re-differentiate likely explains the smaller proportion of genes that were TH-dependent in these cells as compared to melanophores.”
§ Thyroid hormone regulates distinct paths to maturation in pigment cell lineages > Discussion
hedgedconditional- Asserted: passes — The authors put it forward as true.
- Checkable: passes — It can be checked against evidence.
- Load-bearing: passes — The paper’s conclusions depend on it.
- Based: passes — The paper gives a reason why it holds.
It may state two separate claims as one.
What the paper did — it cites no source for this, so there is none to check. The quote shows it is in the paper.
In the paper
“Images were corrected for color balance and adjusted for display levels as necessary with conditions within analyses treated identically.”
§ Thyroid hormone regulates distinct paths to maturation in pigment cell lineages > Materials and methods > Imaging
plain- Asserted: passes — The authors put it forward as true.
- Checkable: passes — It can be checked against evidence.
- Load-bearing: fails — The paper’s conclusions may not depend on it.
- Based: passes — The paper gives a reason why it holds.
Probably not a substantial claim. The paper’s conclusions may not depend on it. It may state two separate claims as one.
What the paper did — it cites no source for this, so there is none to check. The quote shows it is in the paper.
In the paper
“For all thyroid ablations, treated individuals were assessed for loss of nuclear-localizing Venus (nVenus) the following day.”
§ Thyroid hormone regulates distinct paths to maturation in pigment cell lineages > Materials and methods > Nitroreductase-mediated cell ablation
plain- Asserted: passes — The authors put it forward as true.
- Checkable: passes — It can be checked against evidence.
- Load-bearing: passes — The paper’s conclusions depend on it.
- Based: passes — The paper gives a reason why it holds.
Probably not a substantial claim.
What the paper did — it cites no source for this, so there is none to check. The quote shows it is in the paper.
In the paper
“Final cellular barcodes and UMIs were determined using Cell Ranger 2.0.2 (10X Genomics) and cells were filtered to include only high-quality cells.”
§ Thyroid hormone regulates distinct paths to maturation in pigment cell lineages > Materials and methods > scRNA-Seq data processing
plain- Asserted: passes — The authors put it forward as true.
- Checkable: passes — It can be checked against evidence.
- Load-bearing: fails — The paper’s conclusions may not depend on it.
- Based: passes — The paper gives a reason why it holds.
Probably not a substantial claim. The paper’s conclusions may not depend on it. It may state two separate claims as one.
What the paper did — it cites no source for this, so there is none to check. The quote shows it is in the paper.
In the paper
“We replicated the experiment three times.”
§ Thyroid hormone regulates distinct paths to maturation in pigment cell lineages > Materials and methods > Single-cell collection, library construction and sequencing
plain- Asserted: passes — The authors put it forward as true.
- Checkable: passes — It can be checked against evidence.
- Load-bearing: fails — The paper’s conclusions may not depend on it.
- Based: passes — The paper gives a reason why it holds.
Probably not a substantial claim. The paper’s conclusions may not depend on it.
What the paper did — it cites no source for this, so there is none to check. The quote shows it is in the paper.
In the paper
“To correct for this bias in aligning reads to the transcriptome, we extended all 3' UTR annotations by 500 bp.”
§ Thyroid hormone regulates distinct paths to maturation in pigment cell lineages > Materials and methods > scRNA-Seq data processing
plaindirect- Asserted: passes — The authors put it forward as true.
- Checkable: passes — It can be checked against evidence.
- Load-bearing: passes — The paper’s conclusions depend on it.
- Based: passes — The paper gives a reason why it holds.
Probably not a substantial claim.
What the paper did — it cites no source for this, so there is none to check. The quote shows it is in the paper.
In the paper
“All procedures involving live animals followed federal, state and local guidelines for humane treatment and protocols approved by Institutional Animal Care and Use Committees of University of Virginia and University of Washington.”
§ Thyroid hormone regulates distinct paths to maturation in pigment cell lineages > Materials and methods > Staging, rearing and stocks
plain- Asserted: passes — The authors put it forward as true.
- Checkable: passes — It can be checked against evidence.
- Load-bearing: fails — The paper’s conclusions may not depend on it.
- Based: passes — The paper gives a reason why it holds.
Probably not a substantial claim. The paper’s conclusions may not depend on it. It may state two separate claims as one.
What the paper did — it cites no source for this, so there is none to check. The quote shows it is in the paper.
In the paper
“Individual genotypes of fish assessed were confirmed using PCR or Sanger sequencing.”
§ Thyroid hormone regulates distinct paths to maturation in pigment cell lineages > Materials and methods > Cell counts
plain- Asserted: passes — The authors put it forward as true.
- Checkable: passes — It can be checked against evidence.
- Load-bearing: fails — The paper’s conclusions may not depend on it.
- Based: passes — The paper gives a reason why it holds.
Probably not a substantial claim. The paper’s conclusions may not depend on it.
What the paper did — it cites no source for this, so there is none to check. The quote shows it is in the paper.
In the paper
“For parametric analyses, residuals were assessed for normality and homoscedasticity to meet model assumptions and no transformations were found to be warranted.”
§ Thyroid hormone regulates distinct paths to maturation in pigment cell lineages > Materials and methods > Statistics
plain- Asserted: passes — The authors put it forward as true.
- Checkable: passes — It can be checked against evidence.
- Load-bearing: fails — The paper’s conclusions may not depend on it.
- Based: passes — The paper gives a reason why it holds.
Probably not a substantial claim. The paper’s conclusions may not depend on it. It may state two separate claims as one.
What the paper did — it cites no source for this, so there is none to check. The quote shows it is in the paper.
In the paper
“We assigned clusters to cell types based on the detection of published marker genes.”
§ Thyroid hormone regulates distinct paths to maturation in pigment cell lineages > Materials and methods > UMAP visualization and clustering
plain- Asserted: passes — The authors put it forward as true.
- Checkable: passes — It can be checked against evidence.
- Load-bearing: passes — The paper’s conclusions depend on it.
- Based: passes — The paper gives a reason why it holds.
Probably not a substantial claim.
What the paper did — it cites no source for this, so there is none to check. The quote shows it is in the paper.
In the paper
“Cells with more than 15,000 UMIs were discarded as possible doublets.”
§ Thyroid hormone regulates distinct paths to maturation in pigment cell lineages > Materials and methods > UMAP visualization and clustering
plain- Asserted: passes — The authors put it forward as true.
- Checkable: passes — It can be checked against evidence.
- Load-bearing: fails — The paper’s conclusions may not depend on it.
- Based: passes — The paper gives a reason why it holds.
Probably not a substantial claim. The paper’s conclusions may not depend on it.
What the paper did — it cites no source for this, so there is none to check. The quote shows it is in the paper.
In the paper
“Batch correction methods were not used between the two groups or across samples because we did not observe sample-specific separation or clustering in UMAP space.”
§ Thyroid hormone regulates distinct paths to maturation in pigment cell lineages > Materials and methods > UMAP visualization and clustering
plain- Asserted: passes — The authors put it forward as true.
- Checkable: passes — It can be checked against evidence.
- Load-bearing: passes — The paper’s conclusions depend on it.
- Based: passes — The paper gives a reason why it holds.
Probably not a substantial claim.
Claims other papers make about this one
Each is checked against this paper’s own text: does it say what the citing paper says it does?
The source backs part of the claim, not all of it — or backs it for a different population, condition or comparison.
In the citing paper
“The first aim of the present study was to determine whether iridophores are indeed the only embryonic differentiated pigment cell expressing tfec; to this end, we conducted analyses showing that tfec expression is maintained at detectable levels only in mature iridophores, but neither in melanocytes nor in xanthophores, in agreement with recently published single cell transcriptomics analyses [45]”
From The MITF paralog tfec is required in neural crest development for fate specification of the iridophore lineage from a multipotent pigment cell progenitor (2021) · cites this paper as [45]
Experimental — accuracy not yet measuredThe source backs part of the claim, not all of it — or backs it for a different population, condition or comparison.
In the citing paper
“three of which (clusters c1, c3, and c5) contained cells expressing high levels of known markers of iridophores (i.e., gpnmb, pnp4a)37 (Supplementary Figs. 17 and 18a, b), as well as genes that were recently identified as iridophore markers (i.e., alx4a, alx4b)23 (Supplementary Figs. 17 and 18c, d)”
From In situ differentiation of iridophore crystallotypes underlies zebrafish stripe patterning (2020) · cites this paper as [23]
Experimental — accuracy not yet measuredThe check wasn’t confident either way, so it gives no verdict — never disputed.
In the citing paper
“Here, differences in color between stripes and interstripes (i.e., blue versus silvery-yellow) persisted even in the absence of other pigments (Fig. 3h)”
From In situ differentiation of iridophore crystallotypes underlies zebrafish stripe patterning (2020) · cites this paper as [23]
Experimental — accuracy not yet measured
Statistics recomputed
Every reported test result, recomputed from its test statistic and degrees of freedom. A result shows as not adding up only once an independent check has confirmed it.
- Consistentz = -6.54reported p < .0001 · recomputed p < .001
“Z = −6.54, p < .0001”
- Consistentz = -4.54reported p < .0001 · recomputed p < .001
“Z = −4.54, p < .0001”
- Consistentz = -13.55reported p < .0001 · recomputed p < .001
“Z = −13.55, p < .0001”
Self-check
Percentages, sums and reported differences re-computed from the paper’s own numbers.
Each contradiction between two passages listed here was confirmed by an independent check.
Rated minor: it would not touch a result — a value no result rests on, a p-value that stays on the same side of the significance level, or a conflict that is clerical, resolved elsewhere in the paper, or outside its own findings.
In the paper
§ Thyroid hormone regulates distinct paths to maturation in pigment cell lineages > Materials and methods > RT-PCR
“melanophores and xanthophores were FAC sorted for the presence aox5:palmeGFP or tyrp1b:palm-mCherry, respectively.”
§ Thyroid hormone regulates distinct paths to maturation in pigment cell lineages > Materials and methods > Melanophore maturation assays
“Melanophores were isolated by identifying cells with high fluorescence in the FITC-A and mCherry-A channels which describe expression of the tuba8l3:nlsEosFP and tyrp1b:palm-mCherry transgenes.”
Rated minor: it would not touch a result — a value no result rests on, a p-value that stays on the same side of the significance level, or a conflict that is clerical, resolved elsewhere in the paper, or outside its own findings.
In the paper
§ Thyroid hormone regulates distinct paths to maturation in pigment cell lineages > Materials and methods > RT-PCR
“Amplifications were 40 cycles with Q5 DNA polymerase (NEB, M0492)”
§ Thyroid hormone regulates distinct paths to maturation in pigment cell lineages > Materials and methods > RT-PCR
“38 cycles at 94°C, 30 s; 67°C, 20 s; 72°C, 20 s.”
Citations
Cites
R: A Language and Environment for Statistical Computing
R Core Team (2000) · doi:10.32614/r.manuals · Cited by 355,893
Fast unfolding of communities in large networks
Blondel, V. D., Guillaume, J.-L., Lambiotte, R., & Lefebvre, E. (2008) · Journal of Statistical Mechanics: Theory and Experiment · doi:10.1088/1742-5468/2008/10/p10008 · Cited by 21,424
UMAP: Uniform Manifold Approximation and Projection
McInnes, L., Healy, J., Saul, N., & Großberger, L. (2018) · Journal of Open Source Software · doi:10.21105/joss.00861 · Cited by 9,826
A biomarker that identifies senescent human cells in culture and in aging skin in vivo.
Dimri, G. P., Lee, X., Basile, G., Acosta, M., Scott, G., Roskelley, C., Medrano, E. E., Linskens, M., Rubelj, I., & Pereira-Smith, O. (1995) · Proceedings of the National Academy of Sciences · doi:10.1073/pnas.92.20.9363 · Cited by 7,477
Trapnell, C., Cacchiarelli, D., Grimsby, J., Pokharel, P., Li, S., Morse, M., Lennon, N. J., Livak, K. J., Mikkelsen, T. S., & Rinn, J. L. (2014) · Nature Biotechnology · doi:10.1038/nbt.2859 · Cited by 7,314
Self-citationDimensionality reduction for visualizing single-cell data using UMAP
Becht, E., McInnes, L., Healy, J., Dutertre, C.-A., Kwok, I. W. H., Ng, L. G., Ginhoux, F., & Newell, E. W. (2019) · Nature Biotechnology · doi:10.1038/nbt.4314 · Cited by 5,358
Reversed graph embedding resolves complex single-cell trajectories
Qiu, X., Mao, Q., Tang, Y., Wang, L., Chawla, R., Pliner, H. A., & Trapnell, C. (2017) · Nature Methods · doi:10.1038/nmeth.4402 · Cited by 5,070
Self-citationThe single-cell transcriptional landscape of mammalian organogenesis
Cao, J., Spielmann, M., Qiu, X., Huang, X., Ibrahim, D. M., Hill, A. J., Zhang, F., Mundlos, S., Christiansen, L., Steemers, F. J., et al. (2019) · Nature · doi:10.1038/s41586-019-0969-x · Cited by 4,490
Self-citationHörlein, A., Näär, A. M., Heinzel, T., Torchia, J., Gloss, B. R., Kurokawa, R., Ryan, A. K., Kamei, Y., Söderström, M., Glass, C. K., et al. (1995) · Nature · doi:10.1038/377397a0 · Cited by 2,072
Single-cell mRNA quantification and differential analysis with Census
Qiu, X., Hill, A. J., Packer, J. S., Lin, D., Ma, Y.-A., & Trapnell, C. (2017) · Nature Methods · doi:10.1038/nmeth.4150 · Cited by 1,904
Self-citation
Cited by
Sorted by citations
Dimensionality reduction by UMAP to visualize physical and genetic interactions
Dorrity, M. W., Saunders, L. M., Queitsch, C., Fields, S., & Trapnell, C. (2020) · Nature Communications · doi:10.1038/s41467-020-15351-4 · Cited by 255
Self-citationThe regulatory landscape of Arabidopsis thaliana roots at single-cell resolution
Dorrity, M. W., Alexandre, C. M., Hamm, M. O., Vigil, A.-L. B. G., Fields, S., Queitsch, C., & Cuperus, J. T. (2021) · Nature Communications · doi:10.1038/s41467-021-23675-y · Cited by 196
Zebrafish Pigment Pattern Formation: Insights into the Development and Evolution of Adult Form
Patterson, L. B., & Parichy, D. M. (2019) · Annual Review of Genetics · doi:10.1146/annurev-genet-112618-043741 · Cited by 151
Self-citationVissio, P. G., Darias, M. J., Yorio, M. P. D., Sirkin, D. I. P., & Delgadin, T. H. (2020) · General and Comparative Endocrinology · doi:10.1016/j.ygcen.2020.113662 · Cited by 110
Comparative transcriptomics reveals candidate carotenoid color genes in an East African cichlid fish
Ahi, E. P., Lecaudey, L. A., Ziegelbecker, A., Steiner, O., Glabonjat, R. A., Goessler, W., Hois, V., Wagner, C., Lass, A., & Sefc, K. M. (2020) · BMC Genomics · doi:10.1186/s12864-020-6473-8 · Cited by 105
Metadata
- Authors
- Saunders, L. M., Mishra, A. K., Aman, A. J., Lewis, V. M., Toomey, M. B., Packer, J. S., Qiu, X., McFaline-Figueroa, J. L., Corbo, J. C., Trapnell, C., & Parichy, D. M.
- Affiliations
- University of Washington (US)
- University of Virginia (US)
- Washington University in St. Louis (US)
- Department of Genome Sciences, University of Washington, Seattle, United States
- Corresponding author
- Saunders, Lauren M
- Mishra, Abhishek K
- Aman, Andrew J
- Lewis, Victor M
- Toomey, Matthew B
- Packer, Jonathan S
- Qiu, Xiaojie
- Corbo, Joseph C
- Trapnell, Cole
- Parichy, David M
- ORCID
- Venue
- eLife
- Publisher
- eLife Sciences Publications, Ltd
- Published
- 2019-05-29
- Volume
- 8
- ISSN
- 2050-084X (ISSN-L)
- PMC
- PMC6588384
- OpenAlex
- W2911328426
- Cited by
- 170
- References
- 140
- Citations by year
- 2026: 21 · 2025: 25 · 2024: 22 · 2023: 28 · 2022: 17 · 2021: 32 · 2020: 16 · 2019: 9
- FWCI
- 6.20
- Type
- journal article
- Language
- en
- Open access
- gold
- doi.org
- Licence
- Locations
- eLife (publishedVersion, cc-by)
- bioRxiv (Cold Spring Harbor Laboratory) (acceptedVersion, cc-by)
- PubMed Central (publishedVersion, cc-by)
- PubMed (publishedVersion)
- Digital Commons@Becker (Washington University School of Medicine) (submittedVersion, cc-by)
- DOAJ (DOAJ: Directory of Open Access Journals) (submittedVersion, cc-by-sa)
- Funders
- National Institute of General Medical Sciences (R35 GM122471, T32 GM007067)
- Eunice Kennedy Shriver National Institute of Child Health and Human Development (DP2 HD088158)
- National Eye Institute (EY024958, EY025196, EY026672)
- W. M. Keck Foundation
- Alfred P. Sloan Foundation
- Paul G Allen Frontiers Group
- Topics
- Life Sciences › Biochemistry, Genetics and Molecular Biology › Molecular Biology › Developmental Biology and Gene Regulation
- Life Sciences › Biochemistry, Genetics and Molecular Biology › Cell Biology › melanin and skin pigmentation
- Life Sciences › Biochemistry, Genetics and Molecular Biology › Cell Biology › Zebrafish Biomedical Research Applications
- Keywords
- thyroid hormones, melanophores, xanthophores, neural crest, stripe patterns, terminal differentiation, carotenoid accumulation, thyroid hormone receptor, developmental trajectories, zebrafish
- MeSH terms
- Animals, Cell Differentiation, Neural Crest, Pigments, Biological, Thyroid Hormones, Zebrafish, Gene Expression Regulation, Developmental, Gene Expression Profiling
About these checks
Registry, retraction, Cites and statistics results are computed, not judged, with one exception: a printed reference that no index lists is read once by a model before it counts as a citation error. Claims are extracted by a model and kept only when their quote appears verbatim in the text; each cited source is then checked, with a model’s help, for whether it says what the claim relies on. Those verdicts can be wrong — read the claim’s quote and the cited source before relying on one.
A language model drew the claims from the paper on 2026-11-02, under version 3 of the claim definition (model deepseek-v4.1-flash, prompt extract-v3).
A second model labelled each claim on 2026-11-02 (model jev-1.13-20260917, definition revision gold-guideline-v0.2).
Cited sources are checked with a language model’s help (gpt-6-sol).
Statistics and arithmetic are recomputed, not judged.
Confidence bands are shown only for fields calibrated on our annotated test set. None is calibrated yet, so no band is shown.
What counts as a claim ›How we measure confidence ›How we check this ›
Are you an author, or do you see a problem with this page? Request a review
