

The DOI matches its Crossref record; 68 of the 70 references it cites were found in a registry or an index.
Cortical tau deposition follows patterns of entorhinal functional connectivity in aging
Open accessAbstract
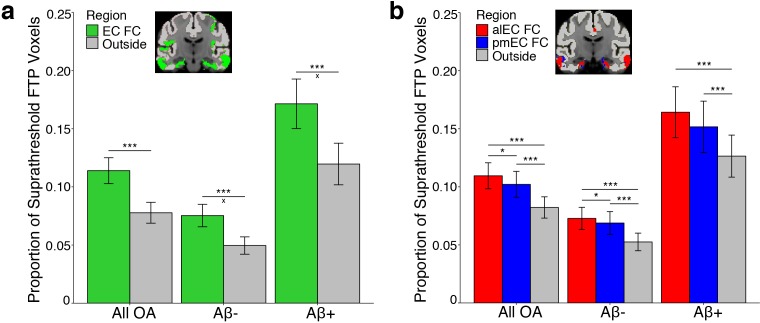
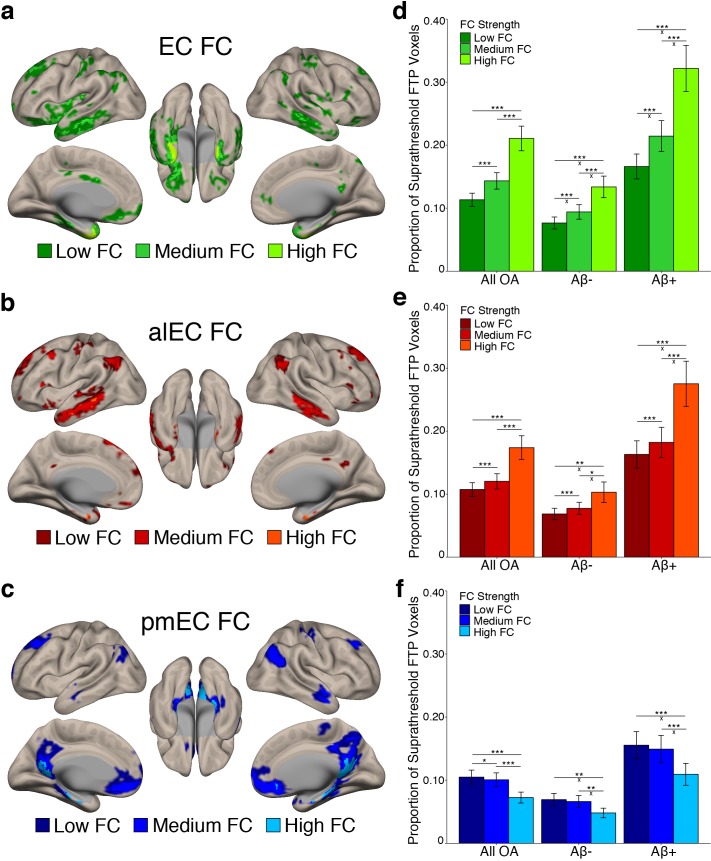
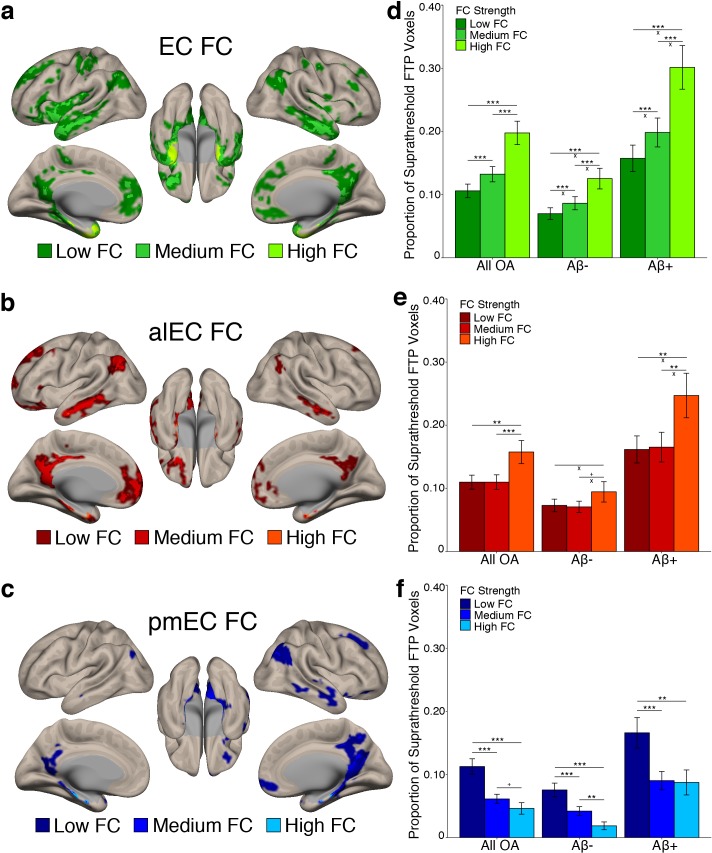
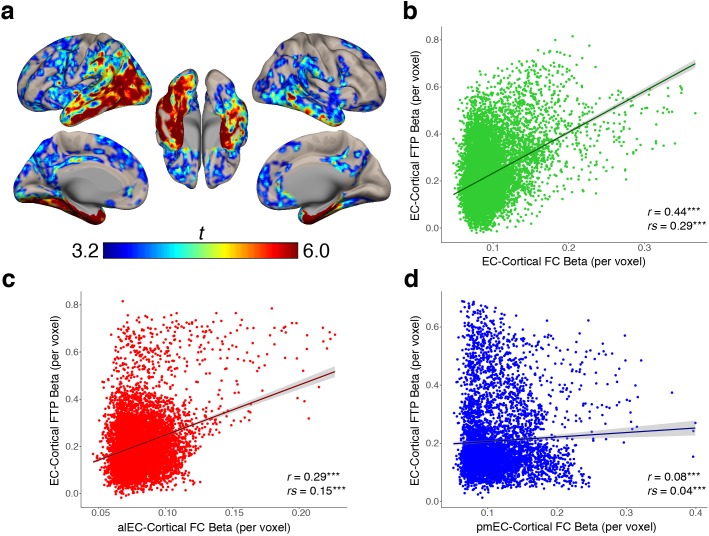
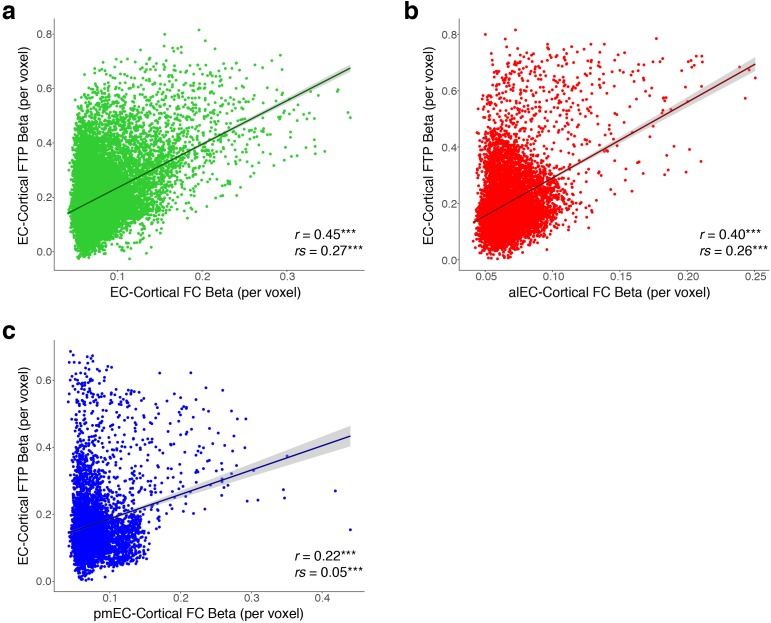
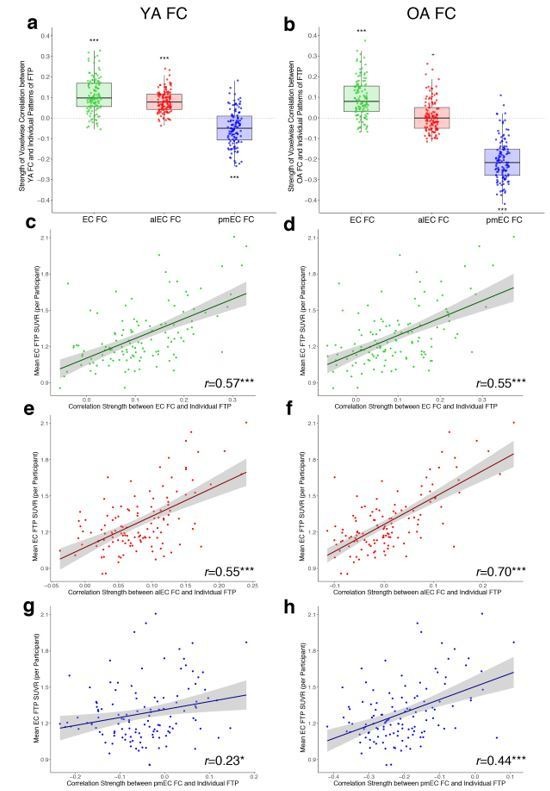
Tau pathology first appears in the transentorhinal and anterolateral entorhinal cortex (alEC) in the aging brain. The transition to Alzheimer’s disease (AD) is hypothesized to involve amyloid-β (Aβ) facilitated tau spread through neural connections. We contrasted functional connectivity (FC) of alEC and posteromedial EC (pmEC), subregions of EC that differ in functional specialization and cortical connectivity, with the hypothesis that alEC-connected cortex would show greater tau deposition than pmEC-connected cortex. We used resting state fMRI to measure FC, and PET to measure tau and Aβ in cognitively normal older adults. Tau preferentially deposited in alEC-connected cortex compared to pmEC-connected or non-connected cortex, and stronger connectivity was associated with increased tau deposition. FC-tau relationships were present regardless of Aβ, although strengthened with Aβ. These results provide an explanation for the anatomic specificity of neocortical tau deposition in the aging brain and reveal relationships between normal aging and the evolution of AD.
Overview
The claims and statistics of this paper haven’t been checked yet.
Run the check — free, no account needed. It reads the open-access text and checks the sources it cites.
Integrity signals
Registry
Cites
Statistics
Figures
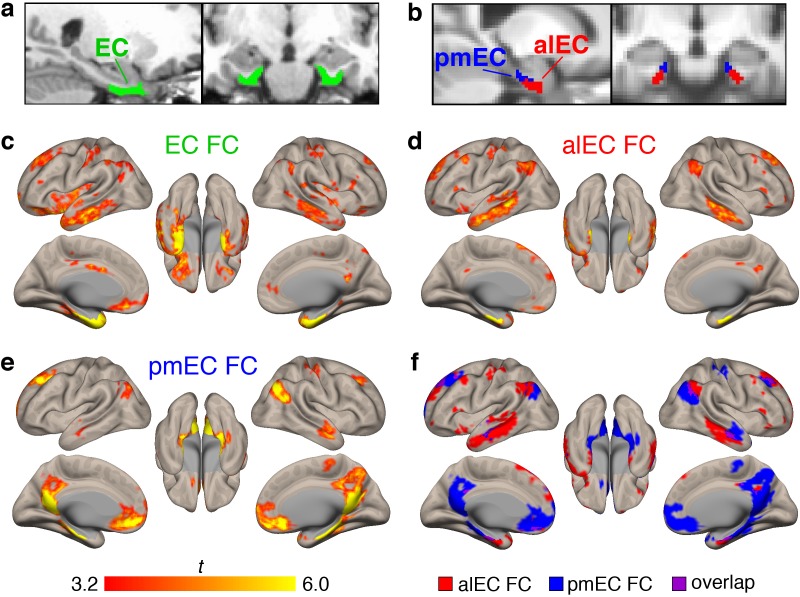
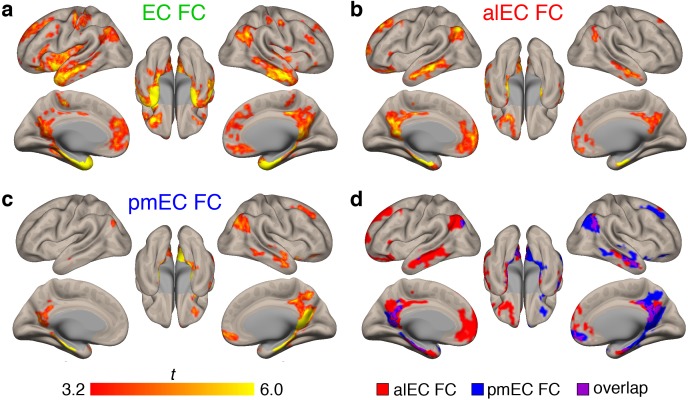
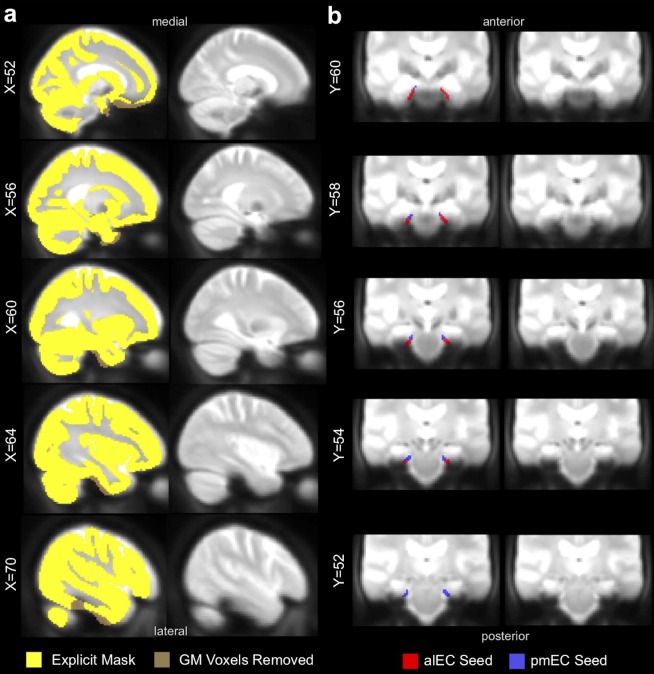
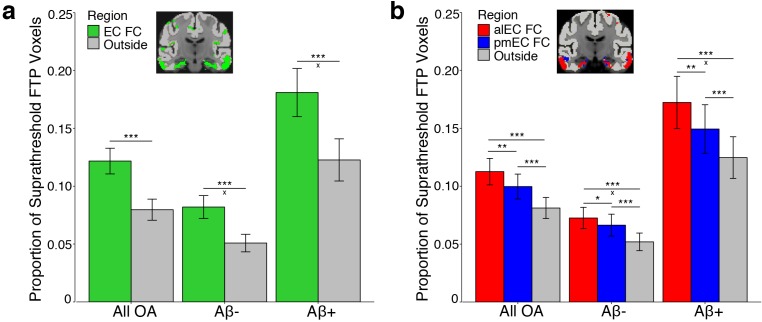
Verification
Claims the paper makes
The claims and statistics of this paper haven’t been checked yet.
Run the check — free, no account needed. It reads the open-access text and checks the sources it cites.
Claims other papers make about this one
Each is checked against this paper’s own text: does it say what the citing paper says it does?
The cited source says what the claim attributes to it.
In the citing paper
“The vulnerability of the entorhinal neurons has been reported in many previous studies (Adams et al., 2019, Rodriguez et al., 2019, Braak and Del Tredici, 2020).”
From Disrupted structural connectivity in ArcAβ mouse model of Aβ amyloidosis (2020) · cites this paper as Adams et al., 2019
Self-check
Percentages, sums and reported differences re-computed from the paper’s own numbers.
The self-check needs the paper’s full text.
Citations
Cites
Neuropathological stageing of Alzheimer-related changes.
Braak, H., & Braak, E. (1991) · Acta Neuropathologica · doi:10.1007/bf00308809 · Cited by 16,123
Desikan, R. S., Ségonne, F., Fischl, B., Quinn, B. T., Dickerson, B. C., Blacker, D., Buckner, R. L., Dale, A. M., Maguire, R. P., Hyman, B. T., et al. (2006) · NeuroImage · doi:10.1016/j.neuroimage.2006.01.021 · Cited by 13,324
Spontaneous fluctuations in brain activity observed with functional magnetic resonance imaging
Fox, M. D., & Raichle, M. E. (2007) · Nature Reviews Neuroscience · doi:10.1038/nrn2201 · Cited by 6,700
Conn : A Functional Connectivity Toolbox for Correlated and Anticorrelated Brain Networks
Whitfield-Gabrieli, S., & Nieto-Castanon, A. (2012) · Brain Connectivity · doi:10.1089/brain.2012.0073 · Cited by 4,885
Hypothetical model of dynamic biomarkers of the Alzheimer's pathological cascade
Jack, C. R., Knopman, D. S., Jagust, W. J., Shaw, L. M., Aisen, P. S., Weiner, M. W., Petersen, R. C., & Trojanowski, J. Q. (2010) · The Lancet Neurology · doi:10.1016/s1474-4422(09)70299-6 · Cited by 4,806
Self-citationA component based noise correction method (CompCor) for BOLD and perfusion based fMRI
Behzadi, Y., Restom, K., Liau, J., & Liu, T. T. (2007) · NeuroImage · doi:10.1016/j.neuroimage.2007.04.042 · Cited by 4,502
Phases of Aβ-deposition in the human brain and its relevance for the development of AD
Thal, D. R., Rüb, U., Orantes, M., & Braak, H. (2002) · Neurology · doi:10.1212/wnl.58.12.1791 · Cited by 3,490
Two Phase 3 Trials of Bapineuzumab in Mild-to-Moderate Alzheimer's Disease
Salloway, S., Sperling, R., Fox, N. C., Blennow, K., Klunk, W., Raskind, M., Sabbagh, M., Honig, L. S., Porsteinsson, A. P., Ferris, S., et al. (2014) · New England Journal of Medicine · doi:10.1056/nejmoa1304839 · Cited by 1,960
Frequency of Stages of Alzheimer-Related Lesions in Different Age Categories
Braak, H., & Braak, E. (1997) · Neurobiology of Aging · doi:10.1016/s0197-4580(97)00056-0 · Cited by 1,656
Propagation of Tau Pathology in a Model of Early Alzheimer's Disease
de Calignon, A., Polydoro, M., Suárez-Calvet, M., William, C., Adamowicz, D. H., Kopeikina, K. J., Pitstick, R., Sahara, N., Ashe, K. H., Carlson, G. A., et al. (2012) · Neuron · doi:10.1016/j.neuron.2011.11.033 · Cited by 1,427
Two cortical systems for memory-guided behaviour
Ranganath, C., & Ritchey, M. (2012) · Nature Reviews Neuroscience · doi:10.1038/nrn3338 · Cited by 1,377
PET Imaging of Tau Deposition in the Aging Human Brain
Schöll, M., Lockhart, S. N., Schonhaut, D. R., O’Neil, J. P., Janabi, M., Ossenkoppele, R., Baker, S. L., Vogel, J. W., Faria, J., Schwimmer, H. D., et al. (2016) · Neuron · doi:10.1016/j.neuron.2016.01.028 · Cited by 1,214
Self-citationSynthesis and Evaluation of 11C-Labeled 6-Substituted 2-Arylbenzothiazoles as Amyloid Imaging Agents
Mathis, C. A., Wang, Y., Holt, D. P., Huang, G.-F., Debnath, M. L., & Klunk, W. E. (2003) · Journal of Medicinal Chemistry · doi:10.1021/jm030026b · Cited by 976
Recent progress and outstanding issues in motion correction in resting state fMRI
Power, J. D., Schlaggar, B. L., & Petersen, S. E. (2015) · NeuroImage · doi:10.1016/j.neuroimage.2014.10.044 · Cited by 957
Correction for partial volume effects in PET: principle and validation.
ROUSSET, O. G., Ma, Y., & Evans, A. C. (1998) · PubMed · Cited by 919
Functional organization of the extrinsic and intrinsic circuitry of the parahippocampal region
Witter, M. P., Groenewegen, H. J., Lopes, F. H. D. S., & Lohman, A. H. M. (1989) · Progress in Neurobiology · doi:10.1016/0301-0082(89)90009-9 · Cited by 918
Palmqvist, S., Schöll, M., Strandberg, O., Mattsson, N., Stomrud, E., Zetterberg, H., Blennow, K., Landau, S., Jagust, W., & Hansson, O. (2017) · Nature Communications · doi:10.1038/s41467-017-01150-x · Cited by 911
Self-citationNeuronal activity enhances tau propagation and tau pathology in vivo
Wu, J. W., Hussaini, S. A., Bastille, I. M., Rodriguez, G. A., Mrejeru, A., Rilett, K., Sanders, D. W., Cook, C., Fu, H., Boonen, R. A. C. M., et al. (2016) · Nature Neuroscience · doi:10.1038/nn.4328 · Cited by 820
Kinetic Modeling of Amyloid Binding in Humans using PET Imaging and Pittsburgh Compound-B
Price, J. C., Klunk, W. E., Lopresti, B. J., Lu, X., Hoge, J. A., Ziolko, S. K., Holt, D. P., MELTZER, C. C., DeKosky, S. T., & Mathis, C. A. (2005) · Journal of Cerebral Blood Flow & Metabolism · doi:10.1038/sj.jcbfm.9600146 · Cited by 723
Hoesen, G. W. V., Pandya, D. Ν., & Butters, N. (1975) · Brain Research · doi:10.1016/0006-8993(75)90205-x · Cited by 696
Randomized trial of verubecestat for mild-to-moderate Alzheimer's disease
Egan, M. F., Kost, J., Tariot, P. N., Aisen, P. S., Cummings, J. L., Vellas, B., Sur, C., Mukai, Y., Voss, T., Furtek, C., et al. (2018) · New England Journal of Medicine · doi:10.1056/nejmoa1706441 · Cited by 685
Physiological release of endogenous tau is stimulated by neuronal activity
Pooler, A. M., Phillips, E. C., Lau, D. H. W., Noble, W., & Hanger, D. P. (2013) · The EMBO Reports · doi:10.1038/embor.2013.15 · Cited by 642
The parahippocampal gyrus: New observations regarding its cortical connections in the monkey
Hoesen, G. W. V. (1982) · Trends in Neurosciences · doi:10.1016/0166-2236(82)90201-6 · Cited by 624
Marquié, M., Normandin, M. D., Vanderburg, C. R., Costantino, I. M., Bien, E. A., Rycyna, L. G., Klunk, W. E., Mathis, C. A., Ikonomovic, M. D., Debnath, M. L., et al. (2015) · Annals of Neurology · doi:10.1002/ana.24517 · Cited by 615
Neuronal activity regulates extracellular tau in vivo
Yamada, K., Holth, J. K., Liao, F., Stewart, F. R., Mahan, T. E., Jiang, H., Cirrito, J. R., Patel, T. K., Hochgräfe, K., Mandelkow, E., et al. (2014) · The Journal of Experimental Medicine · doi:10.1084/jem.20131685 · Cited by 606
Imaging the evolution and pathophysiology of Alzheimer disease
Jagust, W. (2018) · Nature Reviews Neuroscience · doi:10.1038/s41583-018-0067-3 · Cited by 604
Self-citationKhan, U. A., Liu, L., Provenzano, F. A., Berman, D. E., Profaci, C. P., Sloan, R., Mayeux, R., Duff, K. E., & Small, S. A. (2014) · Nature Neuroscience · doi:10.1038/nn.3606 · Cited by 561
Kahn, I., Andrews‐Hanna, J. R., Vincent, J. L., Snyder, A. Z., & Buckner, R. L. (2008) · Journal of Neurophysiology · doi:10.1152/jn.00077.2008 · Cited by 509
In vivo cortical spreading pattern of tau and amyloid in the Alzheimer disease spectrum
Cho, H., Choi, J. Y., Hwang, M. S., Kim, Y. J., Lee, H. M., Lee, H. S., Lee, J. H., Ryu, Y. H., Lee, M. S., & Lyoo, C. H. (2016) · Annals of Neurology · doi:10.1002/ana.24711 · Cited by 499
Comparison of multiple tau-PET measures as biomarkers in aging and Alzheimer's disease
Maass, A., Landau, S., Baker, S. L., Horng, A., Lockhart, S. N., La Joie, R., Rabinovici, G. D., & Jagust, W. J. (2017) · NeuroImage · doi:10.1016/j.neuroimage.2017.05.058 · Cited by 462
Self-citationUltra-fast MRI of the human brain with simultaneous multi-slice imaging
Feinberg, D. A., & Setsompop, K. (2013) · Journal of Magnetic Resonance · doi:10.1016/j.jmr.2013.02.002 · Cited by 442
Functional neuroanatomy of the parahippocampal region: The lateral and medial entorhinal areas
Kerr, K. M., Agster, K. L., Furtak, S. C., & Burwell, R. D. (2007) · Hippocampus · doi:10.1002/hipo.20315 · Cited by 433
Schwarz, A. J., Yu, P., Miller, B. B., Shcherbinin, S., Dickson, J., Navitsky, M., Joshi, A. D., Devous, M. D., & Mintun, M. S. (2016) · Brain · doi:10.1093/brain/aww023 · Cited by 425
Graphical analysis of PET data applied to reversible and irreversible tracers
Logan, J. (2000) · Nuclear Medicine and Biology · doi:10.1016/s0969-8051(00)00137-2 · Cited by 416
Tau impairs neural circuits, dominating amyloid-β effects, in Alzheimer models in vivo
Busche, M. A., Wegmann, S., Dujardin, S., Commins, C., Schiantarelli, J., Klickstein, N., Kamath, T. V., Carlson, G. A., Nelken, I., & Hyman, B. T. (2019) · Nature Neuroscience · doi:10.1038/s41593-018-0289-8 · Cited by 413
Ckmeans.1d.dp: Optimal k-means Clustering in One Dimension by Dynamic Programming
Wang, H., & Song, M. J. (2011) · The R Journal · doi:10.32614/rj-2011-015 · Cited by 383
Swanson, L. W., & Köhler, C. (1986) · Journal of Neuroscience · doi:10.1523/jneurosci.06-10-03010.1986 · Cited by 340
Schultz, A. P., Chhatwal, J. P., Hedden, T., Mormino, E. C., Hanseeuw, B. J., Sepulcre, J., Huijbers, W., LaPoint, M., Buckley, R. F., Johnson, K. A., et al. (2017) · The Journal of Neuroscience · doi:10.1523/jneurosci.3263-16.2017 · Cited by 330
Libby, L. A., Ekstrom, A. D., Ragland, J. D., & Ranganath, C. (2012) · Journal of Neuroscience · doi:10.1523/jneurosci.3711-11.2012 · Cited by 311
Considerations and code for partial volume correcting [ 18 F]-AV-1451 tau PET data
Baker, S. L., Maaß, A., & Jagust, W. J. (2017) · Data in Brief · doi:10.1016/j.dib.2017.10.024 · Cited by 298
Self-citationBraak, H., & Braak, E. (1985) · Acta Neuropathologica · doi:10.1007/bf00690836 · Cited by 287
Jacobs, H. I. L., Hedden, T., Schultz, A. P., Sepulcre, J., Perea, R. D., Amariglio, R. E., Papp, K. V., Rentz, D. M., Sperling, R. A., & Johnson, K. A. (2018) · Nature Neuroscience · doi:10.1038/s41593-018-0070-z · Cited by 270
Functional subregions of the human entorhinal cortex
Maaß, A., Berron, D., Libby, L. A., Ranganath, C., & Düzel, E. (2015) · eLife · doi:10.7554/elife.06426 · Cited by 266
Longitudinal tau accumulation and atrophy in aging and alzheimer disease
Harrison, T. M., Joie, R. L., Maaß, A., Baker, S. L., Swinnerton, K. N., Fenton, L. E., Mellinger, T. J., Edwards, L., Pham, J. Q., Miller, B. L., et al. (2018) · Annals of Neurology · doi:10.1002/ana.25406 · Cited by 262
Self-citationKaufman, S. K., Del Tredici, K., Thomas, T. L., Braak, H., & Diamond, M. I. (2018) · Acta Neuropathologica · doi:10.1007/s00401-018-1855-6 · Cited by 259
Tau burden and the functional connectome in Alzheimer’s disease and progressive supranuclear palsy
Cope, T., Rittman, T., Borchert, R. J., Jones, P. S., Vatansever, D., Allinson, K. S. J., Passamonti, L., Rodríguez, P. V., Bevan-Jones, W. R., O'Brien, J. T., et al. (2017) · Brain · doi:10.1093/brain/awx347 · Cited by 251
Schöll, M., Maaß, A., Mattsson, N., Ashton, N. J., Blennow, K., Zetterberg, H., & Jagust, W. J. (2018) · Molecular and Cellular Neuroscience · doi:10.1016/j.mcn.2018.12.001 · Cited by 248
Self-citationFunctional connectivity associated with tau levels in ageing, Alzheimer’s, and small vessel disease
Franzmeier, N., Rubinski, A., Neitzel, J., Kim, Y., Damm, A., Na, D. L., Kim, H. J., Lyoo, C. H., Cho, H., Finsterwalder, S., et al. (2019) · Brain · doi:10.1093/brain/awz026 · Cited by 243
Modelling large motion events in fMRI studies of patients with epilepsy
Lemieux, L., Salek‐Haddadi, A., Lund, T. E., Laufs, H., & Carmichael, D. W. (2007) · Magnetic Resonance Imaging · doi:10.1016/j.mri.2007.03.009 · Cited by 240
Reagh, Z. M., & Yassa, M. A. (2014) · Proceedings of the National Academy of Sciences · doi:10.1073/pnas.1411250111 · Cited by 239
Amyloid accelerates tau propagation and toxicity in a model of early Alzheimer’s disease
Pooler, A. M., Polydoro, M., Maury, E. A., Nicholls, S. B., Reddy, S. M., Wegmann, S., William, C., Saqran, L., Cagsal-Getkin, O., Pitstick, R., et al. (2015) · Acta Neuropathologica Communications · doi:10.1186/s40478-015-0199-x · Cited by 236
Architecture of the cerebral cortical association connectome underlying cognition
Bota, M., Sporns, O., & Swanson, L. W. (2015) · Proceedings of the National Academy of Sciences · doi:10.1073/pnas.1504394112 · Cited by 231
Hurtado, D. E., Molina-Porcel, L., Iba, M., Aboagye, A. K., Paul, S. M., Trojanowski, J. Q., & Lee, V. M.-Y. (2010) · The American Journal of Pathology · doi:10.2353/ajpath.2010.100346 · Cited by 222
Goh, J. O. S. (2011) · Europe PMC (PubMed Central) · Cited by 221
Reagh, Z. M., Noche, J. A., Tustison, N. J., Delisle, D., Murray, E. A., & Yassa, M. A. (2018) · Neuron · doi:10.1016/j.neuron.2018.01.039 · Cited by 212
Functional topography of the human entorhinal cortex
Schröder, T. N., Haak, K. V., Jimenez, N. I. Z., Beckmann, C. F., & Doeller, C. F. (2015) · eLife · doi:10.7554/elife.06738 · Cited by 211
Alzheimer’s pathology targets distinct memory networks in the ageing brain
Maaß, A., Berron, D., Harrison, T. M., Adams, J. N., Joie, R. L., Baker, S. L., Mellinger, T. J., Bell, R. K., Swinnerton, K. N., Inglis, B. A., et al. (2019) · Brain · doi:10.1093/brain/awz154 · Cited by 209
Self-citationIn Vivo Tau, Amyloid, and Gray Matter Profiles in the Aging Brain
Sepulcre, J., Schultz, A. P., Sabuncu, M. R., Gómez‐Isla, T., Chhatwal, J. P., Becker, A., Sperling, R. A., & Johnson, K. A. (2016) · Journal of Neuroscience · doi:10.1523/jneurosci.0639-16.2016 · Cited by 182
Todd, N., Moeller, S., Auerbach, E. J., Yacoub, E. S., Flandin, G., & Weiskopf, N. (2015) · NeuroImage · doi:10.1016/j.neuroimage.2015.08.056 · Cited by 177
Age-related functional changes in domain-specific medial temporal lobe pathways
Berron, D., Neumann, K., Maaß, A., Schütze, H., Fließbach, K., Kiven, V., Jessen, F., Sauvage, M. M., Kumaran, D., & Düzel, E. (2018) · Neurobiology of Aging · doi:10.1016/j.neurobiolaging.2017.12.030 · Cited by 158
Mormino, E. C., Brandel, M. G., Madison, C. M., Rabinovici, G. D., Marks, S., Baker, S. L., & Jagust, W. J. (2012) · NeuroImage · doi:10.1016/j.neuroimage.2011.07.098 · Cited by 158
Self-citationTau‐PET uptake: Regional variation in average SUVR and impact of amyloid deposition
Vemuri, P., Lowe, V. J., Knopman, D. S., Senjem, M. L., Kemp, B. J., Schwarz, C. G., Przybelski, S. A., Machulda, M. M., Petersen, R. C., & Jack, C. R. (2016) · Alzheimer s & Dementia Diagnosis Assessment & Disease Monitoring · doi:10.1016/j.dadm.2016.12.010 · Cited by 120
Olsen, R. K., Yeung, L., Noly‐Gandon, A., D’Angelo, M. C., Kacollja, A., Smith, V. M., Ryan, J. D., & Barense, M. D. (2017) · Neurobiology of Aging · doi:10.1016/j.neurobiolaging.2017.04.025 · Cited by 113
Amyloid Deposition Is Linked to Aberrant Entorhinal Activity among Cognitively Normal Older Adults
Huijbers, W., Mormino, E. C., Wigman, S. E., Ward, A. M., Vannini, P., McLaren, D. G., Becker, J. A., Schultz, A. P., Hedden, T., Johnson, K. A., et al. (2014) · Journal of Neuroscience · doi:10.1523/jneurosci.3579-13.2014 · Cited by 91
Amyloid and tau PET demonstrate region-specific associations in normal older people
Lockhart, S. N., Schöll, M., Baker, S. L., Ayakta, N., Swinnerton, K. N., Bell, R. K., Mellinger, T. J., Shah, V. D., O’Neil, J. P., Janabi, M., et al. (2017) · NeuroImage · doi:10.1016/j.neuroimage.2017.02.051 · Cited by 80
Self-citationWhittington, A., Sharp, D. J., & Gunn, R. N. (2017) · Journal of Nuclear Medicine · doi:10.2967/jnumed.117.194720 · Cited by 78
Direct Evidence for Domain-Sensitive Functional Subregions in Human Entorhinal Cortex
Schultz, H., Sommer, T., & Peters, J. (2012) · Journal of Neuroscience · doi:10.1523/jneurosci.5126-11.2012 · Cited by 73
Anatomic localization of the transentorhinal region of the perirhinal cortex
Taylor, K. I., & Probst, A. (2007) · Neurobiology of Aging · doi:10.1016/j.neurobiolaging.2007.03.024 · Cited by 73
Cited by
Sorted by citations
Synergy between amyloid-β and tau in Alzheimer’s disease
Busche, M. A., & Hyman, B. T. (2020) · Nature Neuroscience · doi:10.1038/s41593-020-0687-6 · Cited by 1,242
Spread of pathological tau proteins through communicating neurons in human Alzheimer’s disease
Vogel, J. W., Iturria‐Medina, Y., Strandberg, O. T., Smith, R. A., Levitis, E., Evans, A. C., Hansson, O., Initiative, A. D. N., Weiner, M. W., Aisen, P., et al. (2020) · Nature Communications · doi:10.1038/s41467-020-15701-2 · Cited by 537
Self-citationSynaptic degeneration in Alzheimer disease
Tzioras, M., McGeachan, R. I., Durrant, C. S., & Spires-Jones, T. L. (2023) · Nature Reviews Neurology · doi:10.1038/s41582-022-00749-z · Cited by 504
The human connectome in Alzheimer disease — relationship to biomarkers and genetics
Yu, M., Sporns, O., & Saykin, A. J. (2021) · Nature Reviews Neurology · doi:10.1038/s41582-021-00529-1 · Cited by 265
Therapeutic Approach to Alzheimer’s Disease: Current Treatments and New Perspectives
Pardo-Moreno, T., González-Acedo, A., Rivas-Domínguez, A., García-Morales, V., García-Cozar, F. J., Ramos-Rodríguez, J. J., & Melguizo-Rodríguez, L. (2022) · Pharmaceutics · doi:10.3390/pharmaceutics14061117 · Cited by 239
Metadata
- Authors
- Adams, J. N., Maass, A., Harrison, T. M., Baker, S. L., & Jagust, W. J.
- Affiliations
- University of California, Berkeley (US)
- German Center for Neurodegenerative Diseases (DE)
- Lawrence Berkeley National Laboratory (US)
- Corresponding author
- Adams, Jenna N
- Venue
- eLife
- Publisher
- eLife Sciences Publications, Ltd
- Published
- 2019-09-02
- Volume
- 8
- ISSN
- 2050-084X (ISSN-L)
- PMC
- PMC6764824
- OpenAlex
- W2971637931
- Cited by
- 160
- References
- 70
- Citations by year
- 2026: 10 · 2025: 29 · 2024: 30 · 2023: 20 · 2022: 27 · 2021: 34 · 2020: 8 · 2019: 1
- FWCI
- 13.94
- Type
- journal article
- Language
- en
- Open access
- gold
- doi.org
- Licence
- Locations
- eLife (publishedVersion, cc-by)
- Europe PMC (PubMed Central) (publishedVersion, cc-by)
- PubMed Central (publishedVersion, cc-by)
- PubMed (publishedVersion)
- eScholarship (California Digital Library) (submittedVersion)
- OSTI OAI (U.S. Department of Energy Office of Scientific and Technical Information) (submittedVersion)
- DOAJ (DOAJ: Directory of Open Access Journals) (submittedVersion, cc-by-sa)
- DZNE Pub (submittedVersion, other-oa)
- Funders
- National Institutes of Health (R01-AG034570, F32-AG057107)
- Helmholtz-Gemeinschaft (Postdoc Program PD-306)
- Tau Consortium
- Topics
- Health Sciences › Medicine › Psychiatry and Mental health › Dementia and Cognitive Impairment Research
- Life Sciences › Neuroscience › Cellular and Molecular Neuroscience › Alzheimer's disease research and treatments
- Life Sciences › Neuroscience › Cognitive Neuroscience › Functional Brain Connectivity Studies
- Keywords
- tau deposition, entorhinal cortex, functional connectivity, brain aging, Alzheimer's disease, amyloid-beta, transentorhinal cortex, resting-state fMRI, positron emission tomography, cognitive aging
- MeSH terms
- Adult, Aged, Aged, 80 and over, Aging, Brain Mapping, Female, Humans, Magnetic Resonance Imaging, Male, Middle Aged, Neural Pathways, Amyloid beta-Peptides, tau Proteins, Entorhinal Cortex, Positron-Emission Tomography, Young Adult
About these checks
Registry, retraction, Cites and statistics results are computed, not judged, with one exception: a printed reference that no index lists is read once by a model before it counts as a citation error. Claims are extracted by a model and kept only when their quote appears verbatim in the text; each cited source is then checked, with a model’s help, for whether it says what the claim relies on. Those verdicts can be wrong — read the claim’s quote and the cited source before relying on one.
Statistics and arithmetic are recomputed, not judged.
Confidence bands are shown only for fields calibrated on our annotated test set. None is calibrated yet, so no band is shown.
What counts as a claim ›How we measure confidence ›How we check this ›
Are you an author, or do you see a problem with this page? Request a review
