

The DOI matches its Crossref record; 76 of the 77 references it cites were found in a registry or an index, and 1 are not checked yet.
A non-mosaic transchromosomic mouse model of down syndrome carrying the long arm of human chromosome 21.
Open accessAbstract
Animal models of Down syndrome (DS), trisomic for human chromosome 21 (HSA21) genes or orthologs, provide insights into better understanding and treatment options. The only existing transchromosomic (Tc) mouse DS model, Tc1, carries a HSA21 with over 50 protein coding genes (PCGs) disrupted. Tc1 is mosaic, compromising interpretation of results. Here, we “clone” the 34 MB long arm of HSA21 (HSA21q) as a mouse artificial chromosome (MAC). Through multiple steps of microcell-mediated chromosome transfer, we created a new Tc DS mouse model, Tc(HSA21q;MAC)1Yakaz (“TcMAC21”). TcMAC21 is not mosaic and contains 93% of HSA21q PCGs that are expressed and regulatable. TcMAC21 recapitulates many DS phenotypes including anomalies in heart, craniofacial skeleton and brain, molecular/cellular pathologies, and impairments in learning, memory and synaptic plasticity. TcMAC21 is the most complete genetic mouse model of DS extant and has potential for supporting a wide range of basic and preclinical research.
Overview
The claims and statistics of this paper haven’t been checked yet.
Run the check — free, no account needed. It reads the open-access text and checks the sources it cites.
Integrity signals
Registry
Cites
Statistics
Figures
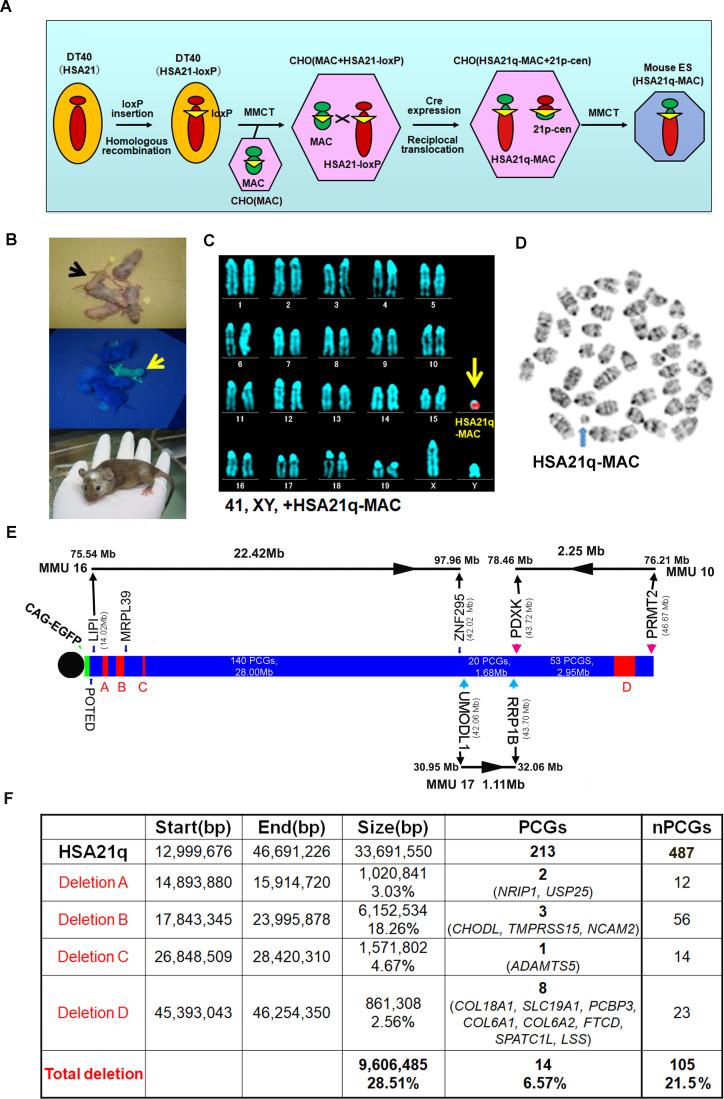
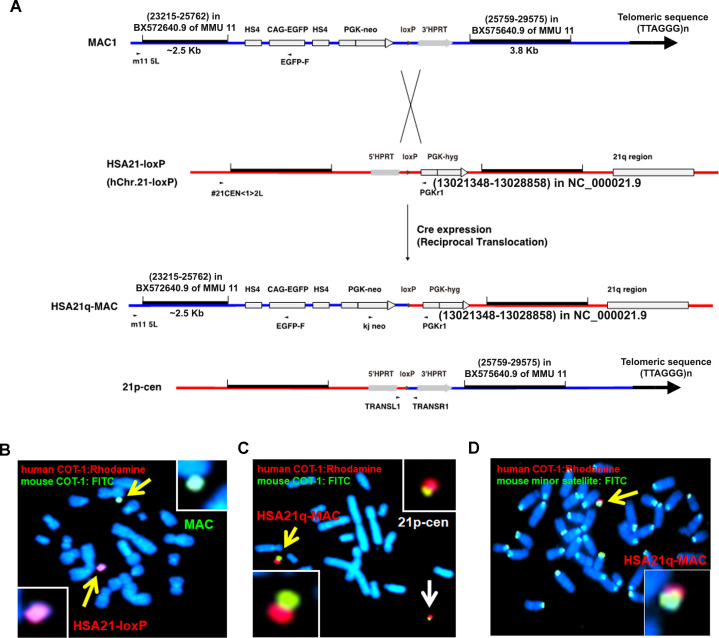
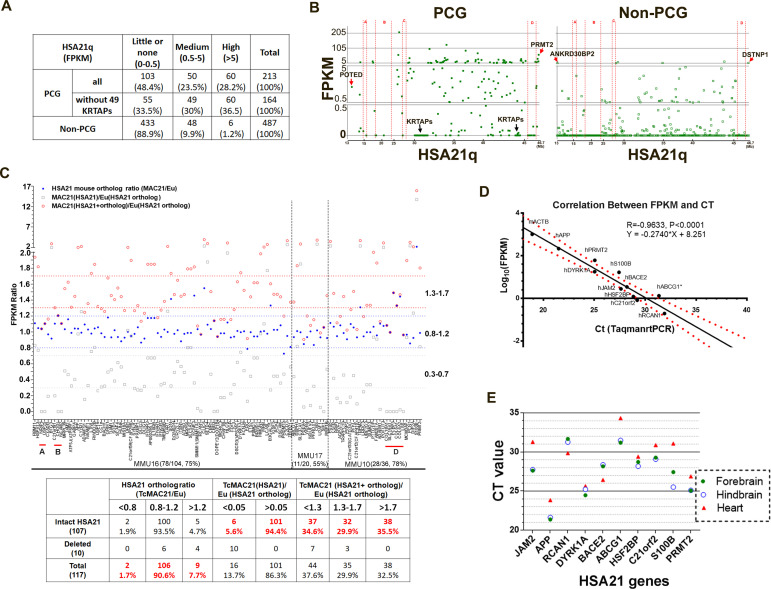
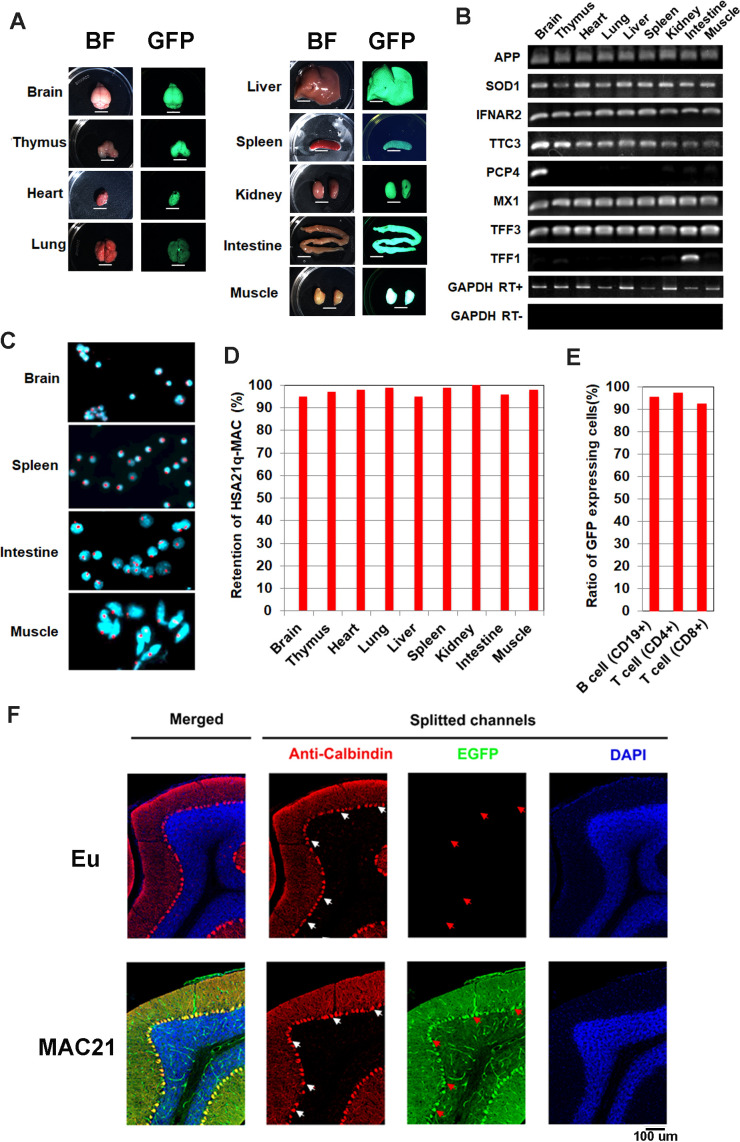
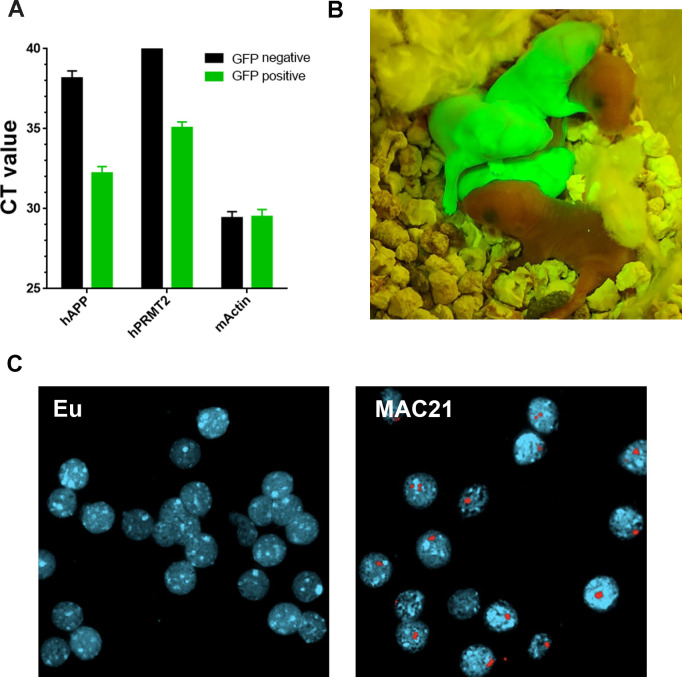
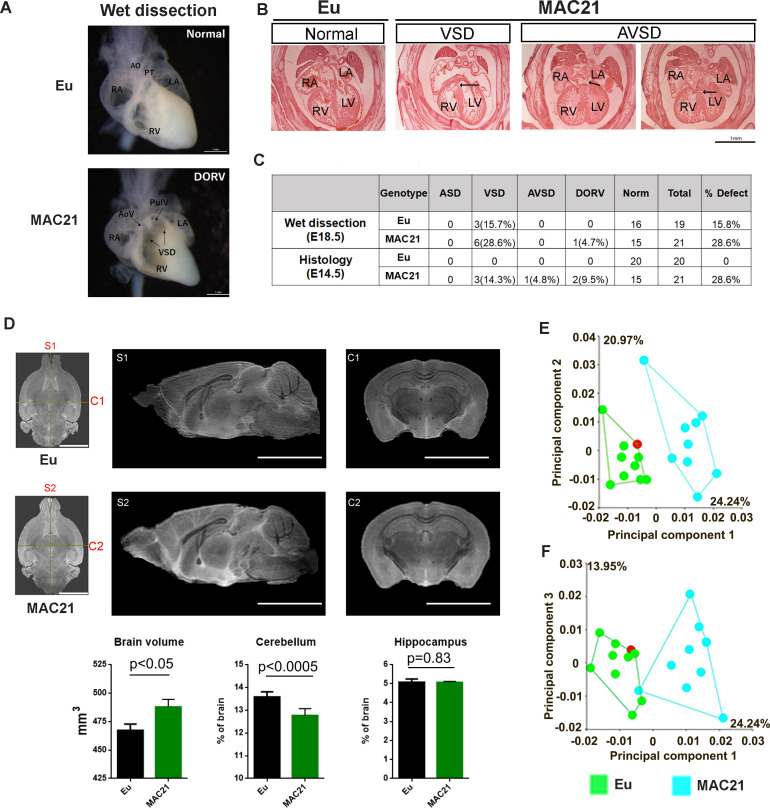
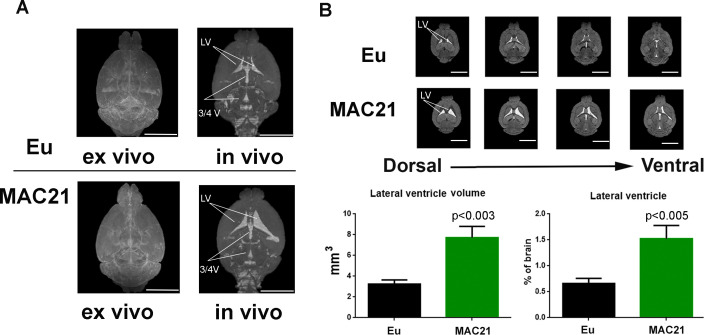
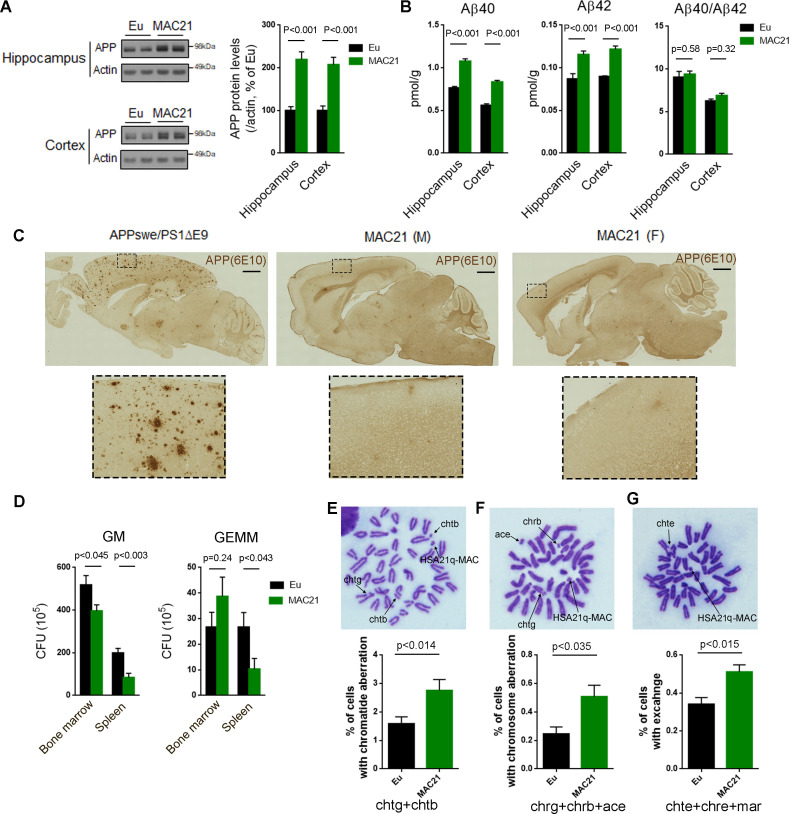
Verification
Claims the paper makes
The claims and statistics of this paper haven’t been checked yet.
Run the check — free, no account needed. It reads the open-access text and checks the sources it cites.
Claims other papers make about this one
Each is checked against this paper’s own text: does it say what the citing paper says it does?
The source backs part of the claim, not all of it — or backs it for a different population, condition or comparison.
In the citing paper
“Similar to human and Ts65Dn data, in MAC21 the cerebellum is decreased in volume compared to euploid at 4–5 months of age. However, there is no change in hippocampal volume and total brain volume is significantly larger in the trisomic mice.”
From Neurodevelopment in Down syndrome: Concordance in humans and models (2022) · cites this paper as Kazuki et al., 2020
Experimental — accuracy not yet measuredThe source backs part of the claim, not all of it — or backs it for a different population, condition or comparison.
In the citing paper
“MAC21, though not well characterized, appears to have an increase in brain volume, the opposite of what is observed in humans.”
From Neurodevelopment in Down syndrome: Concordance in humans and models (2022) · cites this paper as Kazuki et al., 2020
Experimental — accuracy not yet measuredThe cited source says what the claim attributes to it.
In the citing paper
“In addition to modeling the genetics of DS, they also show some of the same behavioral deficits in learning and memory.”
From Neurodevelopment in Down syndrome: Concordance in humans and models (2022) · cites this paper as Kazuki et al., 2020
The cited source says what the claim attributes to it.
In the citing paper
“The transchromosomic mouse model, MAC21, has undergone preliminary characterization and recapitulates some of the phenotypes described in individuals with DS (Kazuki et al., 2020).”
From Neurodevelopment in Down syndrome: Concordance in humans and models (2022) · cites this paper as Kazuki et al., 2020
The cited source says what the claim attributes to it.
In the citing paper
“Like Dp1Tyb/Dp(16)1Yey, they appear to recapitulate some of the non-neuronal phenotypes associated with DS such as skeletal changes and cardiovascular abnormalities.”
From Neurodevelopment in Down syndrome: Concordance in humans and models (2022) · cites this paper as Kazuki et al., 2020
Self-check
Percentages, sums and reported differences re-computed from the paper’s own numbers.
The self-check needs the paper’s full text.
Citations
Cites
ISCN 1995 An international system for human cytogenetic nomenclature
Mitelman, F. (1995) · Cited by 1,930
The DNA sequence of human chromosome 21
Hattori, M., Fujiyama, A., Taylor, T. D., Watanabe, H., Yada, T., Park, H.-S., Toyoda, A., Ishii, K., Totoki, Y., Choi, D., et al. (2000) · Nature · doi:10.1038/35012518 · Cited by 1,475
Antonarakis, S. E., Skotko, B. G., Rafii, M. S., Strydom, A., Pape, S. E., Bianchi, D. W., Sherman, S. L., & Reeves, R. H. (2020) · Nature Reviews Disease Primers · doi:10.1038/s41572-019-0143-7 · Cited by 964
Self-citationA mouse model for Down syndrome exhibits learning and behaviour deficits
Reeves, R. H., Irving, N. G., Moran, T. H., Wohn, A., Kitt, C., Sisodia, S. S., Schmidt, C., Bronson, R. T., & Davisson, M. T. (1995) · Nature Genetics · doi:10.1038/ng1095-177 · Cited by 913
Self-citationDown syndrome phenotypes: the consequences of chromosomal imbalance.
Korenberg, J. R., Chen, X. N., Schipper, R. D., Sun, Z., Gonsky, R., Gerwehr, S., Carpenter, N. J., Däumer, C., Dignan, P. S. J., & Distèche, C. M. (1994) · Proceedings of the National Academy of Sciences · doi:10.1073/pnas.91.11.4997 · Cited by 784
Kleschevnikov, A. M., Belichenko, P. V., Villar, A. J., Epstein, C. J., Malenka, R. C., & Mobley, W. C. (2004) · The Journal of Neuroscience · doi:10.1523/jneurosci.1766-04.2004 · Cited by 459
An Aneuploid Mouse Strain Carrying Human Chromosome 21 with down Syndrome Phenotypes.
O'Doherty, A., Ruf, S., Mulligan, C., Hildreth, V., Errington, M. L., Cooke, S., Sesay, A., Modino, S., Vanes, L., Hernandez, D., et al. (2005) · Science · doi:10.1126/science.1114535 · Cited by 434
Molecular mapping of alzheimer‐type dementia in Down's syndrome
Prasher, V. P., Farrer, M. J., Kessling, A. M., Fisher, E. M. C., West, R. J., Barber, P. C., & Butler, A. C. (1998) · Annals of Neurology · doi:10.1002/ana.410430316 · Cited by 414
Sleegers, K., Brouwers, N., Gijselinck, I., Theuns, J., Goossens, D., Wauters, J., Del‐Favero, J., Cruts, M., van Duijn, C. M., & Broeckhoven, C. V. (2006) · Brain · doi:10.1093/brain/awl203 · Cited by 406
(1990) · PubMed · Cited by 351
The Consequences of Chromosome Imbalance
Epstein, C. J. (1986) · Cambridge University Press eBooks · doi:10.1017/cbo9780511529702 · Cited by 309
Hippocampal cytotoxic lesion effects on species-typical behaviours in mice
Deacon, R. M. J., Croucher, A. P., & Rawlins, J. N. P. (2002) · Behavioural Brain Research · doi:10.1016/s0166-4328(01)00401-6 · Cited by 307
(1993) · PubMed · Cited by 301
Self-citationDiscovery and genetic localization of down syndrome cerebellar phenotypes using the Ts65Dn mouse
Baxter, L. L. (2000) · Human Molecular Genetics · doi:10.1093/hmg/9.2.195 · Cited by 275
Functional expression and germline atransmission of a human chromosome fragment in chimaeric mice
Tomizuka, K., Yoshida, H., Uejima, H., Kugoh, H., Sato, K., Ohguma, A., Hayasaka, M., Hanaoka, K., Oshimura, M., & Ishida, I. (1997) · Nature Genetics · doi:10.1038/ng0697-133 · Cited by 267
Self-citationParallels of craniofacial maldevelopment in down syndrome and Ts65Dn mice
Richtsmeier, J. T., Baxter, L. L., & Reeves, R. H. (2000) · Developmental Dynamics · doi:10.1002/(sici)1097-0177(200002)217:2 · Cited by 260
Self-citationA mouse model of Down syndrome trisomic for all human chromosome 21 syntenic regions
Yu, T., Li, Z., Jia, Z., Clapcote, S. J., Liu, C., Li, S., Asrar, S., Pao, A., Chen, R., Fan, N., et al. (2010) · Human Molecular Genetics · doi:10.1093/hmg/ddq179 · Cited by 248
Prenatal Screening for Aneuploidy
Driscoll, D. A., & Gross, S. J. (2009) · New England Journal of Medicine · doi:10.1056/nejmcp0900134 · Cited by 240
Understanding the Basis for Down Syndrome Phenotypes
Roper, R. J., & Reeves, R. H. (2006) · PLoS Genetics · doi:10.1371/journal.pgen.0020050 · Cited by 233
Self-citationDeLorey, T. M., Sahbaie, P., Hashemi, E., Homanics, G. E., & Clark, J. D. (2007) · Behavioural Brain Research · doi:10.1016/j.bbr.2007.09.009 · Cited by 225
Duchon, A., Raveau, M., Chevalier, C., Nalesso, V., Sharp, A. J., & Herault, Y. (2011) · Mammalian Genome · doi:10.1007/s00335-011-9356-0 · Cited by 224
Altered long-term potentiation in the young and old Ts65Dn mouse, a model for down syndrome
Siarey, R. J., Stoll, J., Rapoport, S. I., & Galdzicki, Z. (1997) · Neuropharmacology · doi:10.1016/s0028-3908(97)00157-3 · Cited by 222
Gardiner, K., Fortna, A., Bechtel, L. J., & Davisson, M. T. (2003) · Gene · doi:10.1016/s0378-1119(03)00769-8 · Cited by 207
Molecular characterization of the translocation breakpoints in the down syndrome mouse model Ts65Dn
Reinholdt, L. G., Ding, Y., Gilbert, G. T., Czechanski, A., Solzak, J. P., Roper, R. J., Johnson, M. T., Donahue, L. R., Lutz, C., & Davisson, M. T. (2011) · Mammalian Genome · doi:10.1007/s00335-011-9357-z · Cited by 186
Mouse models of Down syndrome: gene content and consequences
Gupta, M., Dhanasekaran, A. R., & Gardiner, K. (2016) · Mammalian Genome · doi:10.1007/s00335-016-9661-8 · Cited by 178
Braudeau, J., Delatour, B., Duchon, A., Pereira, P. L., Dauphinot, L., de Chaumont, F., Olivo‐Marín, J., Dodd, R. H., Hérault, Y., & Potier, M. (2011) · Journal of Psychopharmacology · doi:10.1177/0269881111405366 · Cited by 172
Olson, L. E., Roper, R. J., Baxter, L. L., Carlson, E. J., Epstein, C. J., & Reeves, R. H. (2004) · Developmental Dynamics · doi:10.1002/dvdy.20079 · Cited by 165
Self-citationRestoration of Norepinephrine-Modulated Contextual Memory in a Mouse Model of Down Syndrome
Salehi, A., Faizi, M., Colas, D., Valletta, J. S., Laguna, J., Takimoto‐Kimura, R., Kleschevnikov, A. M., Wagner, S. L., Aisen, P. S. S., Shamloo, M., et al. (2009) · Science Translational Medicine · doi:10.1126/scitranslmed.3000258 · Cited by 161
Cerebellar Volume in Adults With Down Syndrome
Aylward, E., Habbak, R., Warren, A. C., Pulsifer, M. B., Barta, P. E., Jerram, M. W., & Pearlson, G. D. (1997) · Archives of Neurology · doi:10.1001/archneur.1997.00550140077016 · Cited by 147
Faizi, M., Bader, P. L., Tun, C., Encarnacion, A., Kleschevnikov, A. M., Belichenko, P. V., Saw, N. L., Priestley, M., Tsien, R. W., Mobley, W. C., et al. (2011) · Neurobiology of Disease · doi:10.1016/j.nbd.2011.04.011 · Cited by 141
Shinohara, T. (2001) · Human Molecular Genetics · doi:10.1093/hmg/10.11.1163 · Cited by 118
Genomic Instability Within Centromeres of Interspecific Marsupial Hybrids
Metcalfe, C. J., Bulazel, K. V., Ferreri, G. C., Schroeder-Reiter, E., Wanner, G., Rens, W., Obergfell, C. J., Eldridge, M. D. B., & O'Neill, R. J. W. (2007) · Genetics · doi:10.1534/genetics.107.082313 · Cited by 116
Ishihara, K., Amano, K., Takaki, E., Shimohata, A., Sago, H., Epstein, C. J., & Yamakawa, K. (2009) · Cerebral Cortex · doi:10.1093/cercor/bhp176 · Cited by 113
Refined human artificial chromosome vectors for gene therapy and animal transgenesis
Kazuki, Y., Hoshiya, H., Takiguchi, M., Abe, S., Iida, Y., Osaki, M., Katoh, M., Hiratsuka, M., Shirayoshi, Y., Hiramatsu, K., et al. (2010) · Gene Therapy · doi:10.1038/gt.2010.147 · Cited by 112
Self-citationLana‐Elola, E., Watson-Scales, S., Slender, A., Gibbins, D., Martineau, A., Douglas, C., Mohun, T. J., Fisher, E., & Tybulewicz, V. L. J. (2016) · eLife · doi:10.7554/elife.11614 · Cited by 111
Hoshiya, H., Kazuki, Y., Abe, S., Takiguchi, M., Kajitani, N., Watanabe, Y., Yoshino, T., Shirayoshi, Y., Higaki, K., Messina, G., et al. (2008) · Molecular Therapy · doi:10.1038/mt.2008.253 · Cited by 109
Self-citationAneuploidy Causes Non-genetic Individuality
Beach, R. R., Ricci-Tam, C., Brennan, C. M., Moomau, C. A., Hsu, P.-H., Hua, B., Silberman, R. E., Springer, M., & Amon, A. (2017) · Cell · doi:10.1016/j.cell.2017.03.021 · Cited by 109
Gribble, S. M., Wiseman, F. K., Clayton, S., Prigmore, E., Langley, E., Yang, F., Maguire, S., Fu, B., Rajan, D., Sheppard, O., et al. (2013) · PLoS ONE · doi:10.1371/journal.pone.0060482 · Cited by 102
Gallagher, J. J., Minogue, A. M., & Lynch, M. A. (2012) · Neurodegenerative Diseases · doi:10.1159/000337458 · Cited by 99
Zhang, J., Peng, Q., Li, Q., Jahanshad, N., Hou, Z., Jiang, M., Masuda, N., Langbehn, D. R., Miller, M. I., Mori, S., et al. (2009) · NeuroImage · doi:10.1016/j.neuroimage.2009.10.027 · Cited by 94
An improved method for preparing G-banded chromosomes from mouse peripheral blood
Davisson, M. T., & Akeson, E. C. (2008) · Cytogenetics and Cell Genetics · doi:10.1159/000132432 · Cited by 74
International standing committee on human cytogenetic nomenclature
Mitelman, F. (1996) · Cancer Genetics and Cytogenetics · doi:10.1016/s0165-4608(96)90076-x · Cited by 73
Li, H., Cherry, S. M., Klinedinst, D. K., DeLeon, V. B., Redig, J. K., Reshey, B., Chin, M. T., Sherman, S. L., Maslen, C. L., & Reeves, R. H. (2012) · Circulation Cardiovascular Genetics · doi:10.1161/circgenetics.111.960872 · Cited by 73
Self-citationA Novel and Stable Mouse Artificial Chromosome Vector
Takiguchi, M., Kazuki, Y., Hiramatsu, K., Abe, S., Iida, Y., Takehara, S., Nishida, T., Ohbayashi, T., Wakayama, T., & Oshimura, M. (2012) · ACS Synthetic Biology · doi:10.1021/sb3000723 · Cited by 73
Self-citationSize and shape analysis of landmark data
Dryden, I. L., & Mardia, K. V. (1992) · Biometrika · doi:10.1093/biomet/79.1.57 · Cited by 70
Body Composition and BMI Growth Charts in Children With Down Syndrome
Hatch-Stein, J. A., Zemel, B. S., Prasad, D., Kalkwarf, H. J., Pipan, M. E., Magge, S. N., & Kelly, A. T. (2016) · PEDIATRICS · doi:10.1542/peds.2016-0541 · Cited by 61
Survival of children with mosaic Down syndrome
Shin, M., Siffel, C., & Correa, A. (2010) · American Journal of Medical Genetics Part A · doi:10.1002/ajmg.a.33295 · Cited by 60
Down's syndrome-like cardiac developmental defects in embryos of the transchromosomic Tc1 mouse
Dunlevy, L. P. E., Bennett, M. W., Slender, A., Lana‐Elola, E., Tybulewicz, V. L. J., Fisher, E., & Mohun, T. J. (2010) · Cardiovascular Research · doi:10.1093/cvr/cvq193 · Cited by 58
Characterization of the cardiac phenotype in neonatal Ts65Dn mice
Williams, A. D., Mjaatvedt, C. H., & Moore, C. S. (2007) · Developmental Dynamics · doi:10.1002/dvdy.21416 · Cited by 57
Chromosomal radiosensitivity in Down's syndrome.
Ms, S., & Tonomura, A. (1969) · PubMed · Cited by 57
Birger, Y., Goldberg, L., Chlon, T. M., Goldenson, B., Muler, I., Schiby, G., Jacob–Hirsch, J., Rechavi, G., Crispino, J. D., & Izraeli, S. (2013) · Blood · doi:10.1182/blood-2012-10-460998 · Cited by 56
Kolb, B. E., & Whishaw, I. Q. (1985) · Behavioral Neuroscience · doi:10.1037//0735-7044.99.4.691 · Cited by 55
Hart, S. J., Visootsak, J., Tamburri, P., Phuong, P., Baumer, N., Hernandez, M., Skotko, B. G., Ochoa‐Lubinoff, C., Liogier D'Ardhuy, X., Kishnani, P. S., et al. (2017) · American Journal of Medical Genetics Part A · doi:10.1002/ajmg.a.38465 · Cited by 54
Modeling an Anti-Amyloid Combination Therapy for Alzheimer’s Disease
Chow, V. W., Savonenko, A. V., Melnikova, T., Kim, H., Price, D. L., Li, T., & Wong, P. C. (2010) · Science Translational Medicine · doi:10.1126/scitranslmed.3000337 · Cited by 53
Self-citationGenetic analysis of Down syndrome-associated heart defects in mice
Liu, C., Morishima, M., Yu, T., Matsui, S., Zhang, L., Fu, D., Pao, A., Costa, A. C. S., Gardiner, K., Cowell, J. K., et al. (2011) · Human Genetics · doi:10.1007/s00439-011-0980-2 · Cited by 52
Stability of transferred human chromosome fragments in cultured cells and in mice
Shinohara, T., Tomizuka, K., Takehara, S., Yamauchi, K., Katoh, M., Ohguma, A., Ishida, I., & Oshimura, M. (2000) · Chromosome Research · doi:10.1023/a:1026741321193 · Cited by 51
Self-citationStarbuck, J. M., Dutka, T., Ratliff, T. S., Reeves, R. H., & Richtsmeier, J. T. (2014) · American Journal of Medical Genetics Part A · doi:10.1002/ajmg.a.36594 · Cited by 50
Self-citationLi, H., Edie, S., Klinedinst, D. K., Jeong, J. S., Blackshaw, S., Maslen, C. L., & Reeves, R. H. (2016) · Genetics · doi:10.1534/genetics.116.188045 · Cited by 45
Self-citationDissecting Alzheimer disease in Down syndrome using mouse models
Choong, X. Y., Tosh, J., Pulford, L. J., & Fisher, E. (2015) · Frontiers in Behavioral Neuroscience · doi:10.3389/fnbeh.2015.00268 · Cited by 41
Humanized UGT2 and CYP3A transchromosomic rats for improved prediction of human drug metabolism
Kazuki, Y., Kobayashi, K., Hirabayashi, M., Abe, S., Kajitani, N., Kazuki, K., Takehara, S., Takiguchi, M., Satoh, D., Kuze, J., et al. (2019) · Proceedings of the National Academy of Sciences · doi:10.1073/pnas.1808255116 · Cited by 38
Self-citationHighly stable maintenance of a mouse artificial chromosome in human cells and mice
Kazuki, K., Takehara, S., Uno, N., Imaoka, N., Abe, S., Takiguchi, M., Hiramatsu, K., Oshimura, M., & Kazuki, Y. (2013) · Biochemical and Biophysical Research Communications · doi:10.1016/j.bbrc.2013.10.171 · Cited by 38
Self-citationInoue, J., Mitsuya, K., Maegawa, S., Kugoh, H., Kadota, M., Okamura, D., Shinohara, T., Nishihara, S., Takehara, S., Yamauchi, K., et al. (2001) · Journal of Human Genetics · doi:10.1007/s100380170101 · Cited by 37
Self-citationNonaka, M., Fitzpatrick, R., Lapira, J., Wheeler, D. G., Spooner, P. A., Parada, M. C., Muñoz, M., Tully, T., Peters, M., & Morris, R. (2017) · European Journal of Neuroscience · doi:10.1111/ejn.13637 · Cited by 36
Brain ventriculomegaly in Down syndrome mice is caused by Pcp4 dose-dependent cilia dysfunction.
Raveau, M., Nakahari, T., Asada, S., Ishihara, K., Amano, K., Shimohata, A., Sago, H., & Yamakawa, K. (2017) · Human Molecular Genetics · doi:10.1093/hmg/ddx007 · Cited by 35
Kolb, B. E., & Whishaw, I. Q. (1985) · Behavioral Neuroscience · doi:10.1037/0735-7044.99.4.691 · Cited by 35
Centrosomes are multifunctional regulators of genome stability
Lerit, D. A., & Poulton, J. S. (2015) · Chromosome Research · doi:10.1007/s10577-015-9506-4 · Cited by 33
Hematopoietic disorders in Down syndrome.
Choi, J. K. (2008) · PubMed Central · Cited by 33
Morphological integration of soft-tissue facial morphology in down syndrome and siblings
Starbuck, J. M., Reeves, R. H., & Richtsmeier, J. T. (2011) · American Journal of Physical Anthropology · doi:10.1002/ajpa.21583 · Cited by 30
Self-citationCytogenetic Evaluation of Down Syndrome: A Review of 1020 Referral Cases
Chandra, N., Cyrus, C., Lakshminarayana, P., Nallasivam, P., Ramesh, A., Gopinath, P. M., & Marimuthu, K. M. (2010) · International Journal of Human Genetics · doi:10.1080/09723757.2010.11886090 · Cited by 29
Increased male reproductive success in Ts65Dn “Down syndrome” mice
Moore, C. S., Hawkins, C. E., Franca, A., Lawler, A. M., Devenney, B., Das, I., & Reeves, R. H. (2010) · Mammalian Genome · doi:10.1007/s00335-010-9300-8 · Cited by 28
Self-citationPolk, R. C., Gergics, P., Steimle, J. D., Li, H., Moskowitz, I. P. G., Camper, S. A., & Reeves, R. H. (2015) · BMC Developmental Biology · doi:10.1186/s12861-015-0080-y · Cited by 17
Self-citationDutka, T., Hallberg, D. L., & Reeves, R. H. (2014) · Mechanisms of Development · doi:10.1016/j.mod.2014.11.004 · Cited by 15
Self-citationHematopoietic Stem Cells from Ts65Dn Mice Are Deficient in the Repair of DNA Double-Strand Breaks
Wang, Y., Chang, J., Shao, L., Feng, W., Luo, Y., Chow, M., Du, W., Meng, A., & Zhou, D. (2016) · Radiation Research · doi:10.1667/rr14407.1 · Cited by 13
Brose, R. D., Savonenko, A. V., Devenney, B., Smith, K. D., & Reeves, R. H. (2019) · Frontiers in Aging Neuroscience · doi:10.3389/fnagi.2019.00096 · Cited by 11
Self-citationFernandez, F., & Reeves, R. H. (2015) · Handbook of experimental pharmacology · doi:10.1007/978-3-319-16522-6_12 · Cited by 11
Self-citationSingh, N., Dutka, T., Reeves, R. H., & Richtsmeier, J. T. (2015) · Developmental Dynamics · doi:10.1002/dvdy.24361 · Cited by 10
Self-citationPrasher, V. P. (1995) · Down Syndrome Research and Practice · doi:10.3104/reports.45 · Cited by 4
Research works printed but not linked: 1
- Besson V. 2005. Studying dosage effects for human chromosome 21 homologous genes using chromosomal engineering in the mouse. 19th International Mouse Genome Conference.
Cited by
Sorted by citations
The brain and its time: intrinsic neural timescales are key for input processing
Golesorkhi, M., Gomez-Pilar, J., Zilio, F., Berberian, N., Wolff, A., Yagoub, M. C. E., & Northoff, G. (2021) · Communications Biology · doi:10.1038/s42003-021-02483-6 · Cited by 198
Aneuploidy as a promoter and suppressor of malignant growth
Vasudevan, A., Schukken, K. M., Sausville, E. L., Girish, V., Adebambo, O. A., & Sheltzer, J. M. (2021) · Nature reviews. Cancer · doi:10.1038/s41568-020-00321-1 · Cited by 176
Telomere Replication: Solving Multiple End Replication Problems
Bonnell, E., Pasquier, E., & Wellinger, R. J. (2021) · Frontiers in Cell and Developmental Biology · doi:10.3389/fcell.2021.668171 · Cited by 113
Access to antivenoms in the developing world: A multidisciplinary analysis
Potet, J., Beran, D., Ray, N., Alcoba, G., Habib, A. G., Iliyasu, G., Waldmann, B., Ralph, R., Faiz, M. A., Monteiro, W. M., et al. (2021) · Toxicon X · doi:10.1016/j.toxcx.2021.100086 · Cited by 103
Ts66Yah, a mouse model of down syndrome with improved construct and face validity
Duchon, A., del Mar Muñiz Moreno, M., Chevalier, C., Nalesso, V., Andre, P., Fructuoso-Castellar, M., Mondino, M., Po, C., Noblet, V., Birling, M.-C., et al. (2022) · Disease Models & Mechanisms · doi:10.1242/dmm.049721 · Cited by 58
Metadata
- Authors
- Kazuki, Y., Gao, F. J., Li, Y., Moyer, A. J., Devenney, B., Hiramatsu, K., Miyagawa-Tomita, S., Abe, S., Kazuki, K., Kajitani, N., Uno, N., Takehara, S., Takiguchi, M., Yamakawa, M., Hasegawa, A., Shimizu, R., Matsukura, S., Noda, N., Ogonuki, N., Inoue, K., Matoba, S., Ogura, A., Florea, L. D., Savonenko, A., Xiao, M., Wu, D., Batista, D. A., Yang, J., Qiu, Z., Singh, N., Richtsmeier, J. T., Takeuchi, T., Oshimura, M., & Reeves, R. H.
- Affiliations
- Chromosome Engineering Research Center (JP)
- Johns Hopkins University (US)
- Tottori University (JP)
- Department of Animal Nursing Science, Yamazaki University of Animal Health Technology, Hachioji, Tokyo, Japan
- Tohoku University (JP)
- National Institute of Advanced Industrial Science and Technology (JP)
- RIKEN BioResource Research Center (JP)
- Department of Neuroscience, John Hopkins University School of Medicine, Baltimore, United States
- Zhejiang University (CN)
- Pennsylvania State University (US)
- California State University, Sacramento (US)
- Corresponding author
- Kazuki, Yasuhiro
- Reeves, Roger H
- ORCID
- Kazuki, Yasuhiro
- Gao, Feng J
- Li, Yicong
- Moyer, Anna J
- Devenney, Benjamin
- Abe, Satoshi
- Kazuki, Kanako
- Uno, Narumi
- Yamakawa, Miho
- Hasegawa, Atsushi
- Shimizu, Ritsuko
- Matsukura, Satoko
- Noda, Naohiro
- Inoue, Kimiko
- Matoba, Shogo
- Ogura, Atsuo
- Florea, Liliana D
- Savonenko, Alena
- Wu, Dan
- Batista, Denise AS
- Yang, Junhua
- Qiu, Zhaozhu
- Singh, Nandini
- Richtsmeier, Joan T
- Takeuchi, Takashi
- Reeves, Roger H
- Venue
- eLife
- Publisher
- eLife Sciences Publications, Ltd
- Published
- 2020-06-29
- Volume
- 9
- ISSN
- 2050-084X (ISSN-L)
- PMC
- PMC7358007
- OpenAlex
- W3037987616
- Cited by
- 125
- References
- 77
- Citations by year
- 2026: 17 · 2025: 20 · 2024: 18 · 2023: 19 · 2022: 23 · 2021: 22 · 2020: 6
- FWCI
- 14.25
- Type
- journal article
- Language
- en
- Open access
- gold
- doi.org
- Licence
- Locations
- eLife (publishedVersion, cc-by)
- PubMed Central (publishedVersion, cc-by)
- PubMed (publishedVersion)
- DOAJ (DOAJ: Directory of Open Access Journals) (submittedVersion, cc-by-sa)
- Funders
- Eunice Kennedy Shriver National Institute of Child Health and Human Development (R21HD098540-01, R01HD038384)
- Japan Society for the Promotion of Science (25221308)
- Core Research for Evolutional Science and Technology (JPMJCR18S4)
- Topics
- Health Sciences › Medicine › Public Health, Environmental and Occupational Health › Down syndrome and intellectual disability research
- Life Sciences › Biochemistry, Genetics and Molecular Biology › Genetics › Genomic variations and chromosomal abnormalities
- Life Sciences › Biochemistry, Genetics and Molecular Biology › Genetics › Genetic and Clinical Aspects of Sex Determination and Chromosomal Abnormalities
- Keywords
- Down syndrome, artificial chromosomes, microcell-mediated chromosome transfer, cardiac anomalies, craniofacial anomalies, brain anomalies, learning and memory impairment, synaptic plasticity, gene expression
- MeSH terms
- Whole Genome Sequencing, Animals, Brain, Chromosomes, Human, Pair 21, Disease Models, Animal, Down Syndrome, Female, Heart Defects, Congenital, Humans, Male, Mice, Inbred C57BL, Mice, Transgenic, Trisomy, Mice
About these checks
Registry, retraction, Cites and statistics results are computed, not judged, with one exception: a printed reference that no index lists is read once by a model before it counts as a citation error. Claims are extracted by a model and kept only when their quote appears verbatim in the text; each cited source is then checked, with a model’s help, for whether it says what the claim relies on. Those verdicts can be wrong — read the claim’s quote and the cited source before relying on one.
Statistics and arithmetic are recomputed, not judged.
Confidence bands are shown only for fields calibrated on our annotated test set. None is calibrated yet, so no band is shown.
What counts as a claim ›How we measure confidence ›How we check this ›
Are you an author, or do you see a problem with this page? Request a review
