Cited by 193Mosquito-borne diseases and controlClimate Change and Health ImpactsVector-borne infectious diseases

The DOI matches its Crossref record; 146 of the 149 references it cites were found in a registry or an index.

Transmission of West Nile and five other temperate mosquito-borne viruses peaks at temperatures between 23°C and 26°C

Open access

Abstract

The temperature-dependence of many important mosquito-borne diseases has never been quantified. These relationships are critical for understanding current distributions and predicting future shifts from climate change. We used trait-based models to characterize temperature-dependent transmission of 10 vector–pathogen pairs of mosquitoes ( Culex pipiens , Cx. quinquefascsiatus , Cx. tarsalis , and others) and viruses (West Nile, Eastern and Western Equine Encephalitis, St. Louis Encephalitis, Sindbis, and Rift Valley Fever viruses), most with substantial transmission in temperate regions. Transmission is optimized at intermediate temperatures (23–26°C) and often has wider thermal breadths (due to cooler lower thermal limits) compared to pathogens with predominately tropical distributions (in previous studies). The incidence of human West Nile virus cases across US counties responded unimodally to average summer temperature and peaked at 24°C, matching model-predicted optima (24–25°C). Climate warming will likely shift transmission of these diseases, increasing it in cooler locations while decreasing it in warmer locations.

Overview

The claims and statistics of this paper haven’t been checked yet.

Run the check — free, no account needed. It reads the open-access text and checks the sources it cites.

A few free checks a day · papers already verified open instantly · results are public

Integrity signals

Registry

Crossref · 10.7554/elife.58511

Cites

146 of 146 references verified0 citation errors · 0 not checkable

Statistics

Figures
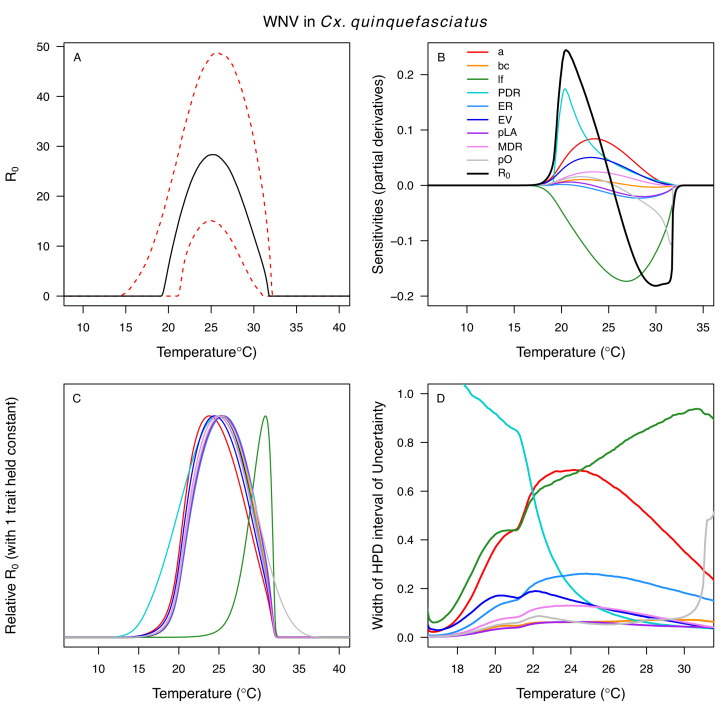
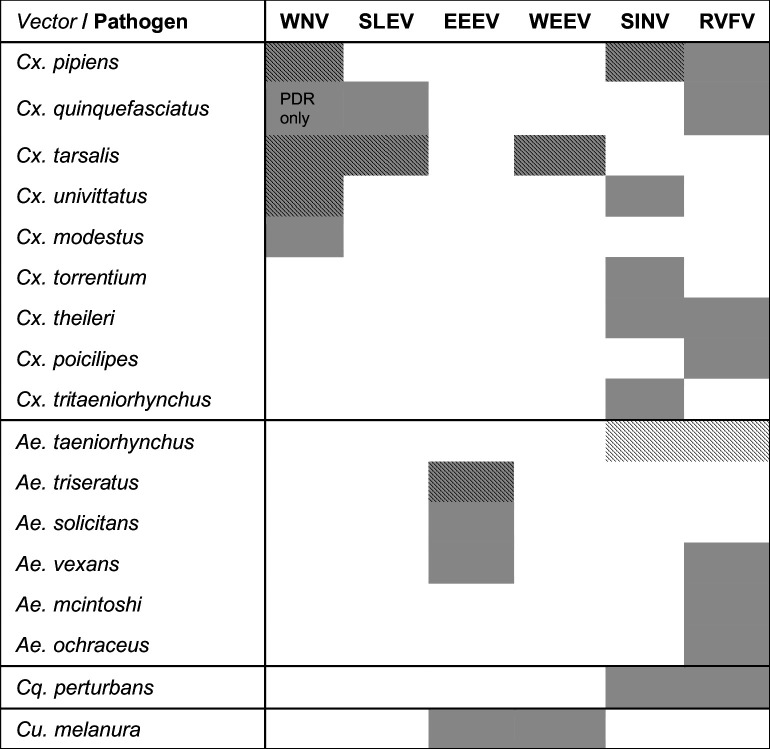
Figure 1. Viruses are transmitted by multiple vectors and vectors transmit multiple viruses; infection data are only available for a subset of important vector species. The six viruses in this study (WNV = West Nile virus, SLEV = St. Louis Encephalitis virus, EEEV = Eastern Equine Encephalitis virus, WEEV = Western Equine Encephalitis virus, SINV = Sindbis virus, RVFV = Rift Valley Fever virus) and the Culex (Cx.), Aedes (Ae.), Coquillettidia (Cq.), and Culiseta (Cs.) vectors that are most important for sustaining transmission to humans according to the following sources: (Adouchief et al., 2016; Braack et al., 2018; Golding et al., 2012; Linthicum et al., 2016; Sang et al., 2017; Weaver and Barrett, 2004). The importance of each vector for transmission varies over the geographic range of the virus, and this list of vectors is not exhaustive for any virus (see sources for more complete lists of confirmed and potential vectors). Grey shading indicates an important vector-virus pair; hatching indicates available temperature-dependent data for infection traits (pathogen development rate [PDR] and vector competence [bc], which is comprised of infection efficiency [c] and transmission efficiency [b]). Infection data were available for SINV and RVFV in Ae. taeniorhynchus, although this North American mosquito does not occur in the endemic range of these pathogens.
Figure 1. Viruses are transmitted by multiple vectors and vectors transmit multiple viruses; infection data are only available for a subset of important vector species. The six viruses in this study (WNV = West Nile virus, SLEV = St. Louis Encephalitis virus, EEEV = Eastern Equine Encephalitis virus, WEEV = Western Equine Encephalitis virus, SINV = Sindbis virus, RVFV = Rift Valley Fever virus) and the Culex (Cx.), Aedes (Ae.), Coquillettidia (Cq.), and Culiseta (Cs.) vectors that are most important for sustaining transmission to humans according to the following sources: (Adouchief et al., 2016; Braack et al., 2018; Golding et al., 2012; Linthicum et al., 2016; Sang et al., 2017; Weaver and Barrett, 2004). The importance of each vector for transmission varies over the geographic range of the virus, and this list of vectors is not exhaustive for any virus (see sources for more complete lists of confirmed and potential vectors). Grey shading indicates an important vector-virus pair; hatching indicates available temperature-dependent data for infection traits (pathogen development rate [PDR] and vector competence [bc], which is comprised of infection efficiency [c] and transmission efficiency [b]). Infection data were available for SINV and RVFV in Ae. taeniorhynchus, although this North American mosquito does not occur in the endemic range of these pathogens.CC BY · PubMed Central
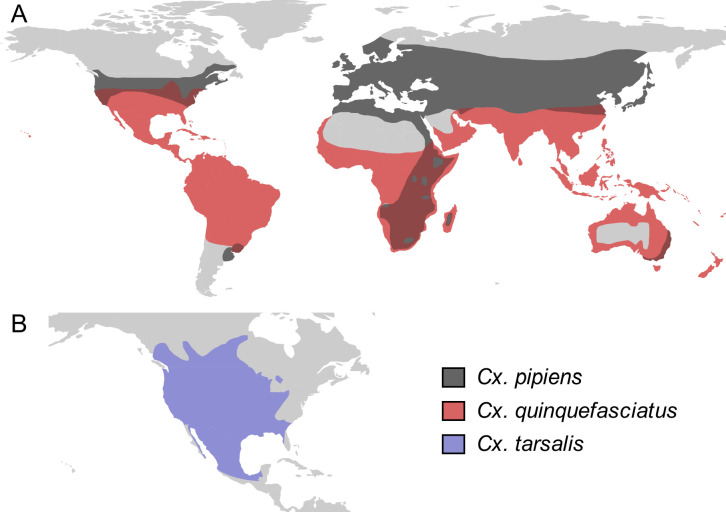
Figure 2. Culex spp. vectors of West Nile and other viruses have distinct but overlapping geographic distributions. The geographic distribution of the primary vectors of West Nile virus: (A) Culex pipiens (dark grey) and Cx. quinquefasciatus (red), adapted from Farajollahi et al., 2011; Smith and Fonseca, 2004; (B) Cx. tarsalis (blue), northern boundary from Darsie and Ward, 2016, southern boundary based on data from the Global Biodiversity Information Facility. Figure created by Michelle Evans for this paper.
Figure 2. Culex spp. vectors of West Nile and other viruses have distinct but overlapping geographic distributions. The geographic distribution of the primary vectors of West Nile virus: (A) Culex pipiens (dark grey) and Cx. quinquefasciatus (red), adapted from Farajollahi et al., 2011; Smith and Fonseca, 2004; (B) Cx. tarsalis (blue), northern boundary from Darsie and Ward, 2016, southern boundary based on data from the Global Biodiversity Information Facility. Figure created by Michelle Evans for this paper.CC BY · PubMed Central
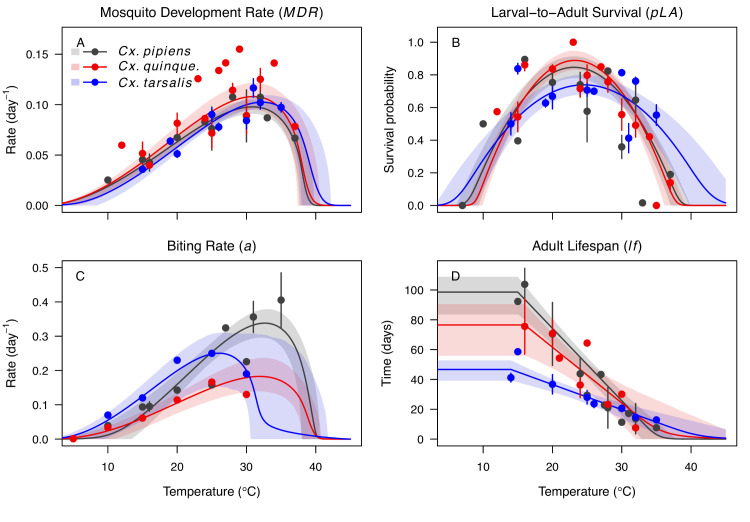
Figure 3. Culex spp. mosquito traits respond strongly and consistently to temperature. The thermal responses of mosquito traits for the North American vectors of West Nile virus: Culex pipiens (dark grey), Cx. quinquefasciatus (red), and Cx. tarsalis (blue). (A) Mosquito development rate (MDR), (B) larval-to-adult survival (pLA), (C) biting rate (a), and (D) adult lifespan (lf). Points without error bars are reported means from single studies; points with error bars are averages of means from multiple studies (+ / - standard error, for visual clarity only; thermal responses were fit to reported means, see Appendix 1—figures 2, 3, 4, 5). Solid lines are posterior means; shaded areas are 95% credible intervals of the trait mean. See Appendix 1—figure 1 for thermal responses for Aedes taeniorhynchus, Ae. triseriatus, Ae. vexans, and Culiseta melanura. The mean thermal responses for these traits were printed in Mordecai et al., 2019 (as part of Figure 3 in that paper) without the trait data and 95% CIs, and along with thermal responses for six other vectors. See Appendix 1—tables 2, 3, 6 for data sources and Appendix 1—tables 7, 8, 9 for priors.
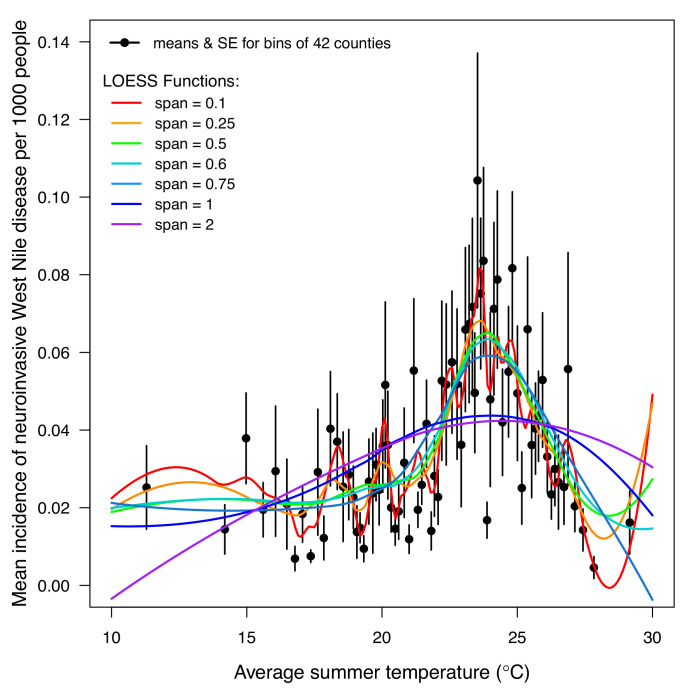
Figure 3. Culex spp. mosquito traits respond strongly and consistently to temperature. The thermal responses of mosquito traits for the North American vectors of West Nile virus: Culex pipiens (dark grey), Cx. quinquefasciatus (red), and Cx. tarsalis (blue). (A) Mosquito development rate (MDR), (B) larval-to-adult survival (pLA), (C) biting rate (a), and (D) adult lifespan (lf). Points without error bars are reported means from single studies; points with error bars are averages of means from multiple studies (+ / - standard error, for visual clarity only; thermal responses were fit to reported means, see Appendix 1—figures 2, 3, 4, 5). Solid lines are posterior means; shaded areas are 95% credible intervals of the trait mean. See Appendix 1—figure 1 for thermal responses for Aedes taeniorhynchus, Ae. triseriatus, Ae. vexans, and Culiseta melanura. The mean thermal responses for these traits were printed in Mordecai et al., 2019 (as part of Figure 3 in that paper) without the trait data and 95% CIs, and along with thermal responses for six other vectors. See Appendix 1—tables 2, 3, 6 for data sources and Appendix 1—tables 7, 8, 9 for priors.CC BY · PubMed Central
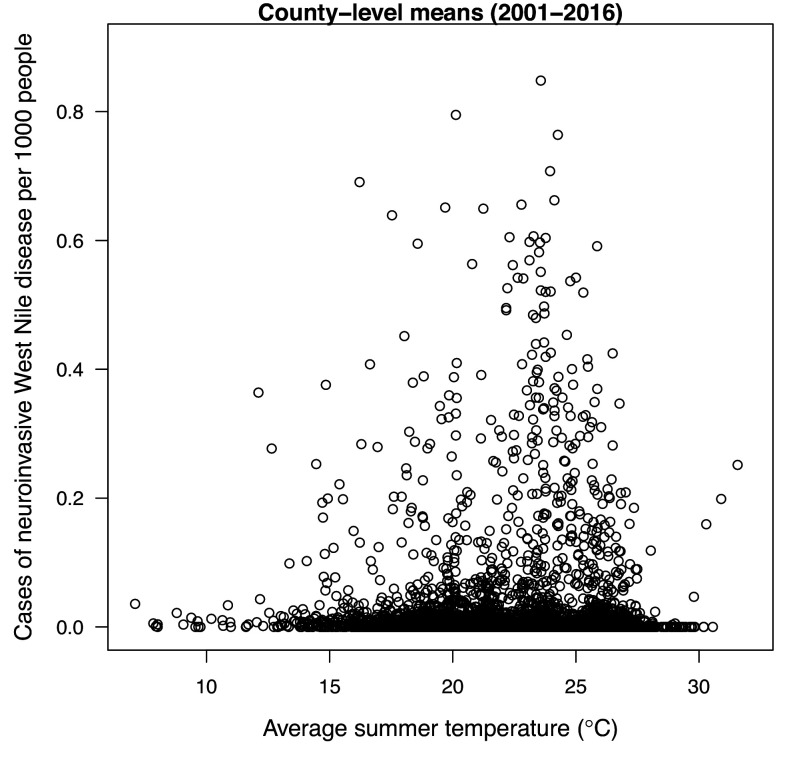
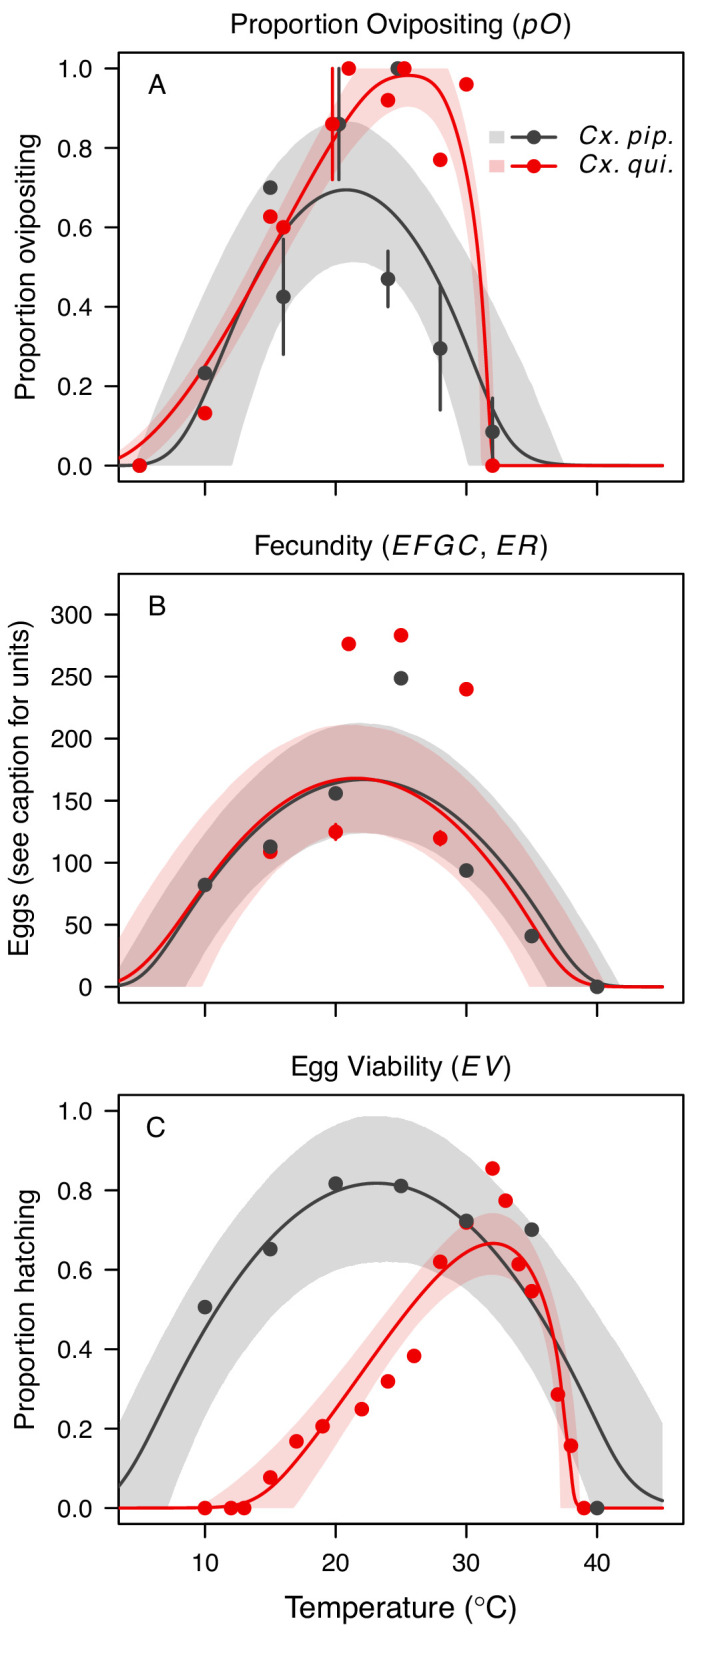
Figure 4. Culex pipiens and Cx. quinquefasciatus reproductive traits respond strongly to temperature but with different functional forms. The thermal responses of mosquito traits for the primary vectors of West Nile virus: Culex pipiens (dark grey) and Cx. quinquefasciatus (red). (A) Proportion ovipositing (pO), (B) fecundity (as eggs per female per gonotrophic cycle [EFGC] in Cx. pipiens, and eggs per raft, [ER] in Cx. quinequefasciatus), and (C) egg viability (EV). Points without error bars are reported means from single studies; points with error bars are averages of means from multiple studies (+ / - standard error, for visual clarity only; thermal responses were fit to reported means, see Appendix 1—figure 6). Solid lines are posterior distribution means; shaded areas are 95% credible intervals of the trait mean. See Appendix 1—figure 1 for thermal responses for Ae. vexans, Cx. theileri, and Culiseta melanura. The mean thermal responses for these traits were printed in Mordecai et al., 2019 (as part of Figure 3 in that paper) without the trait data and 95% CIs, and along with thermal responses for six other vectors. See Appendix 1—table 2 for data sources and Appendix 1—table 7 for priors.
Figure 4. Culex pipiens and Cx. quinquefasciatus reproductive traits respond strongly to temperature but with different functional forms. The thermal responses of mosquito traits for the primary vectors of West Nile virus: Culex pipiens (dark grey) and Cx. quinquefasciatus (red). (A) Proportion ovipositing (pO), (B) fecundity (as eggs per female per gonotrophic cycle [EFGC] in Cx. pipiens, and eggs per raft, [ER] in Cx. quinequefasciatus), and (C) egg viability (EV). Points without error bars are reported means from single studies; points with error bars are averages of means from multiple studies (+ / - standard error, for visual clarity only; thermal responses were fit to reported means, see Appendix 1—figure 6). Solid lines are posterior distribution means; shaded areas are 95% credible intervals of the trait mean. See Appendix 1—figure 1 for thermal responses for Ae. vexans, Cx. theileri, and Culiseta melanura. The mean thermal responses for these traits were printed in Mordecai et al., 2019 (as part of Figure 3 in that paper) without the trait data and 95% CIs, and along with thermal responses for six other vectors. See Appendix 1—table 2 for data sources and Appendix 1—table 7 for priors.CC BY · PubMed Central
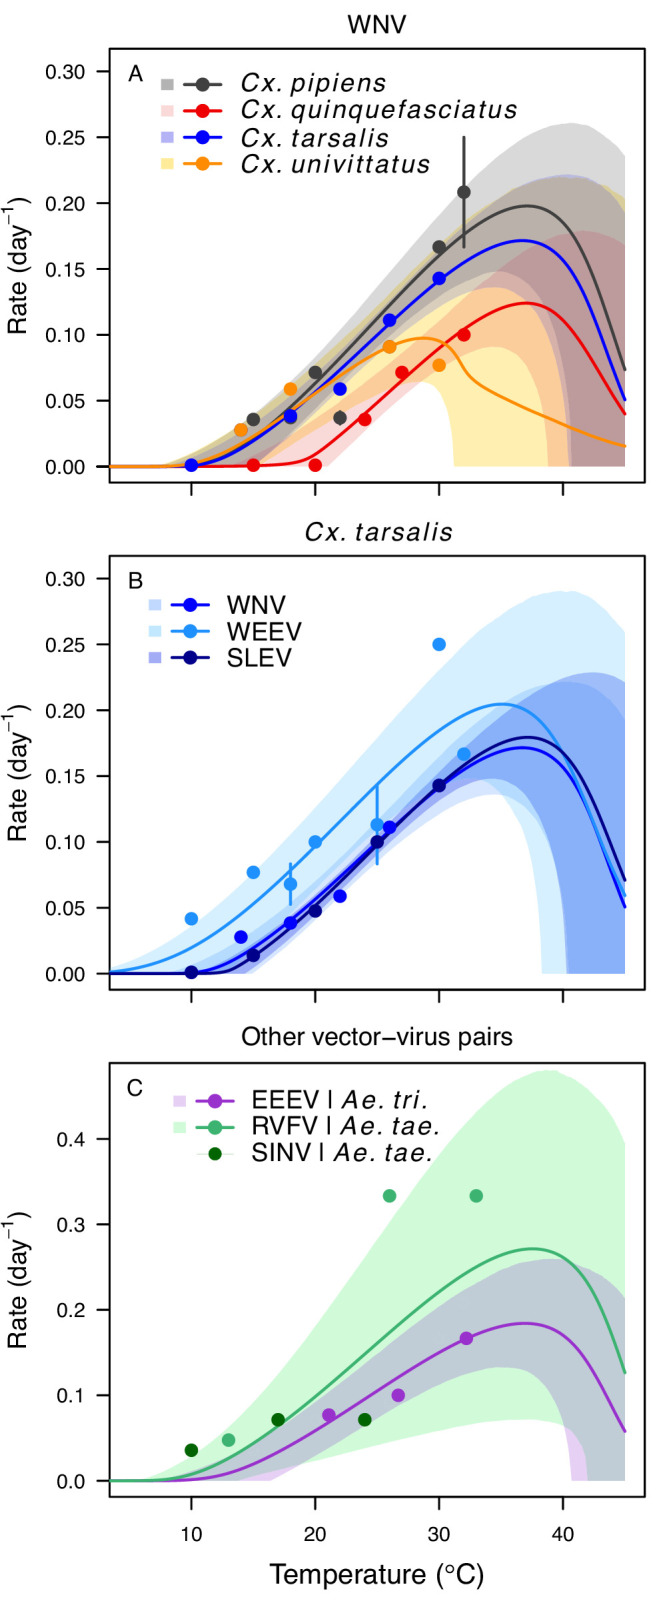
Figure 5. Pathogen development rates (PDR) have high thermal optima. Thermal responses of pathogen development rate (PDR). (A) West Nile virus in Culex pipiens (dark grey), Cx. quinquefasciatus (red), Cx. tarsalis (blue), and Cx. univitattus (orange). (B) Three viruses in Cx. tarsalis: West Nile virus (same as in A, blue), Western Equine Encephalitis virus (light blue), and St. Louis Encephalitis virus (dark blue). (C) Eastern Equine Encephalitis virus in Aedes triseriatus (violet), Rift Valley Fever virus in Ae. taeniorhynchus (light green), Sindbis virus in Ae. taeniorhynchus (dark green). We did not fit a thermal response for Sindbis virus in Ae. taeniorhynchus because the limited data responded weakly to temperature and did not match our priors. Points without error bars are reported means from single studies; points with error bars are averages of means from multiple studies (+ / - standard error, for visual clarity only; thermal responses were fit to reported means, see Appendix 1—figure 7). Solid lines are posterior distribution means; shaded areas are 95% credible intervals of the trait mean. The mean thermal responses for this trait were printed in Mordecai et al., 2019 (as part of Figure 4 in that paper) without the trait data and 95% CIs, combined into a single panel, and along with thermal responses for six other vector-pathogen pairs. See Appendix 1—table 5 for data sources and Appendix 1—table 8 for priors.
Figure 5. Pathogen development rates (PDR) have high thermal optima. Thermal responses of pathogen development rate (PDR). (A) West Nile virus in Culex pipiens (dark grey), Cx. quinquefasciatus (red), Cx. tarsalis (blue), and Cx. univitattus (orange). (B) Three viruses in Cx. tarsalis: West Nile virus (same as in A, blue), Western Equine Encephalitis virus (light blue), and St. Louis Encephalitis virus (dark blue). (C) Eastern Equine Encephalitis virus in Aedes triseriatus (violet), Rift Valley Fever virus in Ae. taeniorhynchus (light green), Sindbis virus in Ae. taeniorhynchus (dark green). We did not fit a thermal response for Sindbis virus in Ae. taeniorhynchus because the limited data responded weakly to temperature and did not match our priors. Points without error bars are reported means from single studies; points with error bars are averages of means from multiple studies (+ / - standard error, for visual clarity only; thermal responses were fit to reported means, see Appendix 1—figure 7). Solid lines are posterior distribution means; shaded areas are 95% credible intervals of the trait mean. The mean thermal responses for this trait were printed in Mordecai et al., 2019 (as part of Figure 4 in that paper) without the trait data and 95% CIs, combined into a single panel, and along with thermal responses for six other vector-pathogen pairs. See Appendix 1—table 5 for data sources and Appendix 1—table 8 for priors.CC BY · PubMed Central
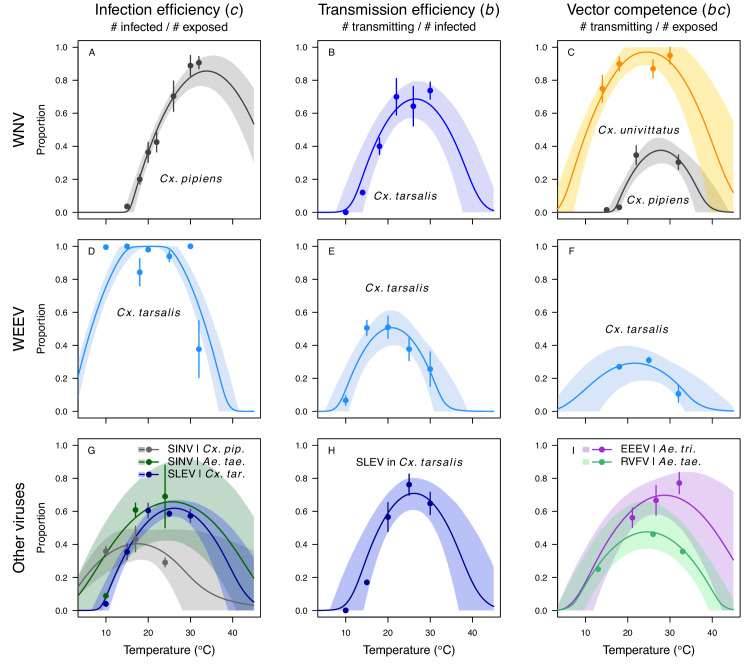
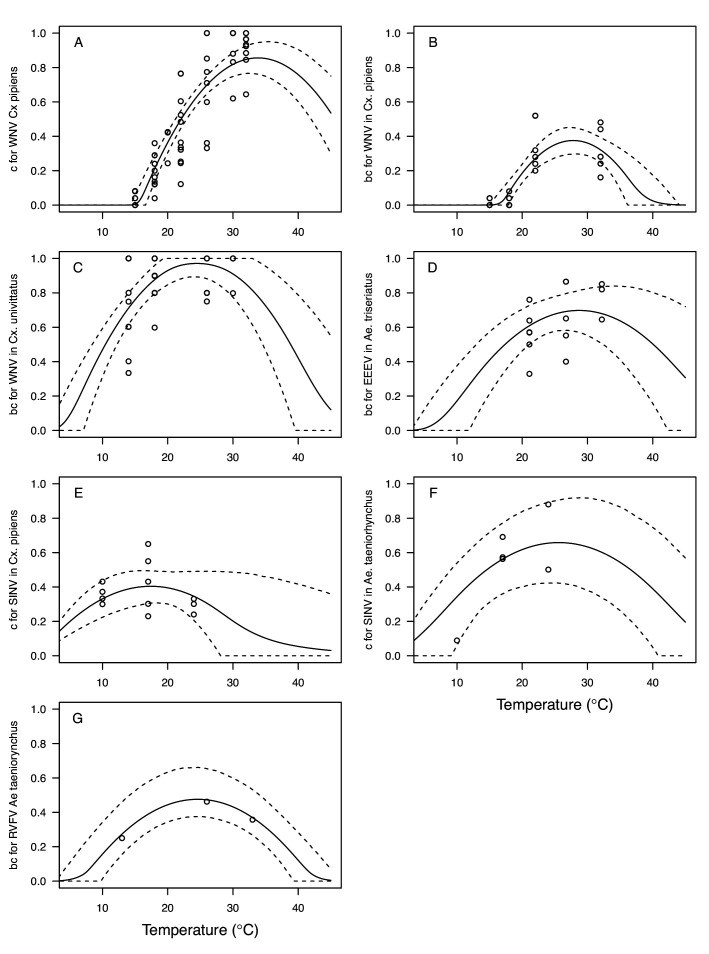
Figure 6. Vector competence (bc) and its component traits—infection efficiency (c) and transmission efficiency (b) respond strongly to temperature and vary across vector and virus species. Thermal responses of infection efficiency (c, # infected / # exposed; first column), transmission efficiency (b, # transmitting / # infected; second column) or vector competence (bc, # infected / # exposed; third column) for vector–virus pairs. First row (A,B,C): West Nile virus in Culex pipiens (dark grey), Cx. tarsalis (blue), and Cx. univitattus (yellow/orange). Second row: (D,E,F) Western Equine Encephalitis virus in Cx. tarsalis (light blue). Third row (G,H,I): Sindbis virus in Aedes taeniorhynchus (dark green), Sindbis virus in Cx. pipiens (light gray), St. Louis Encephalitis virus in Cx. tarsalis (dark blue), Eastern Equine Encephalitis virus in Ae. triseriatus (violet), and Rift Valley Fever virus in Ae. taeniorhynchus (light green). Points are means of replicates from single or multiple studies (+ / - standard error, for visual clarity only; thermal responses were fit to replicate-level data, see Appendix 1—figures 8 and 9). Solid lines are posterior distribution means; shaded areas are 95% credible intervals of the trait mean. The mean thermal responses for these traits were printed in Mordecai et al., 2019 (as part of Figure 4 in that paper) without the trait data and 95% CIs, combined into fewer panels, and along with thermal responses for six other vector-pathogen pairs. See Appendix 1—table 4 for data sources and Appendix 1—table 8 for priors.
Figure 6. Vector competence (bc) and its component traits—infection efficiency (c) and transmission efficiency (b) respond strongly to temperature and vary across vector and virus species. Thermal responses of infection efficiency (c, # infected / # exposed; first column), transmission efficiency (b, # transmitting / # infected; second column) or vector competence (bc, # infected / # exposed; third column) for vector–virus pairs. First row (A,B,C): West Nile virus in Culex pipiens (dark grey), Cx. tarsalis (blue), and Cx. univitattus (yellow/orange). Second row: (D,E,F) Western Equine Encephalitis virus in Cx. tarsalis (light blue). Third row (G,H,I): Sindbis virus in Aedes taeniorhynchus (dark green), Sindbis virus in Cx. pipiens (light gray), St. Louis Encephalitis virus in Cx. tarsalis (dark blue), Eastern Equine Encephalitis virus in Ae. triseriatus (violet), and Rift Valley Fever virus in Ae. taeniorhynchus (light green). Points are means of replicates from single or multiple studies (+ / - standard error, for visual clarity only; thermal responses were fit to replicate-level data, see Appendix 1—figures 8 and 9). Solid lines are posterior distribution means; shaded areas are 95% credible intervals of the trait mean. The mean thermal responses for these traits were printed in Mordecai et al., 2019 (as part of Figure 4 in that paper) without the trait data and 95% CIs, combined into fewer panels, and along with thermal responses for six other vector-pathogen pairs. See Appendix 1—table 4 for data sources and Appendix 1—table 8 for priors.CC BY · PubMed Central
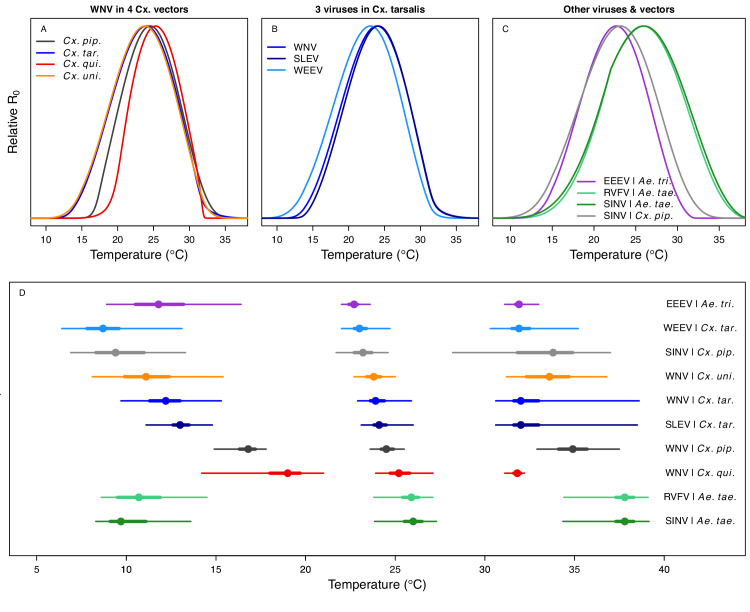
Figure 7. Unimodal thermal responses of transmission (relative R0) for ten vector-virus pairs. Posterior mean relative R0 for (A) West Nile virus (WNV) in Culex pipiens (dark grey), Cx. tarsalis (blue), Cx. quinquefasciatus (red), and Cx. univitattus (orange); (B) three viruses in Cx. tarsalis: WNV (same as in A, blue), Western Equine Encephalitis virus (WEEV, light blue), and St. Louis Encephalitis virus (SLEV, dark blue); (C) Sindbis virus (SINV) in Aedes taeniorhynchus (dark green) and Cx. pipiens (light grey), Rift Valley Fever virus (RVFV) in Ae. taeniorhynchus (light green), and Eastern Equine Encephalitis virus (EEEV) in Ae. triseriatus (violet). (D) Posterior median and uncertainty estimates for the lower thermal limit, optimum, and upper thermal limit. Points show medians, thick lines show middle 50% density, thin lines show 95% credible intervals. Models are ordered by increasing median optimal temperature. The thermal responses for R0 were printed in Mordecai et al., 2019 (as Figure 2 in that paper, reproduced here as Appendix 1—table 10), combined into two total panels and along with six other vector-pathogen pairs. See Appendix 1—figure 21 for histograms of lower thermal limit, optimum, and upper thermal limit for each model.
Figure 7. Unimodal thermal responses of transmission (relative R0) for ten vector-virus pairs. Posterior mean relative R0 for (A) West Nile virus (WNV) in Culex pipiens (dark grey), Cx. tarsalis (blue), Cx. quinquefasciatus (red), and Cx. univitattus (orange); (B) three viruses in Cx. tarsalis: WNV (same as in A, blue), Western Equine Encephalitis virus (WEEV, light blue), and St. Louis Encephalitis virus (SLEV, dark blue); (C) Sindbis virus (SINV) in Aedes taeniorhynchus (dark green) and Cx. pipiens (light grey), Rift Valley Fever virus (RVFV) in Ae. taeniorhynchus (light green), and Eastern Equine Encephalitis virus (EEEV) in Ae. triseriatus (violet). (D) Posterior median and uncertainty estimates for the lower thermal limit, optimum, and upper thermal limit. Points show medians, thick lines show middle 50% density, thin lines show 95% credible intervals. Models are ordered by increasing median optimal temperature. The thermal responses for R0 were printed in Mordecai et al., 2019 (as Figure 2 in that paper, reproduced here as Appendix 1—table 10), combined into two total panels and along with six other vector-pathogen pairs. See Appendix 1—figure 21 for histograms of lower thermal limit, optimum, and upper thermal limit for each model.CC BY · PubMed Central
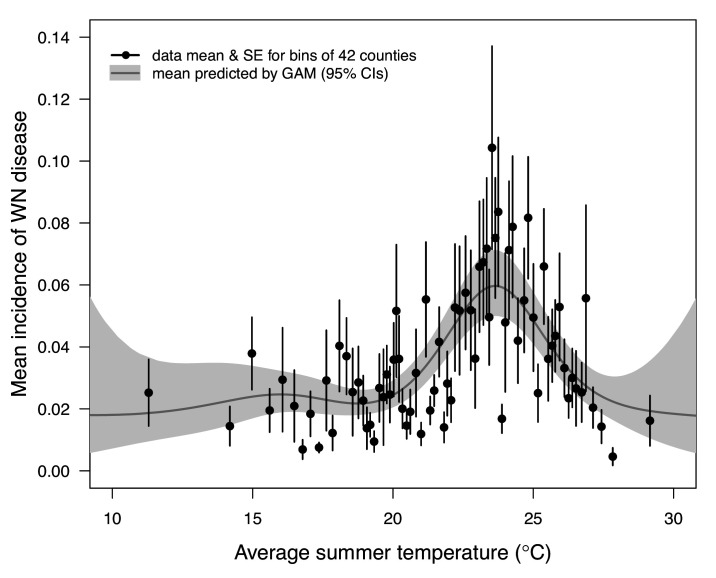
Figure 8. Incidence of human neuroinvasive West Nile disease across US counties responds unimodally to temperature, peaking at 24°C. Grey line: predicted mean incidence from a generalized additive model (GAM) fit to county-level data (n = 3109) of mean temperature from May-September and incidence of neuroinvasive West Nile disease per 1000 people, both averaged from 2001 to 2016. Black points: mean incidence (with standard error bars) for bins of 42 counties (for visual clarity). See Appendix 1—figure 24 for fits across a range of smoothing parameters. See Appendix 1—figure 25 for LOESS (moving average) fits of the data. A version of the LOESS analysis was published as Figure S3 in Mordecai et al., 2019.
Figure 8. Incidence of human neuroinvasive West Nile disease across US counties responds unimodally to temperature, peaking at 24°C. Grey line: predicted mean incidence from a generalized additive model (GAM) fit to county-level data (n = 3109) of mean temperature from May-September and incidence of neuroinvasive West Nile disease per 1000 people, both averaged from 2001 to 2016. Black points: mean incidence (with standard error bars) for bins of 42 counties (for visual clarity). See Appendix 1—figure 24 for fits across a range of smoothing parameters. See Appendix 1—figure 25 for LOESS (moving average) fits of the data. A version of the LOESS analysis was published as Figure S3 in Mordecai et al., 2019.CC BY · PubMed Central
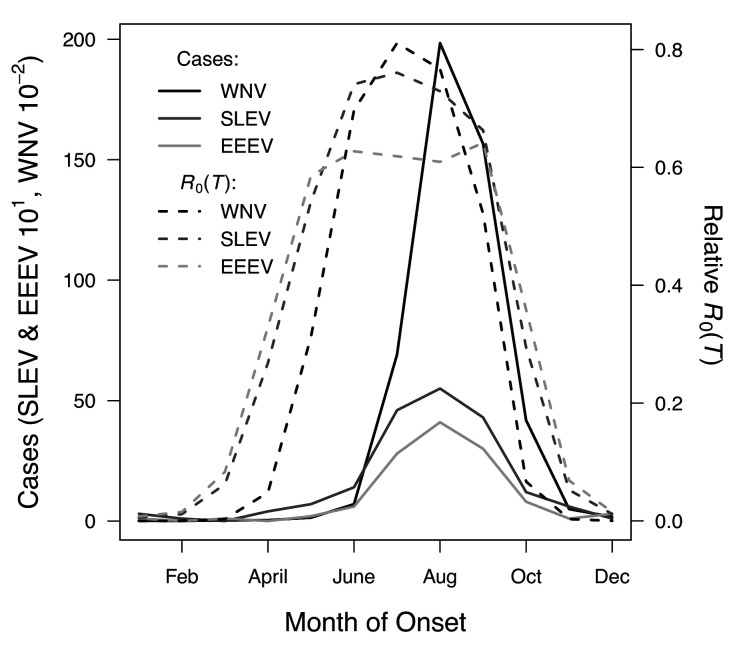
Figure 9. R0(T) predicts the seasonal pattern of human cases of mosquito-borne viral diseases. Incidence (solid lines) lags behind predicted temperature-dependent R0 (dashed lines) for human cases of neuroinvasive disease caused by West Nile virus (WNV, black), St. Louis encephalitis virus (SLEV, dark gray), and Eastern Equine Encephalitis virus (EEEV, light gray) by 2 months. This lag matches patterns in other mosquito-borne diseases and is caused by the time required for mosquito populations to increase, become infectious, and bite humans, and for humans to present symptoms and seek medical care. However, the predicted lag is not present at the end of the transmission season in October, when R0(T) and incidence decline in tandem.
Figure 9. R0(T) predicts the seasonal pattern of human cases of mosquito-borne viral diseases. Incidence (solid lines) lags behind predicted temperature-dependent R0 (dashed lines) for human cases of neuroinvasive disease caused by West Nile virus (WNV, black), St. Louis encephalitis virus (SLEV, dark gray), and Eastern Equine Encephalitis virus (EEEV, light gray) by 2 months. This lag matches patterns in other mosquito-borne diseases and is caused by the time required for mosquito populations to increase, become infectious, and bite humans, and for humans to present symptoms and seek medical care. However, the predicted lag is not present at the end of the transmission season in October, when R0(T) and incidence decline in tandem.CC BY · PubMed Central
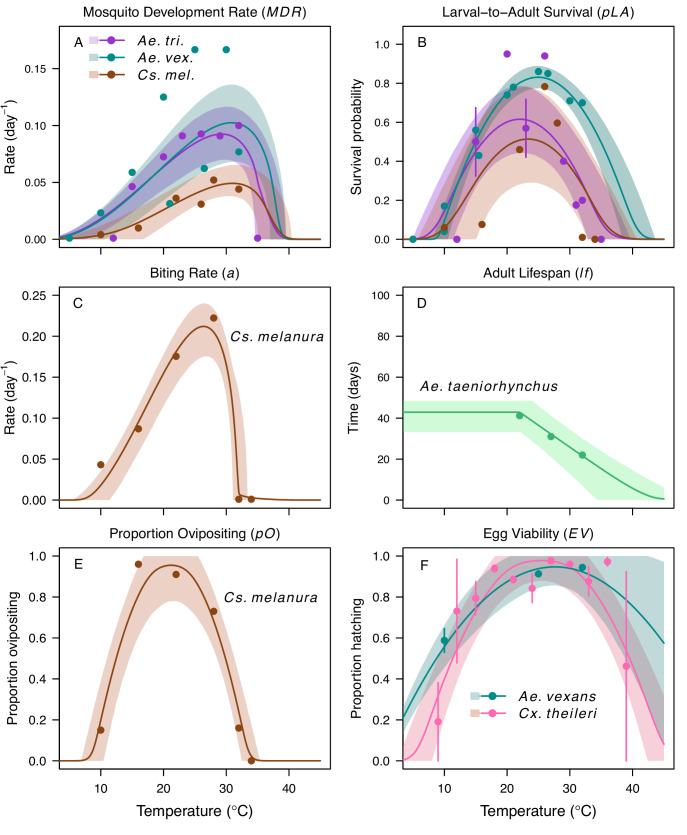
Appendix 1—figure 1. Thermal responses for mosquito traits in additional vector species. Ae. taeniorhynchus (green), Ae. triseriatus (violet), Aedes vexans (teal), Cx. theileri (pink), and Culiseta melanura (brown). (A) Mosquito development rate (MDR), (B) larval-to-adult survival (pLA), and (C) biting rate (a), (D) lifespan (lf), (E) proportion ovipositing (pO) and (F) egg viability (EV). Points without error bars are reported means from single studies; points with error bars are averages of means from multiple studies (+ / - standard error, for visual clarity only; thermal responses were fit to reported means). Solid lines are posterior distribution means; shaded areas are 95% credible intervals. The median thermal responses for these traits were printed in Mordecai et al., 2019 (as part of Figure 3) without the trait data and 95% CIs and along with thermal responses for six other vectors.
Appendix 1—figure 1. Thermal responses for mosquito traits in additional vector species. Ae. taeniorhynchus (green), Ae. triseriatus (violet), Aedes vexans (teal), Cx. theileri (pink), and Culiseta melanura (brown). (A) Mosquito development rate (MDR), (B) larval-to-adult survival (pLA), and (C) biting rate (a), (D) lifespan (lf), (E) proportion ovipositing (pO) and (F) egg viability (EV). Points without error bars are reported means from single studies; points with error bars are averages of means from multiple studies (+ / - standard error, for visual clarity only; thermal responses were fit to reported means). Solid lines are posterior distribution means; shaded areas are 95% credible intervals. The median thermal responses for these traits were printed in Mordecai et al., 2019 (as part of Figure 3) without the trait data and 95% CIs and along with thermal responses for six other vectors.CC BY · PubMed Central
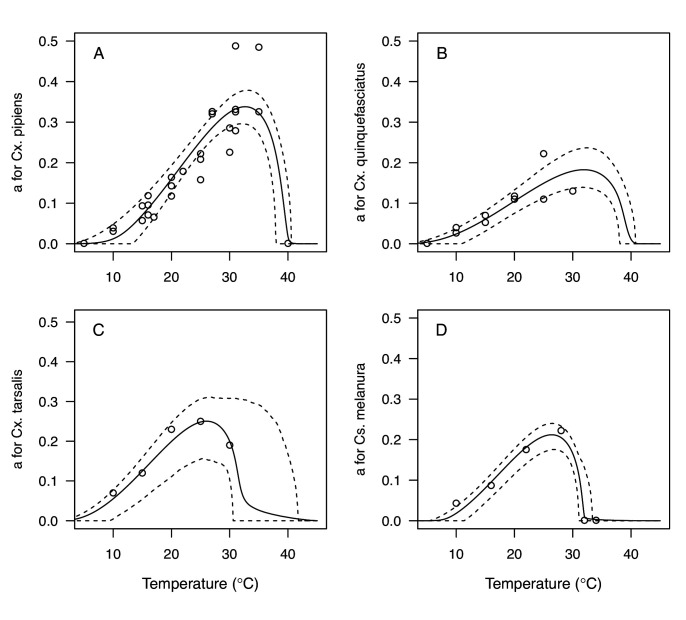
Appendix 1—figure 2. Thermal responses for biting rate (a) showing individual data points. (A) Culex pipiens, (B), Cx. quinquefasciatus, (C) Cx. tarsalis, and (D) Culiseta melanura. Solid lines are posterior distribution means for the mean thermal response; black dashed lines are 95% credible intervals for the mean thermal response; red dashed lines are 95% prediction intervals for observed data (incorporating the fitted variance).
Appendix 1—figure 2. Thermal responses for biting rate (a) showing individual data points. (A) Culex pipiens, (B), Cx. quinquefasciatus, (C) Cx. tarsalis, and (D) Culiseta melanura. Solid lines are posterior distribution means for the mean thermal response; black dashed lines are 95% credible intervals for the mean thermal response; red dashed lines are 95% prediction intervals for observed data (incorporating the fitted variance).CC BY · PubMed Central
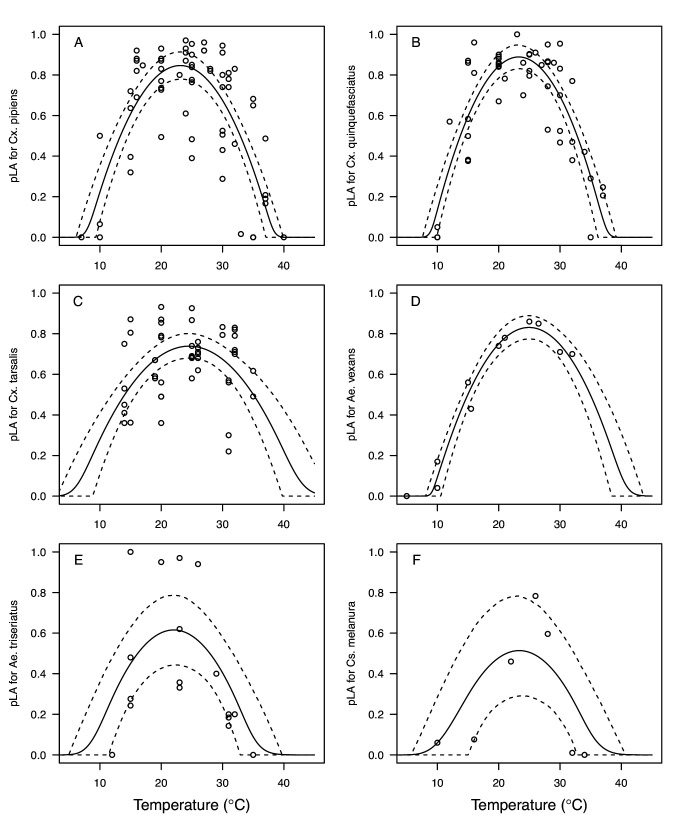
Appendix 1—figure 3. Thermal responses for larval-to-adult survival (pLA) showing individual data points. (A) Culex pipiens, (B), Cx. quinquefasciatus, (C) Cx. tarsalis, (D) Aedes vexans, (E) Ae. triseriatus, and (F) Culiseta melanura. Solid lines are posterior distribution means for the mean thermal response; black dashed lines are 95% credible intervals for the mean thermal response; red dashed lines are 95% prediction intervals for observed data (incorporating the fitted variance).
Appendix 1—figure 3. Thermal responses for larval-to-adult survival (pLA) showing individual data points. (A) Culex pipiens, (B), Cx. quinquefasciatus, (C) Cx. tarsalis, (D) Aedes vexans, (E) Ae. triseriatus, and (F) Culiseta melanura. Solid lines are posterior distribution means for the mean thermal response; black dashed lines are 95% credible intervals for the mean thermal response; red dashed lines are 95% prediction intervals for observed data (incorporating the fitted variance).CC BY · PubMed Central
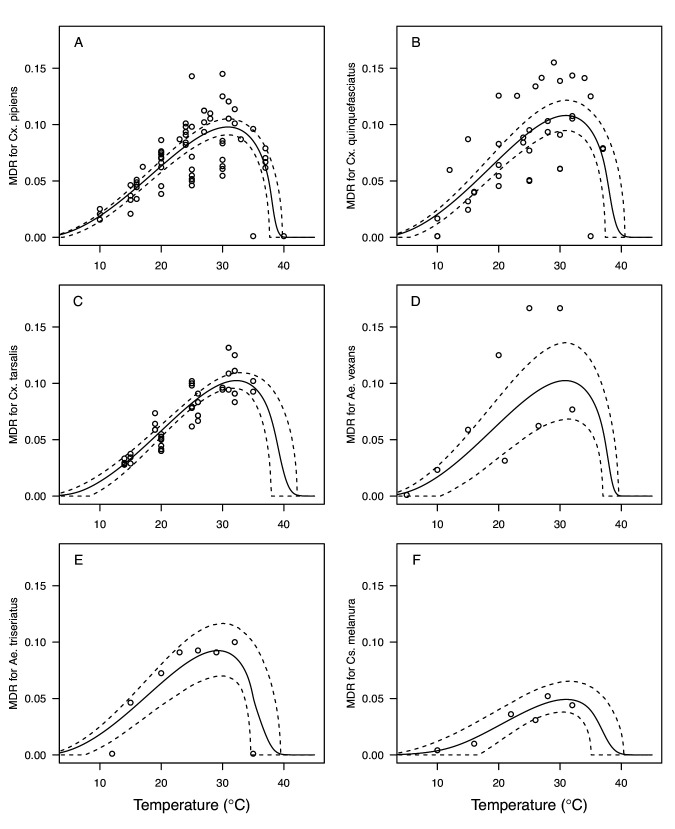
Appendix 1—figure 4. Thermal responses for mosquito development rate (MDR) showing individual data points. (A) Culex pipiens, (B), Cx. quinquefasciatus, (C) Cx. tarsalis, (D) Aedes vexans, (E) Ae. triseriatus, and (F) Culiseta melanura. Solid lines are posterior distribution means for the mean thermal response; black dashed lines are 95% credible intervals for the mean thermal response; red dashed lines are 95% prediction intervals for observed data (incorporating the fitted variance).
Appendix 1—figure 4. Thermal responses for mosquito development rate (MDR) showing individual data points. (A) Culex pipiens, (B), Cx. quinquefasciatus, (C) Cx. tarsalis, (D) Aedes vexans, (E) Ae. triseriatus, and (F) Culiseta melanura. Solid lines are posterior distribution means for the mean thermal response; black dashed lines are 95% credible intervals for the mean thermal response; red dashed lines are 95% prediction intervals for observed data (incorporating the fitted variance).CC BY · PubMed Central
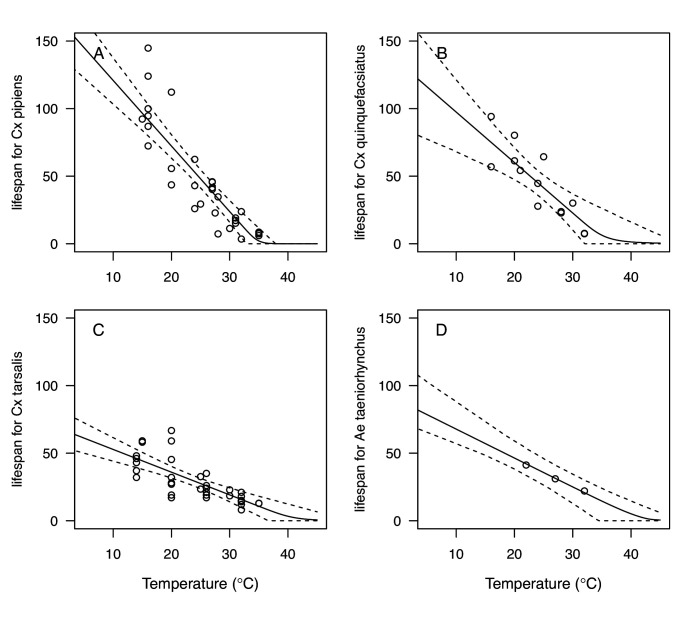
Appendix 1—figure 5. Thermal responses for adult mosquito lifespan (lf) showing individual data points. (A) Culex pipiens, (B), Cx. quinquefasciatus, (C) Cx. tarsalis, and (D) Aedes taeniorhynchus. When data were reported by sex, only female data were used. Solid lines are posterior distribution means for the mean thermal response; black dashed lines are 95% credible intervals for the mean thermal response; red dashed lines are 95% prediction intervals for observed data (incorporating the fitted variance).
Appendix 1—figure 5. Thermal responses for adult mosquito lifespan (lf) showing individual data points. (A) Culex pipiens, (B), Cx. quinquefasciatus, (C) Cx. tarsalis, and (D) Aedes taeniorhynchus. When data were reported by sex, only female data were used. Solid lines are posterior distribution means for the mean thermal response; black dashed lines are 95% credible intervals for the mean thermal response; red dashed lines are 95% prediction intervals for observed data (incorporating the fitted variance).CC BY · PubMed Central
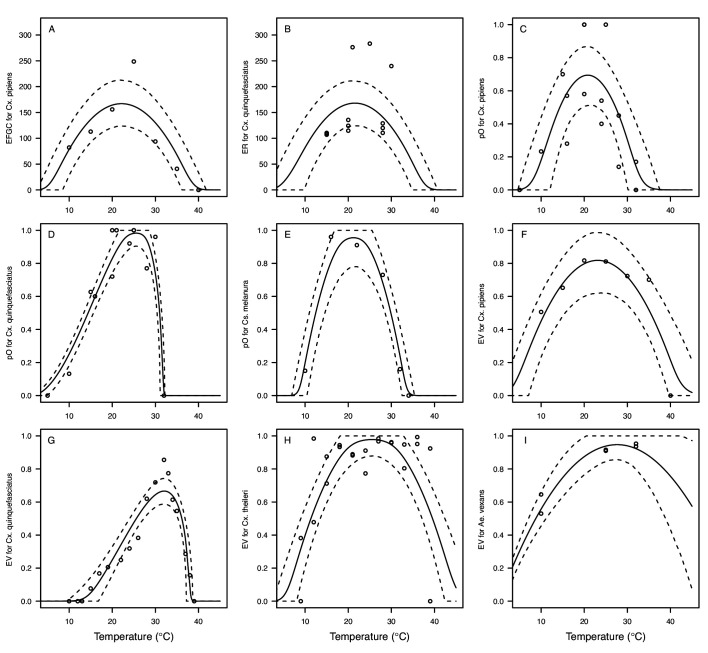
Appendix 1—figure 6. Thermal responses for fecundity traits showing individual data points. Traits: (A) Reproduction measured as eggs per female per gonotrophic cycle (EFGC), (B) reproduction measured as eggs per raft (ER) (C–E) proportion ovipositing (pO), and (F–I) egg viability (EV). Vector species: (A,C,F) Culex pipiens, (B,D,G), Cx. quinquefasciatus, (E) Culiseta melanura, (H) Cx. theileri, and (I) Aedes vexans. Solid lines are posterior distribution means for the mean thermal response; black dashed lines are 95% credible intervals for the mean thermal response; red dashed lines are 95% prediction intervals for observed data (incorporating the fitted variance).
Appendix 1—figure 6. Thermal responses for fecundity traits showing individual data points. Traits: (A) Reproduction measured as eggs per female per gonotrophic cycle (EFGC), (B) reproduction measured as eggs per raft (ER) (C–E) proportion ovipositing (pO), and (F–I) egg viability (EV). Vector species: (A,C,F) Culex pipiens, (B,D,G), Cx. quinquefasciatus, (E) Culiseta melanura, (H) Cx. theileri, and (I) Aedes vexans. Solid lines are posterior distribution means for the mean thermal response; black dashed lines are 95% credible intervals for the mean thermal response; red dashed lines are 95% prediction intervals for observed data (incorporating the fitted variance).CC BY · PubMed Central
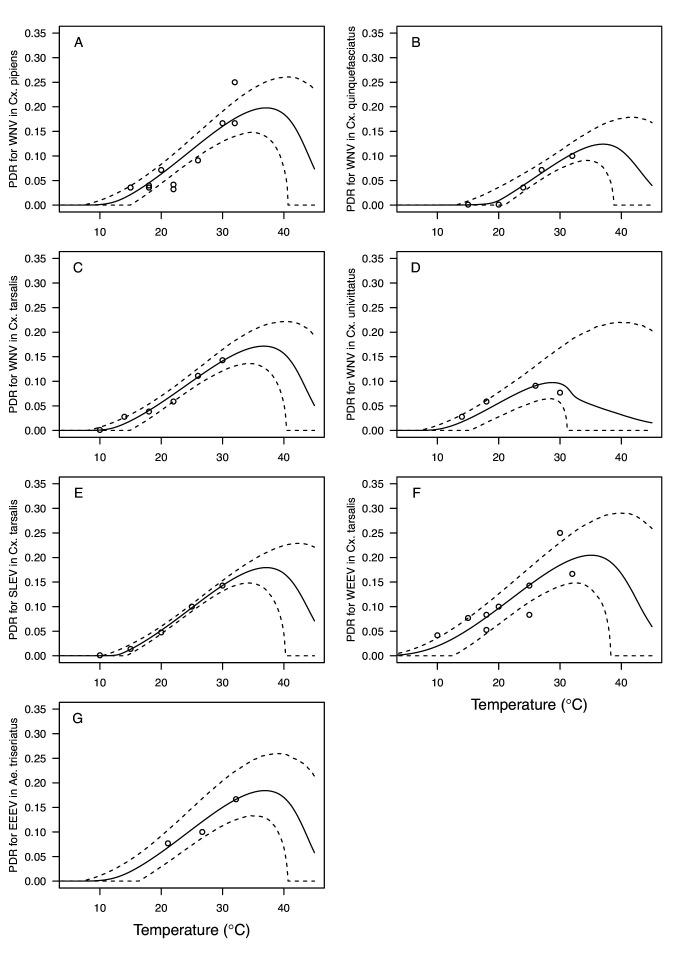
Appendix 1—figure 7. Thermal responses for pathogen development rate (PDR) showing individual data points. (A) West Nile virus (WNV) in Culex pipiens, (B), WNV in Cx. quinquefasciatus, (C) WNV in Cx. tarsalis, (D) WNV in Cx. univittatus, (E) St. Louis Encephalitis virus (SLEV) in Cx. tarsalis, (F) Western Equine Encephalitis virus (WEEV) in Cx. tarsalis, and (G) Eastern Equine Encephalitis virus (EEEV) in Aedes triseriatus. Solid lines are posterior distribution means for the mean thermal response; black dashed lines are 95% credible intervals for the mean thermal response; red dashed lines are 95% prediction intervals for observed data (incorporating the fitted variance).
Appendix 1—figure 7. Thermal responses for pathogen development rate (PDR) showing individual data points. (A) West Nile virus (WNV) in Culex pipiens, (B), WNV in Cx. quinquefasciatus, (C) WNV in Cx. tarsalis, (D) WNV in Cx. univittatus, (E) St. Louis Encephalitis virus (SLEV) in Cx. tarsalis, (F) Western Equine Encephalitis virus (WEEV) in Cx. tarsalis, and (G) Eastern Equine Encephalitis virus (EEEV) in Aedes triseriatus. Solid lines are posterior distribution means for the mean thermal response; black dashed lines are 95% credible intervals for the mean thermal response; red dashed lines are 95% prediction intervals for observed data (incorporating the fitted variance).CC BY · PubMed Central
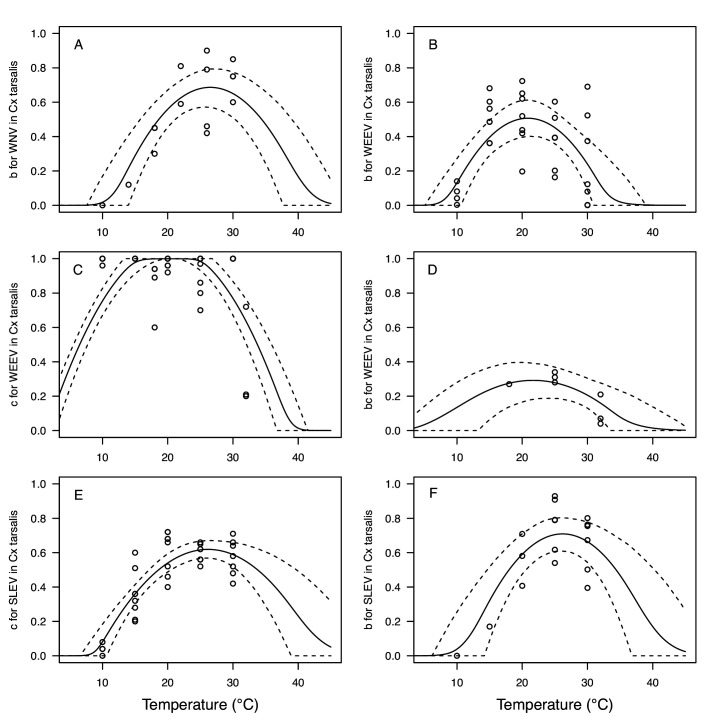
Appendix 1—figure 8. Thermal responses for vector competence traits in Culex tarsalis, showing individual data points. Traits: (A,B,F) transmission efficiency (b, # transmitting / # infected), (C,E) infection efficiency (c, # infected / # exposed), and (D) vector competence (bc, # infected / # exposed). Viruses: (A) West Nile virus (WNV), (B–D) Western Equine Encephalitis virus (WEEV), (E,F) St. Louis Encephalitis virus (SLEV). Solid lines are posterior distribution means for the mean thermal response; black dashed lines are 95% credible intervals for the mean thermal response; red dashed lines are 95% prediction intervals for observed data (incorporating the fitted variance).
Appendix 1—figure 8. Thermal responses for vector competence traits in Culex tarsalis, showing individual data points. Traits: (A,B,F) transmission efficiency (b, # transmitting / # infected), (C,E) infection efficiency (c, # infected / # exposed), and (D) vector competence (bc, # infected / # exposed). Viruses: (A) West Nile virus (WNV), (B–D) Western Equine Encephalitis virus (WEEV), (E,F) St. Louis Encephalitis virus (SLEV). Solid lines are posterior distribution means for the mean thermal response; black dashed lines are 95% credible intervals for the mean thermal response; red dashed lines are 95% prediction intervals for observed data (incorporating the fitted variance).CC BY · PubMed Central
Appendix 1—figure 9. Thermal responses for vector competence traits showing individual data points. Traits: (A,E,F) infection efficiency (c, # infected / # exposed) and (B,C,D,G) vector competence (bc, # infected / # exposed). Viruses and vectors: (A,B) West Nile virus (WNV) in Culex pipiens, (C) WNV in Cx. univittatus, (D) Eastern Equine Encephalitis virus (EEEV) in Ae. triseriatus, (E) Sindbis virus (SINV) in Culex pipiens, (F) SINV in Aedes taeniorhynchus, and (G) Rift Valley Fever virus (RVFV) in Ae. taeniorhynchus. Solid lines are posterior distribution means for the mean thermal response; black dashed lines are 95% credible intervals for the mean thermal response; red dashed lines are 95% prediction intervals for observed data (incorporating the fitted variance).
Appendix 1—figure 9. Thermal responses for vector competence traits showing individual data points. Traits: (A,E,F) infection efficiency (c, # infected / # exposed) and (B,C,D,G) vector competence (bc, # infected / # exposed). Viruses and vectors: (A,B) West Nile virus (WNV) in Culex pipiens, (C) WNV in Cx. univittatus, (D) Eastern Equine Encephalitis virus (EEEV) in Ae. triseriatus, (E) Sindbis virus (SINV) in Culex pipiens, (F) SINV in Aedes taeniorhynchus, and (G) Rift Valley Fever virus (RVFV) in Ae. taeniorhynchus. Solid lines are posterior distribution means for the mean thermal response; black dashed lines are 95% credible intervals for the mean thermal response; red dashed lines are 95% prediction intervals for observed data (incorporating the fitted variance).CC BY · PubMed Central
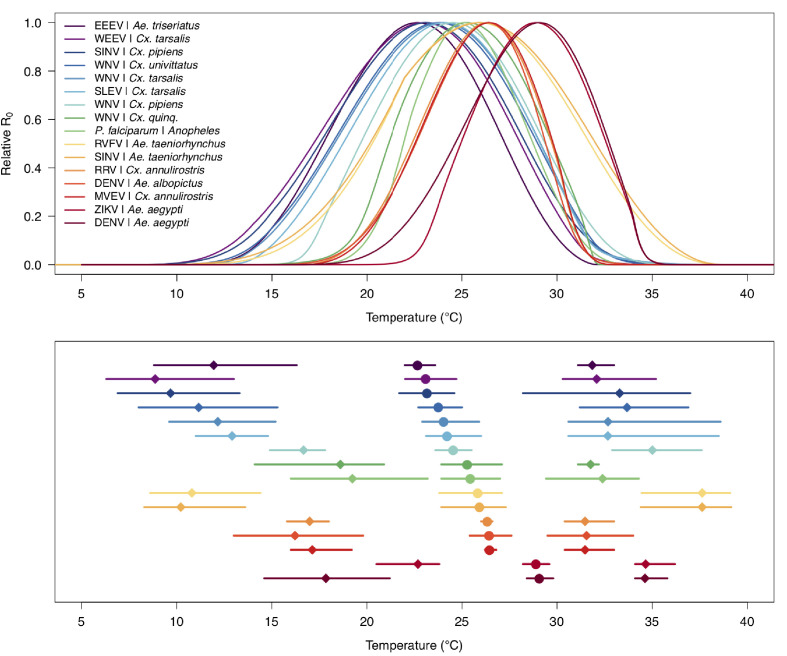
Appendix 1—figure 10. Medians and 95% credible intervals for thermal limits and optima of R0 models across temperate and tropical mosquito-borne disease systems. Models in order from top to bottom: Eastern Equine Encephalitis virus (EEEV) in Aedes triseriatus (dark purple; this paper), Western Equine Encephalitis virus (WEEV) in Culex. tarsalis (light purple; this paper), Sindbis virus (SINV) in Cx. pipiens (dark blue; this paper), West Nile virus (WNV) in Cx. univittatus (medium blue; this paper), WNV in Cx. tarsalis (light blue, this paper), St. Louis Encephalitis virus (SLEV) in Cx. tarsalis (dark teal; this paper), WNV in Cx. pipiens (light teal; this paper), WNV in Cx. quinquefasciatus (dark green; this paper), Plasmodium falciparum malaria in Anopheles spp. (light green; Johnson et al., 2015), Rift Valley Fever virus (RVFV) in Ae. taeniorhynchus (yellow; this paper), SINV in Ae. taeniorhynchus (light orange; this paper), Ross River virus (RRV) in Cx. annulirostris (medium orange; Shocket et al., 2018), dengue virus (DENV) in Ae. albopictus (dark orange; Mordecai et al., 2017), Murray Valley Encephalitis virus (MVEV) in Cx. annulirostris (light red; Shocket et al., 2018), Zika virus (ZIKV) in Ae. aegypti (medium red; Tesla et al., 2018), DENV in Ae. aegypti (dark red; Mordecai et al., 2017). Figure is identical to Figure 2 in Mordecai et al., 2019.
Appendix 1—figure 10. Medians and 95% credible intervals for thermal limits and optima of R0 models across temperate and tropical mosquito-borne disease systems. Models in order from top to bottom: Eastern Equine Encephalitis virus (EEEV) in Aedes triseriatus (dark purple; this paper), Western Equine Encephalitis virus (WEEV) in Culex. tarsalis (light purple; this paper), Sindbis virus (SINV) in Cx. pipiens (dark blue; this paper), West Nile virus (WNV) in Cx. univittatus (medium blue; this paper), WNV in Cx. tarsalis (light blue, this paper), St. Louis Encephalitis virus (SLEV) in Cx. tarsalis (dark teal; this paper), WNV in Cx. pipiens (light teal; this paper), WNV in Cx. quinquefasciatus (dark green; this paper), Plasmodium falciparum malaria in Anopheles spp. (light green; Johnson et al., 2015), Rift Valley Fever virus (RVFV) in Ae. taeniorhynchus (yellow; this paper), SINV in Ae. taeniorhynchus (light orange; this paper), Ross River virus (RRV) in Cx. annulirostris (medium orange; Shocket et al., 2018), dengue virus (DENV) in Ae. albopictus (dark orange; Mordecai et al., 2017), Murray Valley Encephalitis virus (MVEV) in Cx. annulirostris (light red; Shocket et al., 2018), Zika virus (ZIKV) in Ae. aegypti (medium red; Tesla et al., 2018), DENV in Ae. aegypti (dark red; Mordecai et al., 2017). Figure is identical to Figure 2 in Mordecai et al., 2019.CC BY · PubMed Central
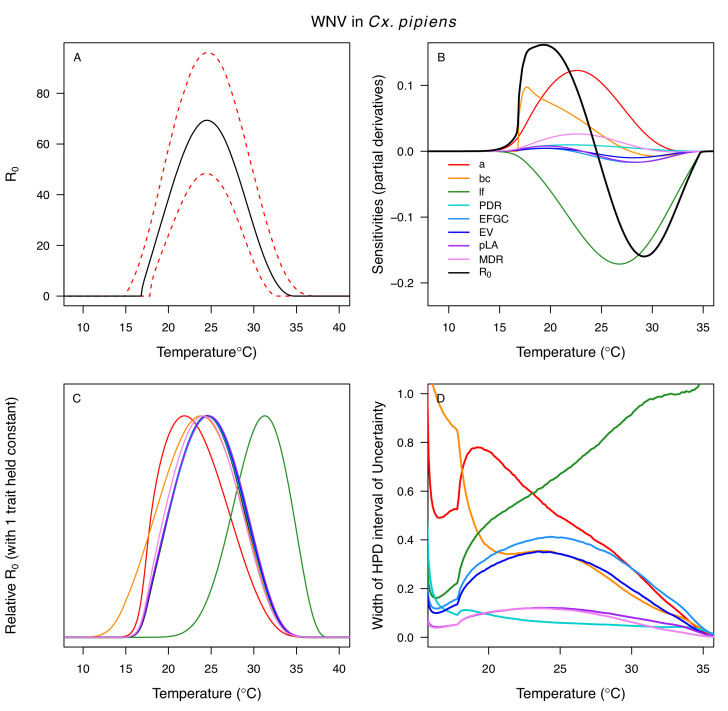
Appendix 1—figure 11. Temperature-dependent R0, sensitivity analyses, and uncertainty analysis for model of West Nile Virus (WNV) in Culex pipiens. (A) Median temperature-dependent R0 (black line) with 95% credible intervals (dashed red lines). (B) Sensitivity analysis #1: derivative with respect to temperature for R0 (black) and partial derivatives with respect to temperature for each trait. (C) Sensitivity analysis #2: relative R0 calculated with single traits held constant. (D) Uncertainty analysis using highest posterior density (HPD) interval widths: the proportion of total uncertainty due to each trait. (B–D) Trait colors: biting rate (a, red), vector competence (bc, orange), adult lifespan (lf, green), parasite development rate (PDR, cyan), fecundity (EFGC, light blue), egg viability (EV, dark blue), larval survival (pLA, purple), and mosquito development rate (MDR, pink). All traits from Cx. pipiens.
Appendix 1—figure 11. Temperature-dependent R0, sensitivity analyses, and uncertainty analysis for model of West Nile Virus (WNV) in Culex pipiens. (A) Median temperature-dependent R0 (black line) with 95% credible intervals (dashed red lines). (B) Sensitivity analysis #1: derivative with respect to temperature for R0 (black) and partial derivatives with respect to temperature for each trait. (C) Sensitivity analysis #2: relative R0 calculated with single traits held constant. (D) Uncertainty analysis using highest posterior density (HPD) interval widths: the proportion of total uncertainty due to each trait. (B–D) Trait colors: biting rate (a, red), vector competence (bc, orange), adult lifespan (lf, green), parasite development rate (PDR, cyan), fecundity (EFGC, light blue), egg viability (EV, dark blue), larval survival (pLA, purple), and mosquito development rate (MDR, pink). All traits from Cx. pipiens.CC BY · PubMed Central
Appendix 1—figure 12. Temperature-dependent R0, sensitivity analyses, and uncertainty analysis for model of West Nile Virus (WNV) in Culex quinquefasciatus. (A) Median temperature-dependent R0 (black line) with 95% credible intervals (dashed red lines). (B) Sensitivity analysis #1: derivative with respect to temperature for R0 (black) and partial derivatives with respect to temperature for each trait. (C) Sensitivity analysis #2: relative R0 calculated with single traits held constant. (D) Uncertainty analysis using highest posterior density (HPD) interval widths: the proportion of total uncertainty due to each trait. (B–D) Trait colors: biting rate (a, red), vector competence (bc, orange), adult lifespan (lf, green), parasite development rate (PDR, cyan), fecundity (EFGC, light blue), egg viability (EV, dark blue), larval survival (pLA, purple), mosquito development rate (MDR, pink), and proportion ovipositing (pO, grey). Vector competence (bc) from Cx. univitattus; all other traits from Cx. quinquefasciatus.
Appendix 1—figure 12. Temperature-dependent R0, sensitivity analyses, and uncertainty analysis for model of West Nile Virus (WNV) in Culex quinquefasciatus. (A) Median temperature-dependent R0 (black line) with 95% credible intervals (dashed red lines). (B) Sensitivity analysis #1: derivative with respect to temperature for R0 (black) and partial derivatives with respect to temperature for each trait. (C) Sensitivity analysis #2: relative R0 calculated with single traits held constant. (D) Uncertainty analysis using highest posterior density (HPD) interval widths: the proportion of total uncertainty due to each trait. (B–D) Trait colors: biting rate (a, red), vector competence (bc, orange), adult lifespan (lf, green), parasite development rate (PDR, cyan), fecundity (EFGC, light blue), egg viability (EV, dark blue), larval survival (pLA, purple), mosquito development rate (MDR, pink), and proportion ovipositing (pO, grey). Vector competence (bc) from Cx. univitattus; all other traits from Cx. quinquefasciatus.CC BY · PubMed Central
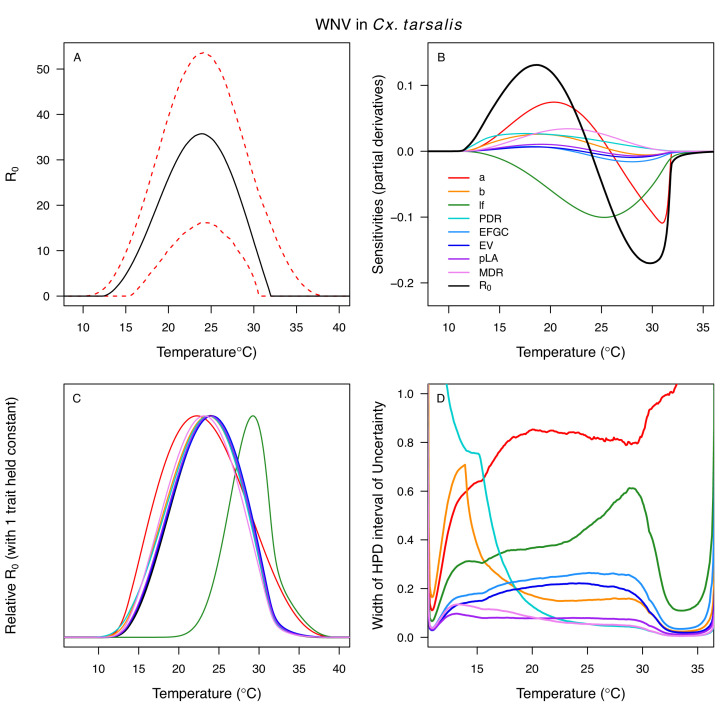
Appendix 1—figure 13. Temperature-dependent R0, sensitivity analyses, and uncertainty analysis for model of West Nile Virus (WNV) in Culex tarsalis. (A) Median temperature-dependent R0 (black line) with 95% credible intervals (dashed red lines). (B) Sensitivity analysis #1: derivative with respect to temperature for R0 (black) and partial derivatives with respect to temperature for each trait. (C) Sensitivity analysis #2: relative R0 calculated with single traits held constant. (D) Uncertainty analysis using highest posterior density (HPD) interval widths: the proportion of total uncertainty due to each trait. (B–D) Trait colors: biting rate (a, red), transmission efficiency (b, orange), adult lifespan (lf, green), parasite development rate (PDR, cyan), fecundity (EFGC, light blue), egg viability (EV, dark blue), larval survival (pLA, purple), and mosquito development rate (MDR, pink). Fecundity (EFGC) and egg viability (EV) from Cx. pipiens; all other traits from Cx. tarsalis.
Appendix 1—figure 13. Temperature-dependent R0, sensitivity analyses, and uncertainty analysis for model of West Nile Virus (WNV) in Culex tarsalis. (A) Median temperature-dependent R0 (black line) with 95% credible intervals (dashed red lines). (B) Sensitivity analysis #1: derivative with respect to temperature for R0 (black) and partial derivatives with respect to temperature for each trait. (C) Sensitivity analysis #2: relative R0 calculated with single traits held constant. (D) Uncertainty analysis using highest posterior density (HPD) interval widths: the proportion of total uncertainty due to each trait. (B–D) Trait colors: biting rate (a, red), transmission efficiency (b, orange), adult lifespan (lf, green), parasite development rate (PDR, cyan), fecundity (EFGC, light blue), egg viability (EV, dark blue), larval survival (pLA, purple), and mosquito development rate (MDR, pink). Fecundity (EFGC) and egg viability (EV) from Cx. pipiens; all other traits from Cx. tarsalis.CC BY · PubMed Central
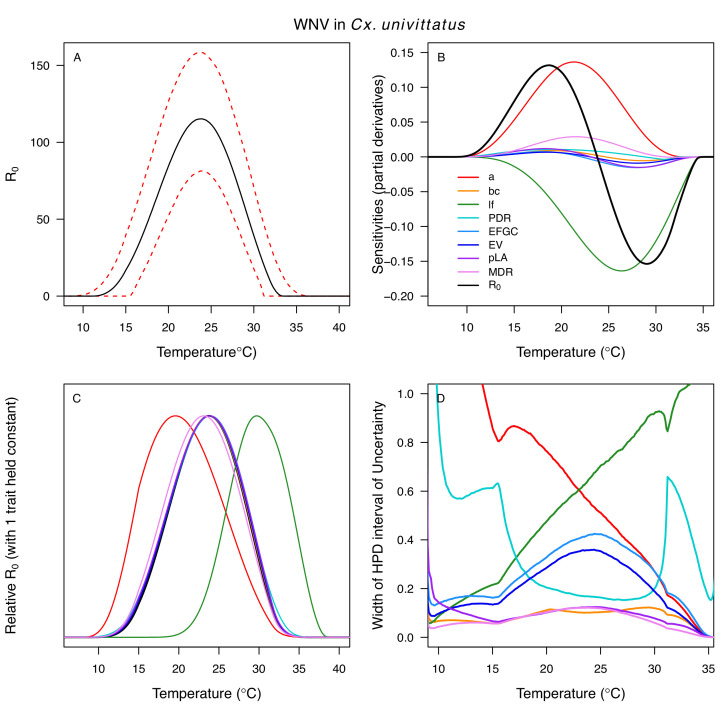
Appendix 1—figure 14. Temperature-dependent R0, sensitivity analyses, and uncertainty analysis for model of West Nile Virus (WNV) in Culex univittatus. (A) Median temperature-dependent R0 (black line) with 95% credible intervals (dashed red lines). (B) Sensitivity analysis #1: derivative with respect to temperature for R0 (black) and partial derivatives with respect to temperature for each trait. (C) Sensitivity analysis #2: relative R0 calculated with single traits held constant. (D) Uncertainty analysis using highest posterior density (HPD) interval widths: the proportion of total uncertainty due to each trait. (B–D) Trait colors: biting rate (a, red), vector competence (bc, orange), adult lifespan (lf, green), parasite development rate (PDR, cyan), fecundity (EFGC, light blue), egg viability (EV, dark blue), larval survival (pLA, purple), and mosquito development rate (MDR, pink). Infection traits (bc and PDR) from Cx. univittatus; all other traits from Cx. pipiens.
Appendix 1—figure 14. Temperature-dependent R0, sensitivity analyses, and uncertainty analysis for model of West Nile Virus (WNV) in Culex univittatus. (A) Median temperature-dependent R0 (black line) with 95% credible intervals (dashed red lines). (B) Sensitivity analysis #1: derivative with respect to temperature for R0 (black) and partial derivatives with respect to temperature for each trait. (C) Sensitivity analysis #2: relative R0 calculated with single traits held constant. (D) Uncertainty analysis using highest posterior density (HPD) interval widths: the proportion of total uncertainty due to each trait. (B–D) Trait colors: biting rate (a, red), vector competence (bc, orange), adult lifespan (lf, green), parasite development rate (PDR, cyan), fecundity (EFGC, light blue), egg viability (EV, dark blue), larval survival (pLA, purple), and mosquito development rate (MDR, pink). Infection traits (bc and PDR) from Cx. univittatus; all other traits from Cx. pipiens.CC BY · PubMed Central
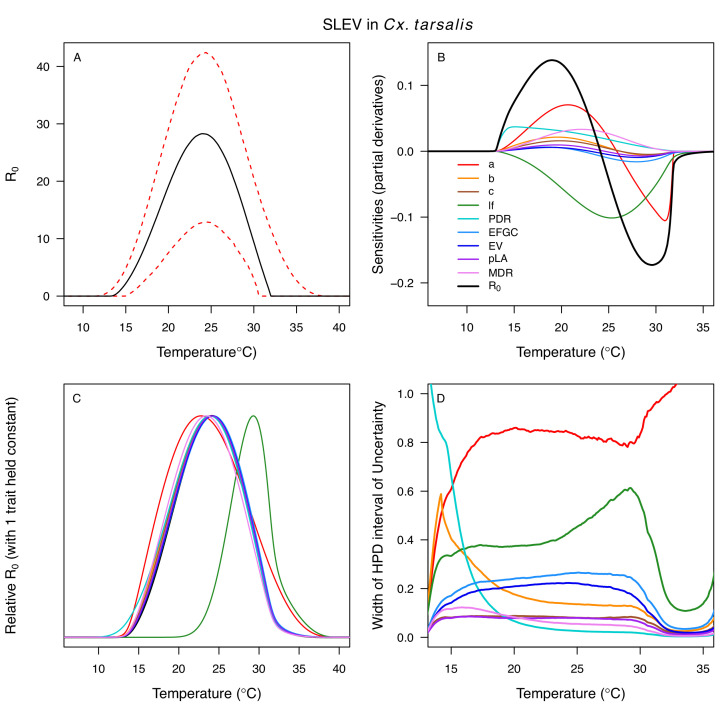
Appendix 1—figure 15. Temperature-dependent R0, sensitivity analyses, and uncertainty analysis for St. model of St. Louis Encephalitis Virus (SLEV) in Culex tarsalis. (A) Median temperature-dependent R0 (black line) with 95% credible intervals (dashed red lines). (B) Sensitivity analysis #1: derivative with respect to temperature for R0 (black) and partial derivatives with respect to temperature for each trait. (C) Sensitivity analysis #2: relative R0 calculated with single traits held constant. (D) Uncertainty analysis using highest posterior density (HPD) interval widths: the proportion of total uncertainty due to each trait. (B–D) Trait colors: biting rate (a, red), transmission efficiency (b, orange), infection efficiency (c, brown), adult lifespan (lf, green), parasite development rate (PDR, cyan), fecundity (EFGC, light blue), egg viability (EV, dark blue), larval survival (pLA, purple), and mosquito development rate (MDR, pink). Fecundity (EFGC) and egg viability (EV) from Cx. pipiens; all other traits from Cx. tarsalis.
Appendix 1—figure 15. Temperature-dependent R0, sensitivity analyses, and uncertainty analysis for St. model of St. Louis Encephalitis Virus (SLEV) in Culex tarsalis. (A) Median temperature-dependent R0 (black line) with 95% credible intervals (dashed red lines). (B) Sensitivity analysis #1: derivative with respect to temperature for R0 (black) and partial derivatives with respect to temperature for each trait. (C) Sensitivity analysis #2: relative R0 calculated with single traits held constant. (D) Uncertainty analysis using highest posterior density (HPD) interval widths: the proportion of total uncertainty due to each trait. (B–D) Trait colors: biting rate (a, red), transmission efficiency (b, orange), infection efficiency (c, brown), adult lifespan (lf, green), parasite development rate (PDR, cyan), fecundity (EFGC, light blue), egg viability (EV, dark blue), larval survival (pLA, purple), and mosquito development rate (MDR, pink). Fecundity (EFGC) and egg viability (EV) from Cx. pipiens; all other traits from Cx. tarsalis.CC BY · PubMed Central
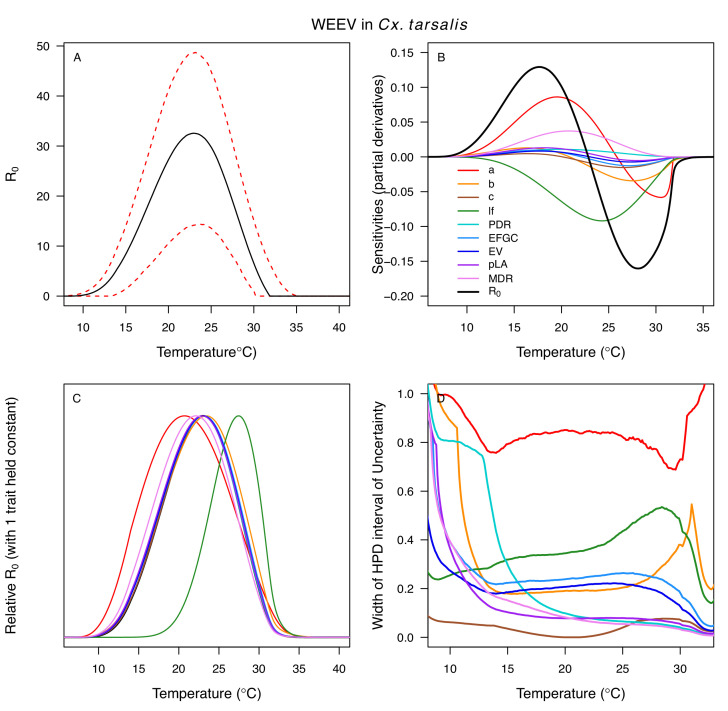
Appendix 1—figure 16. Temperature-dependent R0, sensitivity analyses, and uncertainty analysis for model of Western Equine Encephalitis Virus (WEEV) in Culex tarsalis. (A) Median temperature-dependent R0 (black line) with 95% credible intervals (dashed red lines). (B) Sensitivity analysis #1: derivative with respect to temperature for R0 (black) and partial derivatives with respect to temperature for each trait. (C) Sensitivity analysis #2: relative R0 calculated with single traits held constant. (D) Uncertainty analysis using highest posterior density (HPD) interval widths: the proportion of total uncertainty due to each trait. (B–D) Trait colors: biting rate (a, red), transmission efficiency (b, orange), infection efficiency (c, brown), adult lifespan (lf, green), parasite development rate (PDR, cyan), fecundity (EFGC, light blue), egg viability (EV, dark blue), larval survival (pLA, purple), and mosquito development rate (MDR, pink). Fecundity (EFGC) and egg viability (EV) from Cx. pipiens; all other traits from Cx. tarsalis.
Appendix 1—figure 16. Temperature-dependent R0, sensitivity analyses, and uncertainty analysis for model of Western Equine Encephalitis Virus (WEEV) in Culex tarsalis. (A) Median temperature-dependent R0 (black line) with 95% credible intervals (dashed red lines). (B) Sensitivity analysis #1: derivative with respect to temperature for R0 (black) and partial derivatives with respect to temperature for each trait. (C) Sensitivity analysis #2: relative R0 calculated with single traits held constant. (D) Uncertainty analysis using highest posterior density (HPD) interval widths: the proportion of total uncertainty due to each trait. (B–D) Trait colors: biting rate (a, red), transmission efficiency (b, orange), infection efficiency (c, brown), adult lifespan (lf, green), parasite development rate (PDR, cyan), fecundity (EFGC, light blue), egg viability (EV, dark blue), larval survival (pLA, purple), and mosquito development rate (MDR, pink). Fecundity (EFGC) and egg viability (EV) from Cx. pipiens; all other traits from Cx. tarsalis.CC BY · PubMed Central
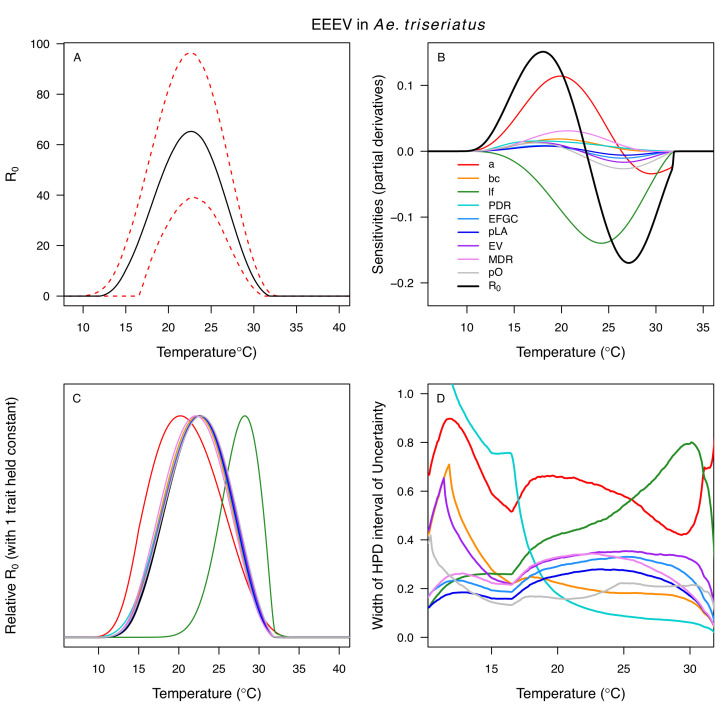
Appendix 1—figure 17. Temperature-dependent R0, sensitivity analyses, and uncertainty analysis for model of Eastern Equine Encephalitis Virus in Aedes triseriatus. (A) Median temperature-dependent R0 (black line) with 95% credible intervals (dashed red lines). (B) Sensitivity analysis #1: derivative with respect to temperature for R0 (black) and partial derivatives with respect to temperature for each trait. (C) Sensitivity analysis #2: relative R0 calculated with single traits held constant. (D) Uncertainty analysis using highest posterior density (HPD) interval widths: the proportion of total uncertainty due to each trait. (B–D) Trait colors: biting rate (a, red), vector competence (bc, orange), adult lifespan (lf, green), parasite development rate (PDR, cyan), fecundity (EFGC, light blue), egg viability (EV, dark blue), larval survival (pLA, purple), mosquito development rate (MDR, pink), and proportion ovipositing (pO, grey). Fecundity (EFGC), egg viability (EV), and lifespan (lf) from Cx. pipiens; biting rate (a) and proportion ovipositing (pO) from Culiseta melanura; all other traits from Ae. triseriatus. Note: technically fecundity as eggs per female per gonotrophic cycle (EFGC) has already accounted for the proportion ovipositing (pO). However, we selected this trait fit because it was very similar to the ER thermal response from Cx. quinquefasciatus, but slightly wider (more conservative).
Appendix 1—figure 17. Temperature-dependent R0, sensitivity analyses, and uncertainty analysis for model of Eastern Equine Encephalitis Virus in Aedes triseriatus. (A) Median temperature-dependent R0 (black line) with 95% credible intervals (dashed red lines). (B) Sensitivity analysis #1: derivative with respect to temperature for R0 (black) and partial derivatives with respect to temperature for each trait. (C) Sensitivity analysis #2: relative R0 calculated with single traits held constant. (D) Uncertainty analysis using highest posterior density (HPD) interval widths: the proportion of total uncertainty due to each trait. (B–D) Trait colors: biting rate (a, red), vector competence (bc, orange), adult lifespan (lf, green), parasite development rate (PDR, cyan), fecundity (EFGC, light blue), egg viability (EV, dark blue), larval survival (pLA, purple), mosquito development rate (MDR, pink), and proportion ovipositing (pO, grey). Fecundity (EFGC), egg viability (EV), and lifespan (lf) from Cx. pipiens; biting rate (a) and proportion ovipositing (pO) from Culiseta melanura; all other traits from Ae. triseriatus. Note: technically fecundity as eggs per female per gonotrophic cycle (EFGC) has already accounted for the proportion ovipositing (pO). However, we selected this trait fit because it was very similar to the ER thermal response from Cx. quinquefasciatus, but slightly wider (more conservative).CC BY · PubMed Central
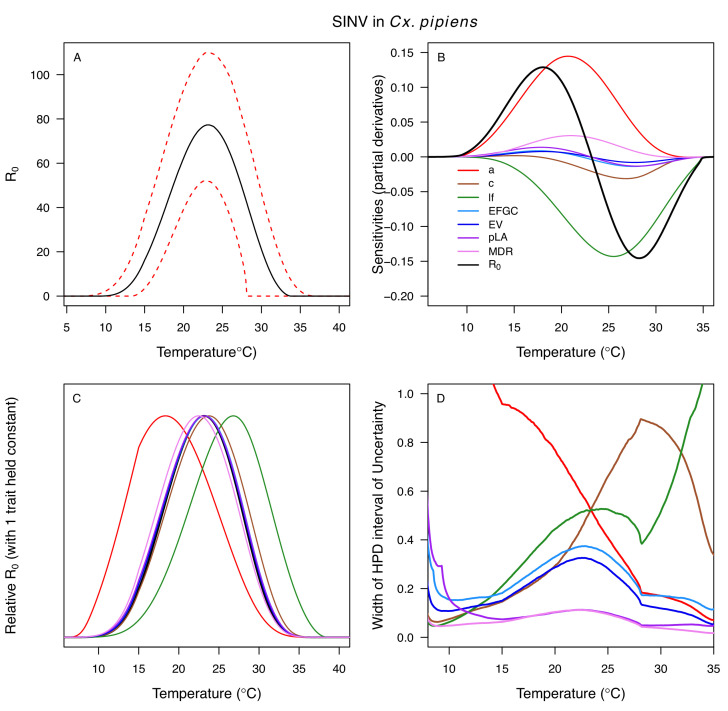
Appendix 1—figure 18. Temperature-dependent R0, sensitivity analyses, and uncertainty analysis for model of Sindbis Virus in Culex pipiens. (A) Median temperature-dependent R0 (black line) with 95% credible intervals (dashed red lines). (B) Sensitivity analysis #1: derivative with respect to temperature for R0 (black) and partial derivatives with respect to temperature for each trait. (C) Sensitivity analysis #2: relative R0 calculated with single traits held constant. (D) Uncertainty analysis using highest posterior density (HPD) interval widths: the proportion of total uncertainty due to each trait. (B–D) Trait colors: biting rate (a, red), infection efficiency (c, brown), adult lifespan (lf, green), fecundity (EFGC, light blue), egg viability (EV, dark blue), larval survival (pLA, purple), and mosquito development rate (MDR, pink). All traits from Cx. pipiens. NOTE: The raw R0 calculation used PDR = 1, which is not biologically reasonable trait value.
Appendix 1—figure 18. Temperature-dependent R0, sensitivity analyses, and uncertainty analysis for model of Sindbis Virus in Culex pipiens. (A) Median temperature-dependent R0 (black line) with 95% credible intervals (dashed red lines). (B) Sensitivity analysis #1: derivative with respect to temperature for R0 (black) and partial derivatives with respect to temperature for each trait. (C) Sensitivity analysis #2: relative R0 calculated with single traits held constant. (D) Uncertainty analysis using highest posterior density (HPD) interval widths: the proportion of total uncertainty due to each trait. (B–D) Trait colors: biting rate (a, red), infection efficiency (c, brown), adult lifespan (lf, green), fecundity (EFGC, light blue), egg viability (EV, dark blue), larval survival (pLA, purple), and mosquito development rate (MDR, pink). All traits from Cx. pipiens. NOTE: The raw R0 calculation used PDR = 1, which is not biologically reasonable trait value.CC BY · PubMed Central
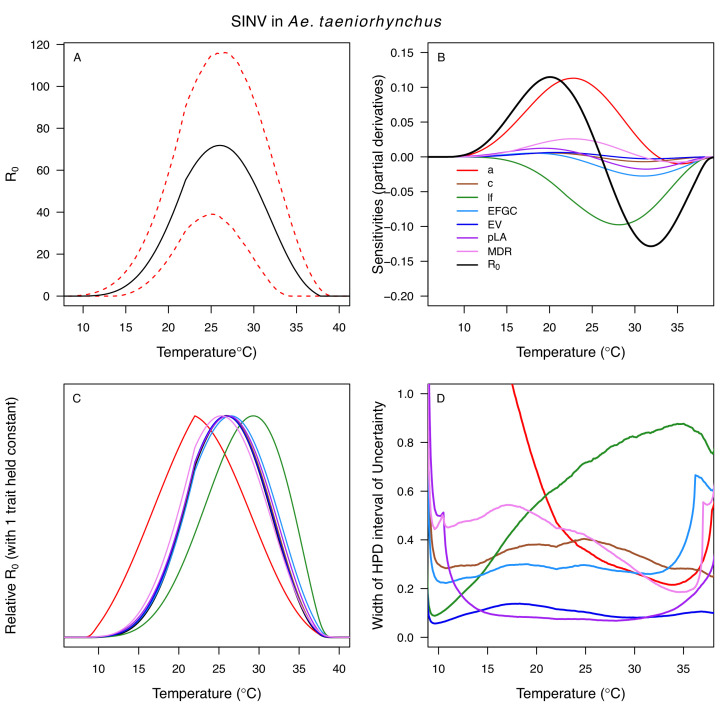
Appendix 1—figure 19. Temperature-dependent R0, sensitivity analyses, and uncertainty analysis for model of Sindbis Virus in Aedes taeniorhynchus. (A) Median temperature-dependent R0 (black line) with 95% credible intervals (dashed red lines). (B) Sensitivity analysis #1: derivative with respect to temperature for R0 (black) and partial derivatives with respect to temperature for each trait. (C) Sensitivity analysis #2: relative R0 calculated with single traits held constant. (D) Uncertainty analysis using highest posterior density (HPD) interval widths: the proportion of total uncertainty due to each trait. (B–D) Trait colors: biting rate (a, red), infection efficiency (c, brown), adult lifespan (lf, green), fecundity (EFGC, light blue), egg viability (EV, dark blue), larval survival (pLA, purple), and mosquito development rate (MDR, pink). Fecundity (EFGC) and biting rate (a) from Culex pipiens; egg viability (EV) and larval traits (pLA and MDR) from Ae. vexans; all other traits from Ae. taeniorhynchus. NOTE: The raw R0 calculation used PDR = 1, which is not biologically reasonable trait value.
Appendix 1—figure 19. Temperature-dependent R0, sensitivity analyses, and uncertainty analysis for model of Sindbis Virus in Aedes taeniorhynchus. (A) Median temperature-dependent R0 (black line) with 95% credible intervals (dashed red lines). (B) Sensitivity analysis #1: derivative with respect to temperature for R0 (black) and partial derivatives with respect to temperature for each trait. (C) Sensitivity analysis #2: relative R0 calculated with single traits held constant. (D) Uncertainty analysis using highest posterior density (HPD) interval widths: the proportion of total uncertainty due to each trait. (B–D) Trait colors: biting rate (a, red), infection efficiency (c, brown), adult lifespan (lf, green), fecundity (EFGC, light blue), egg viability (EV, dark blue), larval survival (pLA, purple), and mosquito development rate (MDR, pink). Fecundity (EFGC) and biting rate (a) from Culex pipiens; egg viability (EV) and larval traits (pLA and MDR) from Ae. vexans; all other traits from Ae. taeniorhynchus. NOTE: The raw R0 calculation used PDR = 1, which is not biologically reasonable trait value.CC BY · PubMed Central
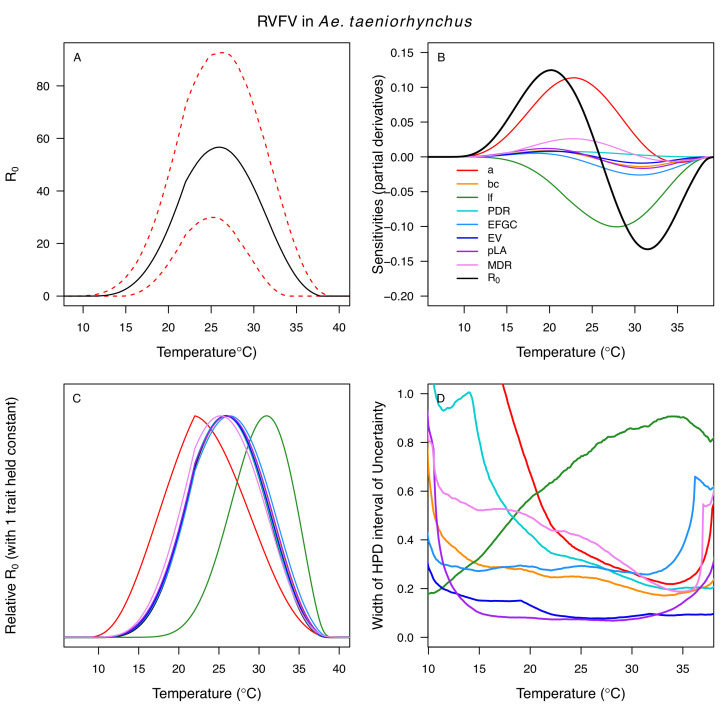
Appendix 1—figure 20. Temperature-dependent R0, sensitivity analyses, and uncertainty analysis for model of Rift Valley Fever Virus in Aedes taeniorhynchus. (A) Median temperature-dependent R0 (black line) with 95% credible intervals (dashed red lines). (B) Sensitivity analysis #1: derivative with respect to temperature for R0 (black) and partial derivatives with respect to temperature for each trait. (C) Sensitivity analysis #2: relative R0 calculated with single traits held constant. (D) Uncertainty analysis using highest posterior density (HPD) interval widths: the proportion of total uncertainty due to each trait. (B–D) Trait colors: biting rate (a, red), vector competence (bc, orange), adult lifespan (lf, green), parasite development rate (PDR, cyan), fecundity (EFGC, light blue), egg viability (EV, dark blue), larval survival (pLA, purple), and mosquito development rate (MDR, pink). Fecundity (EFGC) and biting rate (a) from Culex pipiens; egg viability (EV) from Cx. theileri; larval traits (pLA and MDR) from Ae. vexans; all other traits from Ae. taeniorhynchus.
Appendix 1—figure 20. Temperature-dependent R0, sensitivity analyses, and uncertainty analysis for model of Rift Valley Fever Virus in Aedes taeniorhynchus. (A) Median temperature-dependent R0 (black line) with 95% credible intervals (dashed red lines). (B) Sensitivity analysis #1: derivative with respect to temperature for R0 (black) and partial derivatives with respect to temperature for each trait. (C) Sensitivity analysis #2: relative R0 calculated with single traits held constant. (D) Uncertainty analysis using highest posterior density (HPD) interval widths: the proportion of total uncertainty due to each trait. (B–D) Trait colors: biting rate (a, red), vector competence (bc, orange), adult lifespan (lf, green), parasite development rate (PDR, cyan), fecundity (EFGC, light blue), egg viability (EV, dark blue), larval survival (pLA, purple), and mosquito development rate (MDR, pink). Fecundity (EFGC) and biting rate (a) from Culex pipiens; egg viability (EV) from Cx. theileri; larval traits (pLA and MDR) from Ae. vexans; all other traits from Ae. taeniorhynchus.CC BY · PubMed Central
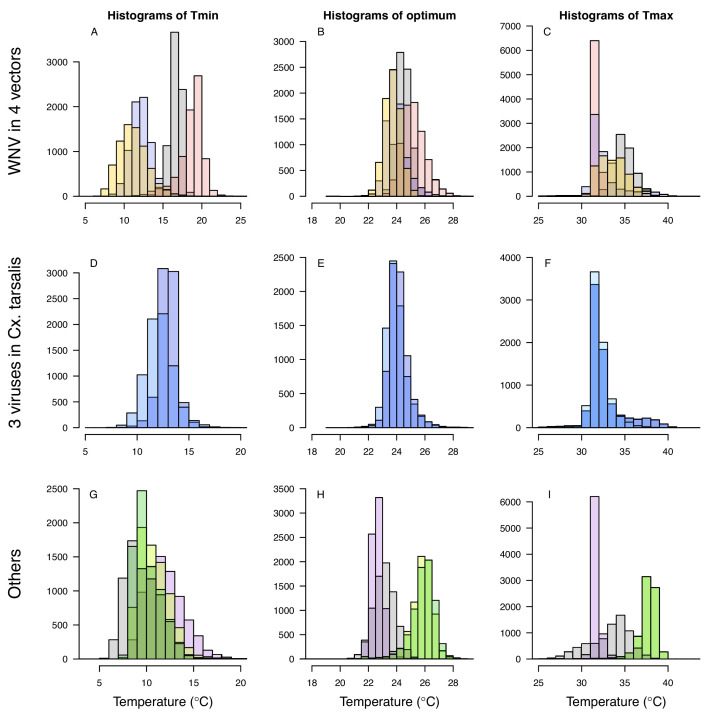
Appendix 1—figure 21. Histograms of Tmin, optimum, and Tmax for transmission (R0) models. Tmin (left column), optimum (center column), and Tmax (right column). Top row (A–C): West Nile virus (WNV) in four vectors: Culex pipiens (grey), Cx. quinquefasciatus (red), Cx. tarsalis (blue), and Cx. univitattus (orange). Middle row (D–F): three viruses in Cx. tarsalis: WNV (same as in top row, bright blue), Western Equine Encephalitis virus (WEEV, light blue), and St. Louis Encephalitis virus (SLEV, dark blue). Bottom row (H–J): Sindbis virus (SINV) in Aedes taeniorhynchus (grey), SINV in Cx. pipiens (dark green), Rift Valley Fever virus (RVFV) in Ae. taeniorhynchus (light green), and Eastern Equine Encephalitis virus (EEEV) in Ae. triseriatus (purple).
Appendix 1—figure 21. Histograms of Tmin, optimum, and Tmax for transmission (R0) models. Tmin (left column), optimum (center column), and Tmax (right column). Top row (A–C): West Nile virus (WNV) in four vectors: Culex pipiens (grey), Cx. quinquefasciatus (red), Cx. tarsalis (blue), and Cx. univitattus (orange). Middle row (D–F): three viruses in Cx. tarsalis: WNV (same as in top row, bright blue), Western Equine Encephalitis virus (WEEV, light blue), and St. Louis Encephalitis virus (SLEV, dark blue). Bottom row (H–J): Sindbis virus (SINV) in Aedes taeniorhynchus (grey), SINV in Cx. pipiens (dark green), Rift Valley Fever virus (RVFV) in Ae. taeniorhynchus (light green), and Eastern Equine Encephalitis virus (EEEV) in Ae. triseriatus (purple).CC BY · PubMed Central
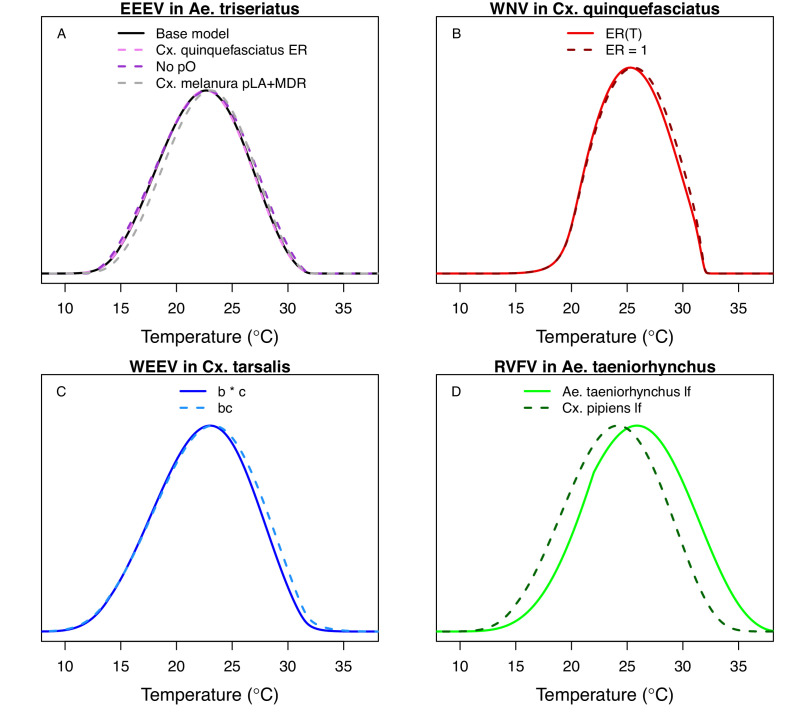
Appendix 1—figure 22. Comparing alternative model parameterizations. Several models had multiple potentially valid choices for traits; we show these alternative models here (dashed lines; base models from main text in solid lines) to show that they make very little difference, except in D. (A) Models for EEEV in Ae. triseriatus with larval traits (larval-to-adult survival [pLA] and mosquito development rate [MDR]) from Ae. triseriatus (violet, from the main text) and larval traits from Cs. melanura (black). We also show larval traits from Cs. melanura without proportion ovipositing (pO) in the model (grey), since the thermal responses for EFCG (eggs per female per gonotrophic cycle, in Cx. pipiens) and ER (eggs per raft, in Cx. quinquefasciatus) were nearly identical even though the units were different, probably because the ER data were not very informative and the priors strongly shaped the thermal response. (B) Models for WNV in Cx. quinquefasciatus, with (light red, from the main text) and without (dark red) the thermal response for fecundity (as eggs per raft, ER), for the same reason as in A. (C) Models for WEEV in Cx. tarsalis with vector competence estimated by infection efficiency (c, Figure 6D) and transmission efficiency (b, Figure 6E) measured separately (blue, from the main text) or by vector competence measured as a single trait (bc, Figure 6F; light blue). (D) Models for RVFV in Ae. taeniorhynchus with lifespan from Ae. taeniorhynchus (light green, from the main text) or from Cx. pipiens (dark green). We chose the Ae. taeniorhynchus version for the main text because it is the same species the infection traits (PDR, bc) were measured in, and that choice strongly impacted the results.
Appendix 1—figure 22. Comparing alternative model parameterizations. Several models had multiple potentially valid choices for traits; we show these alternative models here (dashed lines; base models from main text in solid lines) to show that they make very little difference, except in D. (A) Models for EEEV in Ae. triseriatus with larval traits (larval-to-adult survival [pLA] and mosquito development rate [MDR]) from Ae. triseriatus (violet, from the main text) and larval traits from Cs. melanura (black). We also show larval traits from Cs. melanura without proportion ovipositing (pO) in the model (grey), since the thermal responses for EFCG (eggs per female per gonotrophic cycle, in Cx. pipiens) and ER (eggs per raft, in Cx. quinquefasciatus) were nearly identical even though the units were different, probably because the ER data were not very informative and the priors strongly shaped the thermal response. (B) Models for WNV in Cx. quinquefasciatus, with (light red, from the main text) and without (dark red) the thermal response for fecundity (as eggs per raft, ER), for the same reason as in A. (C) Models for WEEV in Cx. tarsalis with vector competence estimated by infection efficiency (c, Figure 6D) and transmission efficiency (b, Figure 6E) measured separately (blue, from the main text) or by vector competence measured as a single trait (bc, Figure 6F; light blue). (D) Models for RVFV in Ae. taeniorhynchus with lifespan from Ae. taeniorhynchus (light green, from the main text) or from Cx. pipiens (dark green). We chose the Ae. taeniorhynchus version for the main text because it is the same species the infection traits (PDR, bc) were measured in, and that choice strongly impacted the results.CC BY · PubMed Central
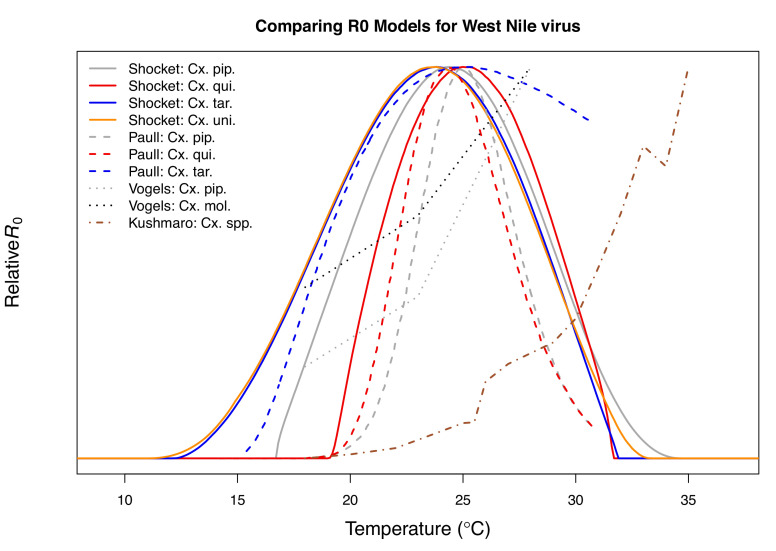
Appendix 1—figure 23. Comparison with previous R0 models for transmission of West Nile virus. Models taken from this paper (solid lines: Cx. pipiens [grey], Cx. quinquefasciatus [red], Cx. tarsalis [blue], and Cx. univittatus [orange]), from Paull et al., 2017 (dashed lines: Cx. pipiens [grey], Cx. quinquefasciatus [red], and Cx. tarsalis [blue]), from Vogels et al., 2017 (Cx. pipiens [grey] and Cx. pipiens molestus [black]), and from Kushmaro et al., 2015 (not species specific, dot-dashed line [brown]).
Appendix 1—figure 23. Comparison with previous R0 models for transmission of West Nile virus. Models taken from this paper (solid lines: Cx. pipiens [grey], Cx. quinquefasciatus [red], Cx. tarsalis [blue], and Cx. univittatus [orange]), from Paull et al., 2017 (dashed lines: Cx. pipiens [grey], Cx. quinquefasciatus [red], and Cx. tarsalis [blue]), from Vogels et al., 2017 (Cx. pipiens [grey] and Cx. pipiens molestus [black]), and from Kushmaro et al., 2015 (not species specific, dot-dashed line [brown]).CC BY · PubMed Central
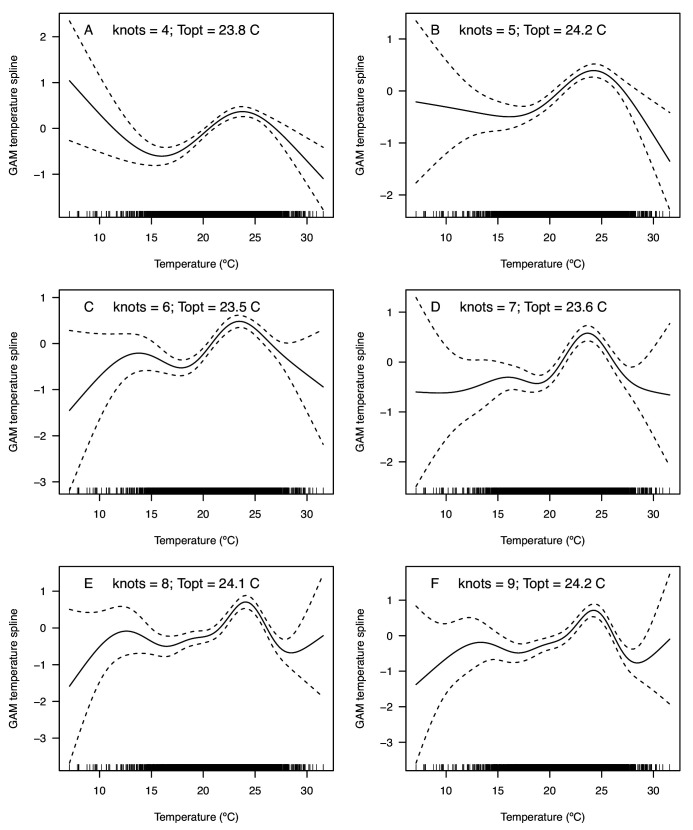
Appendix 1—figure 24. Temperature splines from GAMs of mean incidence (per 1000 people) of West Nile neuroinvasive disease as a function of average summer temperature. (A–F) Models are fit with differing numbers of knots (4–9). In all models, incidence peaks around 24°C (Topt = 23.5–24.2°C).
Appendix 1—figure 24. Temperature splines from GAMs of mean incidence (per 1000 people) of West Nile neuroinvasive disease as a function of average summer temperature. (A–F) Models are fit with differing numbers of knots (4–9). In all models, incidence peaks around 24°C (Topt = 23.5–24.2°C).CC BY · PubMed Central
Appendix 1—figure 25. LOESS models of mean incidence (per 1000 people) of West Nile neuroinvasive disease (2000–2016) as a function of average summer temperature. Points are means for bins of 42 counties (+ / - SE). Lines are locally estimated scatterplot smoothing (LOESS) regression models with different smoothing (span) parameters: 0.1 (red), 0.25 (orange), 0.5 (green), 0.6 (cyan), 0.75 (light blue), 1 (dark blue), and 2 (violet). Models were fit to raw county-level data (n = 3109, binned for visual clarity). The best model (span = 0.6, which appropriately balances overfitting and underfitting the data) estimates that incidence peaks at 23.9°C.
Appendix 1—figure 25. LOESS models of mean incidence (per 1000 people) of West Nile neuroinvasive disease (2000–2016) as a function of average summer temperature. Points are means for bins of 42 counties (+ / - SE). Lines are locally estimated scatterplot smoothing (LOESS) regression models with different smoothing (span) parameters: 0.1 (red), 0.25 (orange), 0.5 (green), 0.6 (cyan), 0.75 (light blue), 1 (dark blue), and 2 (violet). Models were fit to raw county-level data (n = 3109, binned for visual clarity). The best model (span = 0.6, which appropriately balances overfitting and underfitting the data) estimates that incidence peaks at 23.9°C.CC BY · PubMed Central
Appendix 1—figure 26. Raw county-level data (n = 3109) for mean incidence (per 1000 people) of neuroinvasive West Nile disease (2000–2016) as a function of average summer temperature.
Appendix 1—figure 26. Raw county-level data (n = 3109) for mean incidence (per 1000 people) of neuroinvasive West Nile disease (2000–2016) as a function of average summer temperature.CC BY · PubMed Central

Verification

Claims the paper makes

The claims and statistics of this paper haven’t been checked yet.

Run the check — free, no account needed. It reads the open-access text and checks the sources it cites.

A few free checks a day · papers already verified open instantly · results are public

Claims other papers make about this one

Each is checked against this paper’s own text: does it say what the citing paper says it does?

Self-check

Percentages, sums and reported differences re-computed from the paper’s own numbers.

The self-check needs the paper’s full text.

Citations

Cites

Show all 149 references

Research works printed but not linked: 11

  1. Bates S. 2019. CNN Sans. Rare Eastern Equine Encephalitis Has Killed 9 People in the U.S. in 2019.
  2. Centers for Disease Control and Prevention. 2018a. Centers for Disease Control and Prevention. St. Louis Encephalitis: Statistics and Maps.
  3. Centers for Disease Control and Prevention. 2018b. American Society for Microbiology. Eastern Equine Encephalitis: Epidemiology& Geographic Distribution.
  4. Centers for Disease Control and Prevention. 2018c. Centers for Disease Control and Prevention. West Nile Virus: Final Cumulative Maps &Data for 1999-2017.
  5. European Centre for Disease Prevention and Control. 2018. European Centre for Disease Prevention and Control. Surveillance and Disease Data for West Nile Fever.
  6. Government of Canada. 2018. Government of Canada. Surveillance of West Nile Virus.
  7. Hijmans RJ. 2020. raster: Geographic data analysis and modeling. R Package. 2.2.31. https://rdrr.io/cran/raster/.
  8. Kiarie-Makara, 2015, Effects of temperature on the growth and development of culex pipiens Complex Mosquitoes (Diptera: Culicidae), Journal of Pharmacy and Biological Sciences, 10, 1, 10.9790/3008-10620110 · DOI
  9. Shocket, 2020, Environmental Drivers of Vector-Borne Disease Population Biology of Vector-Borne Diseases
  10. Su Y-S, Yajima M. 2009. R2jags: A Package for Running Jags From R. 0.6-1. https://rdrr.io/cran/R2jags/.
  11. World Meteorological Organization. 2009. World Meteorological Organization. Handbook on CLIMAT and CLIMAT TEMP Reporting, 2009 Edition.

Cited by

Sorted by citations

Metadata

Authors
Shocket, M. S., Verwillow, A. B., Numazu, M. G., Slamani, H., Cohen, J. M., El Moustaid, F., Rohr, J., Johnson, L. R., & Mordecai, E. A.
Affiliations
  • University of California, Los Angeles (US)
  • Stanford University (US)
  • Virginia Tech (US)
  • University of Wisconsin–Madison (US)
  • Department of Biological Sciences, Virginia Polytechnic Institute and State University (Virginia Tech), Blacksburg, United States
  • University of Notre Dame (US)
Corresponding author
Shocket, Marta S
Venue
eLife
Published
2020-09-15
Volume
9
ISSN
2050-084X (ISSN-L)
OpenAlex
W3084581047
Cited by
192
References
149
Citations by year
2026: 42 · 2025: 36 · 2024: 34 · 2023: 29 · 2022: 26 · 2021: 22 · 2020: 3
FWCI
15.00
Type
journal article
Language
en
Open access
Locations
  • eLife (publishedVersion, cc-by)
  • PubMed Central (publishedVersion, cc-by)
  • PubMed (publishedVersion)
  • Digital Commons - University of South Florida (University of South Florida) (submittedVersion, cc-by)
  • DOAJ (DOAJ: Directory of Open Access Journals) (submittedVersion, cc-by-sa)
  • Lancaster EPrints (Lancaster University) (submittedVersion)
  • Figshare (submittedVersion, cc-by)
  • VTechWorks (Virginia Tech) (submittedVersion, cc-by)
Funders
  • National Science Foundation (DEB-1518681, DMS-1750113)
  • National Institutes of Health (NIGMS R35 MIRA: 1R35GM133439-01)
Topics
  • Health Sciences › Medicine › Public Health, Environmental and Occupational Health › Mosquito-borne diseases and control
  • Physical Sciences › Environmental Science › Health, Toxicology and Mutagenesis › Climate Change and Health Impacts
  • Life Sciences › Immunology and Microbiology › Parasitology › Vector-borne infectious diseases
Keywords
West Nile virus, mosquito-borne viruses, temperature-dependent transmission, thermal optimum, thermal breadth, Culex pipiens, Culex tarsalis, eastern equine encephalitis virus, western equine encephalitis virus, St. Louis encephalitis virus, Sindbis virus, Rift Valley fever virus, climate change, vector-pathogen interactions, summer temperature
MeSH terms
Mosquito Vectors, Animals, Arbovirus Infections, Arboviruses, Culex, Models, Biological, Temperature, United States, West Nile Fever, West Nile virus

About these checks

Registry, retraction, Cites and statistics results are computed, not judged, with one exception: a printed reference that no index lists is read once by a model before it counts as a citation error. Claims are extracted by a model and kept only when their quote appears verbatim in the text; each cited source is then checked, with a model’s help, for whether it says what the claim relies on. Those verdicts can be wrong — read the claim’s quote and the cited source before relying on one.

Statistics and arithmetic are recomputed, not judged.

Confidence bands are shown only for fields calibrated on our annotated test set. None is calibrated yet, so no band is shown.

What counts as a claim ›How we measure confidence ›How we check this ›

Are you an author, or do you see a problem with this page? Request a review