

The DOI matches its Crossref record; 65 of the 66 references it cites were found in a registry or an index; none of the 30 sources its claims cite is checked for support yet.
Sampling alternative conformational states of transporters and receptors with AlphaFold2
Open accessPublished version of a preprint
Abstract
Equilibrium fluctuations and triggered conformational changes often underlie the functional cycles of membrane proteins. For example, transporters mediate the passage of molecules across cell membranes by alternating between inward- and outward-facing states, while receptors undergo intracellular structural rearrangements that initiate signaling cascades. Although the conformational plasticity of these proteins has historically posed a challenge for traditional de novo protein structure prediction pipelines, the recent success of AlphaFold2 (AF2) in CASP14 culminated in the modeling of a transporter in multiple conformations to high accuracy. Given that AF2 was designed to predict static structures of proteins, it remains unclear if this result represents an underexplored capability to accurately predict multiple conformations and/or structural heterogeneity. Here, we present an approach to drive AF2 to sample alternative conformations of topologically diverse transporters and G-protein-coupled receptors that are absent from the AF2 training set. Whereas models of most proteins generated using the default AF2 pipeline are conformationally homogeneous and nearly identical to one another, reducing the depth of the input multiple sequence alignments by stochastic subsampling led to the generation of accurate models in multiple conformations. In our benchmark, these conformations spanned the range between two experimental structures of interest, with models at the extremes of these conformational distributions observed to be among the most accurate (average template modeling score of 0.94). These results suggest a straightforward approach to identifying native-like alternative states, while also highlighting the need for the next generation of deep learning algorithms to be designed to predict ensembles of biophysically relevant states.
Overview
AI snapshot
Written from the paper’s full text.
TL;DR
Reducing the depth of input MSAs by stochastic subsampling drives AlphaFold2 to sample alternative, native-like conformations of transporters and GPCRs whose structures were absent from its training set. The approach recovers experimentally observed inward/outward or inactive/active states, but it is a methodological “hack” with limited success for proteins already represented in the AF2 training set.
Key findings
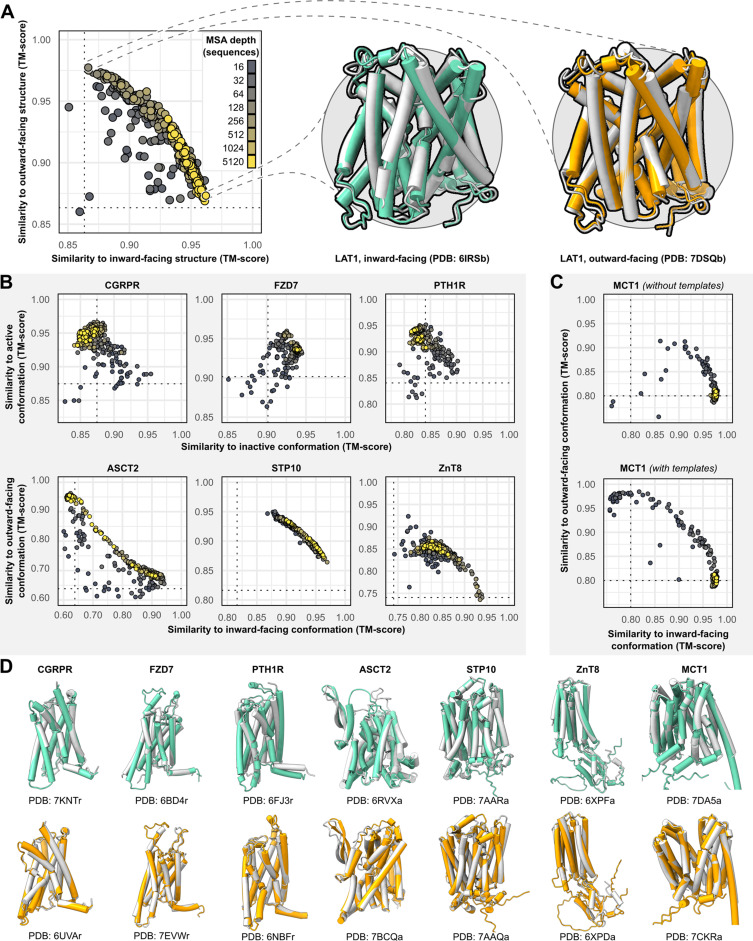
- For all eight benchmark targets—five transporters (LAT1, ZnT8, MCT1, STP10, ASCT2) and three GPCRs (CGRPR, PTH1R, FZD7)—accurate models of at least one conformation were obtained (TM score ≥0.9), and both conformations could be predicted with shallow MSAs.
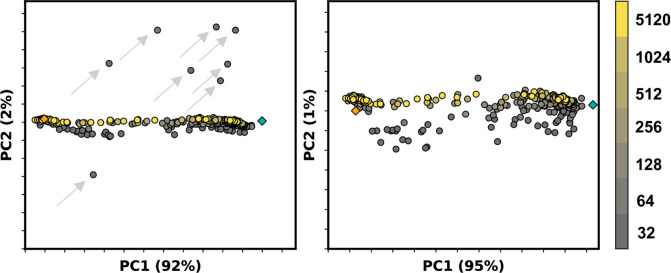
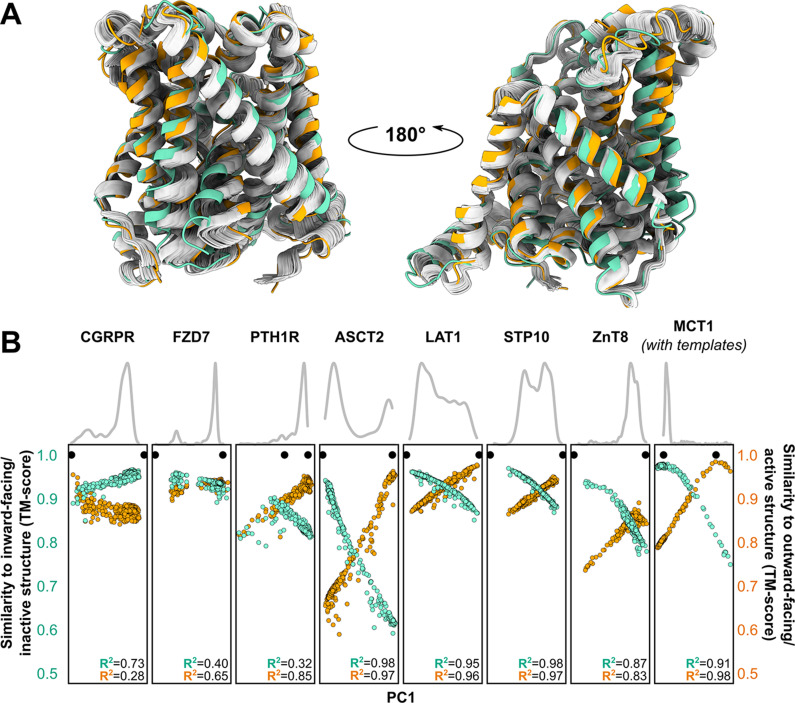
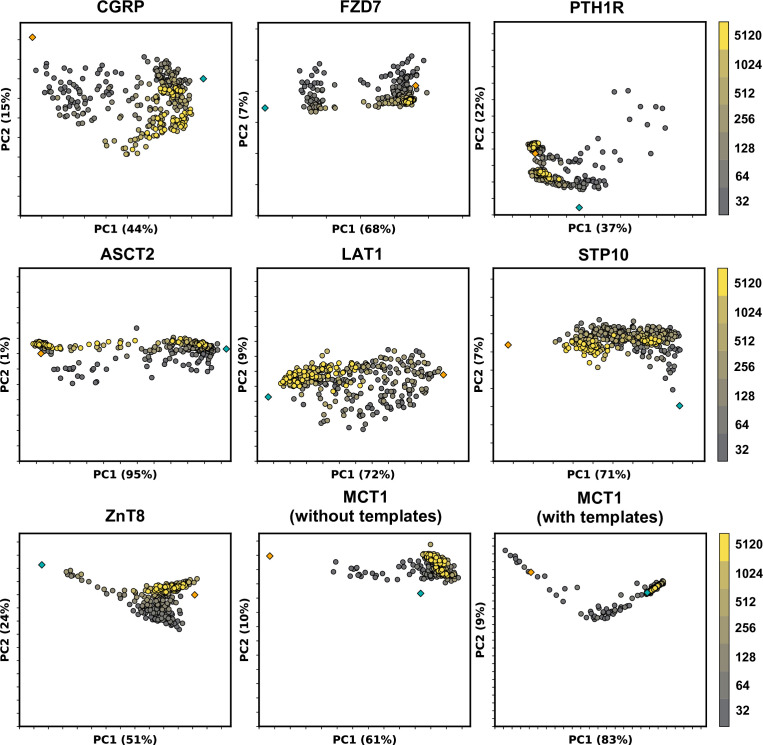
- Models at the extremes of the first principal component (PC1) were among the most accurate: average TM score was 0.94 for the top 1, top 3, and top 10 PC1 models; PC1 captured 64.9% ± 16.1% of structural variation among models generated with MSAs of 32 or more sequences.
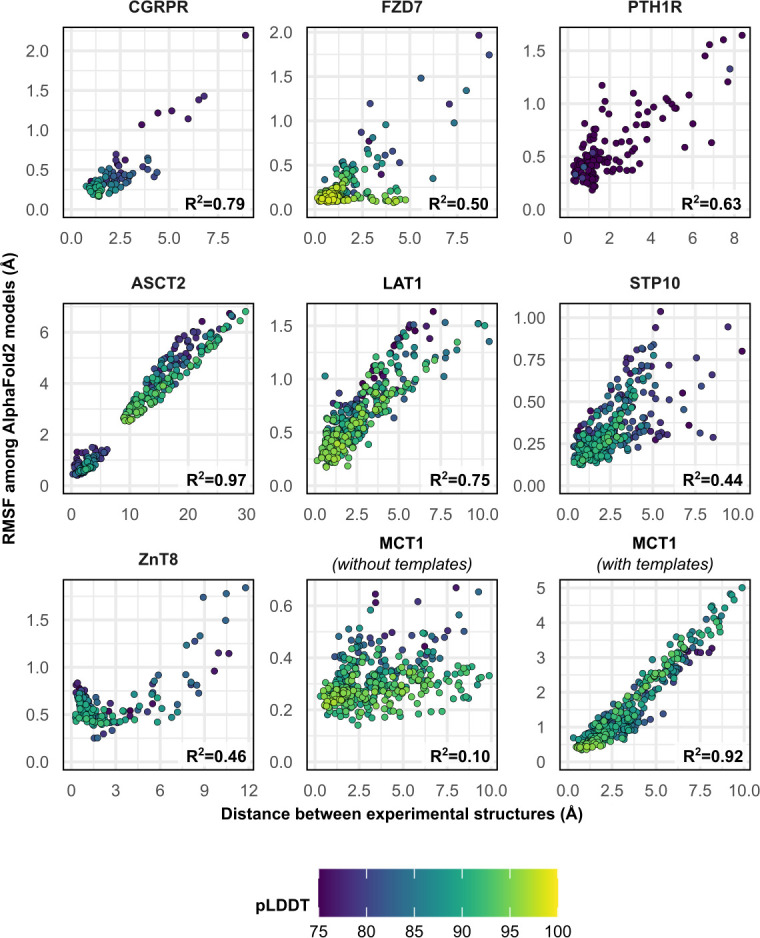
- Predicted structural fluctuations correlated with experimental conformational changes for ASCT2, LAT1, CGRPR, and MCT1 with templates (R² ≥ 0.75); Pearson correlation between PC1 and TM score exceeded 0.8 for all transporters.
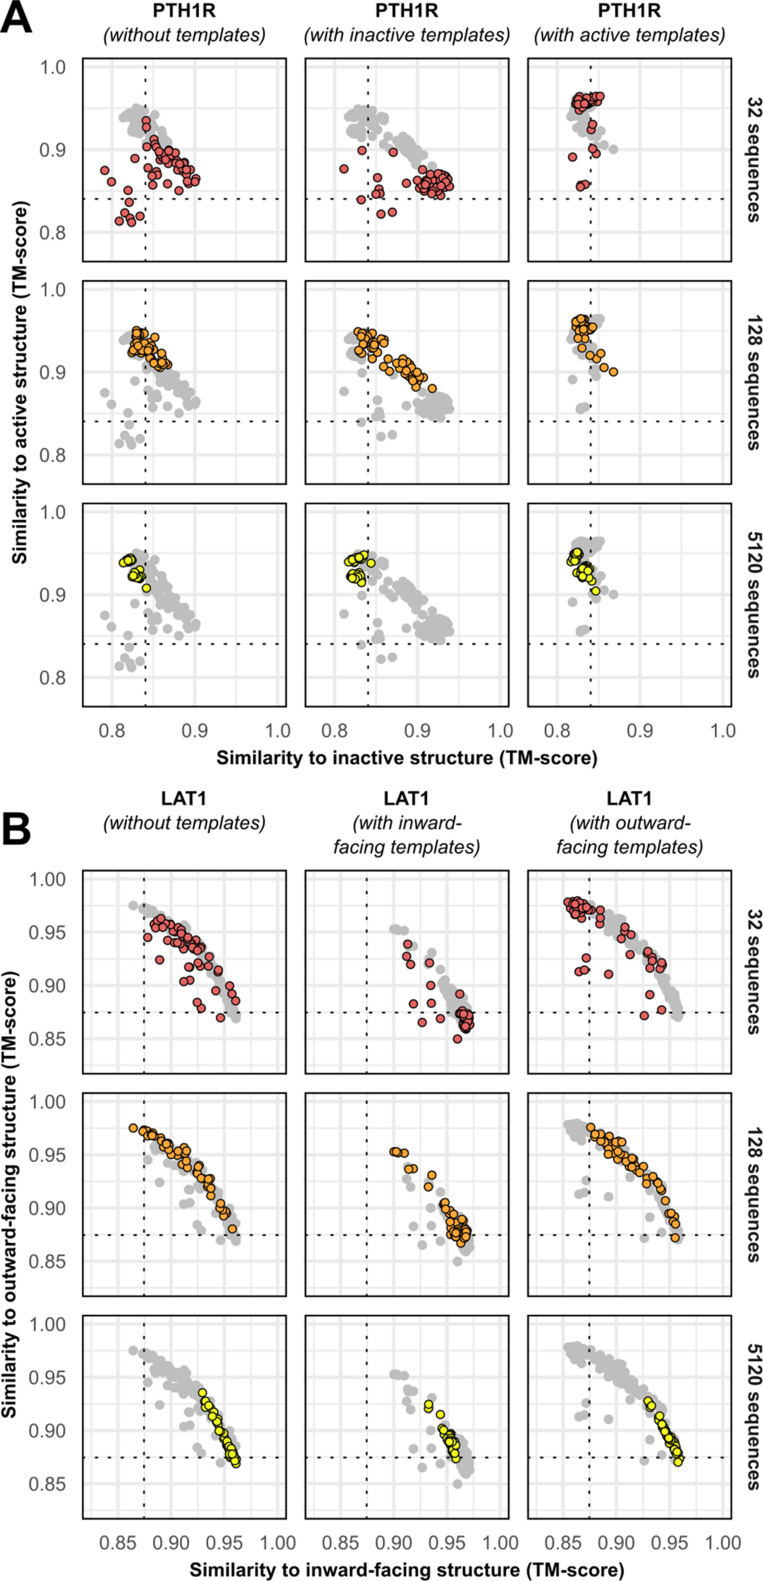
- MCT1 was an exception: over 99% of template-free models had TM ≥0.9 to the inward-facing structure and <0.9 to the outward-facing structure regardless of MSA depth; accurate outward-facing models required templates and MSAs of 16–32 sequences.
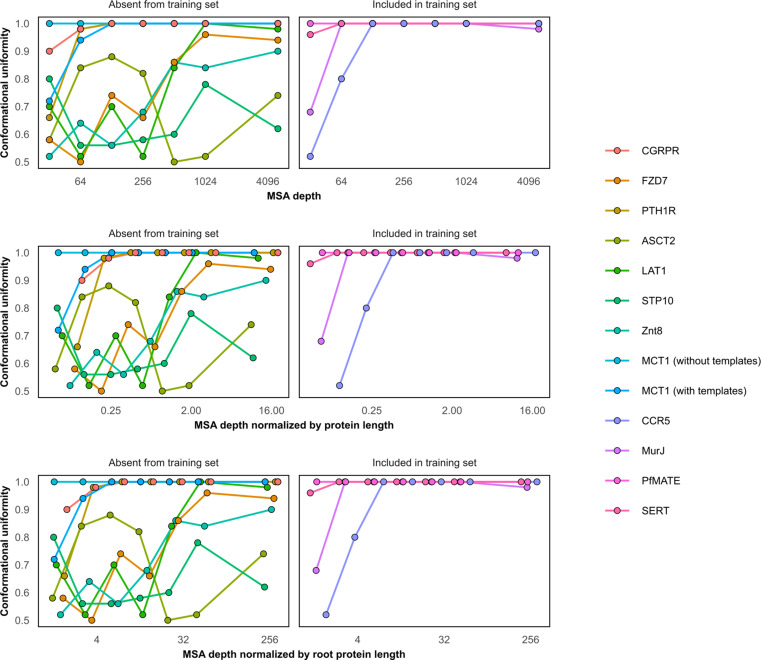
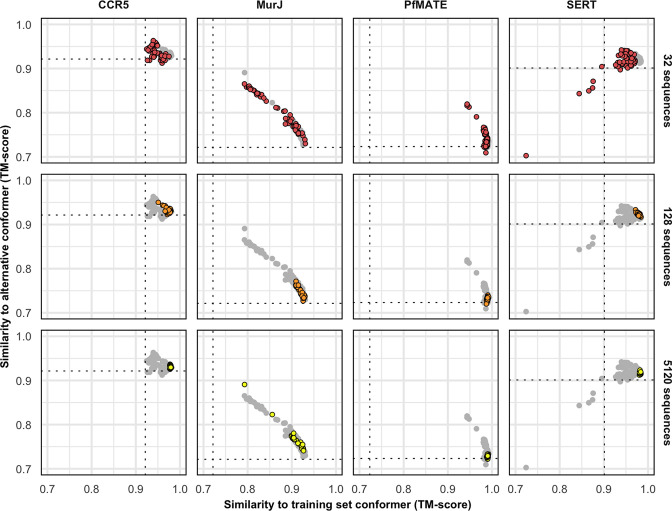
- For four proteins with at least one conformation in the AF2 training set (CCR5, SERT, PfMATE, MurJ), conformational diversity was far more limited, and none adopted the alternative conformer.
Methods
- AF2 v2.0.1 with modified ColabFold was used; MSAs were generated with MMseqs2, template search was disabled except for explicit template-based tests, recycles were set to one, and final MD refinement was skipped.
- For template-free predictions, all five neural networks were used, with 10 predictions per network per MSA size, yielding 50 models per protein per MSA depth; MSA depth was controlled via `max_msa_clusters` and `max_extra_msa`.
- Benchmark set: eight membrane proteins absent from the PDB before April 30, 2018 and determined in two or more conformations, plus four proteins with at least one conformation in the AF2 training set; structural similarity was assessed by TM-align, and PCA/RMSF were calculated in CPPTRAJ with loop residues omitted from PCA.
Limitations
- Stated: the approach is a methodological “hack,” not an explicit AF2 objective; AF2 likely does not learn energy landscapes, does not account for the lipid environment, and showed limited success for proteins whose structures were in the training set.
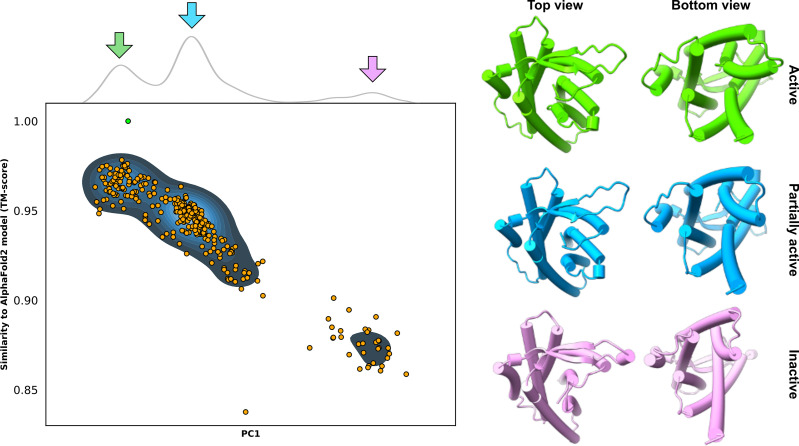
- Stated: optimal MSA depth and template choice varied by protein, with no one-size-fits-all solution; the GPR114/ADGRG5 predictions require experimental validation.
- Evident from the text: the benchmark is small (eight targets plus four training-set proteins), validation depends on already-known experimental structures, and the authors skipped the final MD simulation to reduce computational cost.
Model-written summary. Check it against the paper before relying on it.
Integrity signals
Registry
Cites
Statistics
Figures
Verification
Claims the paper makes
30 Own result · 15 Not checked yet · 14 Own interpretation · 4 Own method · 4 No basis given
A result the paper reports from its own data — it cites no other source for it, so there is none to check. The quote shows it is in the paper.
In the paper
“the first principal component (PC1) captured 64.9% ± 16.1% of the structural variations among the models generated using MSAs with 32 or more sequences”
§ Sampling alternative conformational states of transporters and receptors with AlphaFold2 > Results and discussion > Distributions of predicted models relative to the experimental structures
plaincorrelational- Asserted: passes — The authors put it forward as true.
- Checkable: passes — It can be checked against evidence.
- Load-bearing: passes — The paper’s conclusions depend on it.
- Based: passes — The paper gives a reason why it holds.
The paper states this without a source or data behind it here, so there is nothing to check it against. The quote shows it is in the paper.
In the paper
“this approach showed limited success when applied to transporters whose structures were used to train AF2”
§ Sampling alternative conformational states of transporters and receptors with AlphaFold2 > Results and discussion > Concluding remarks: proposed workflow and future directions
plain- Asserted: passes — The authors put it forward as true.
- Checkable: passes — It can be checked against evidence.
- Load-bearing: passes — The paper’s conclusions depend on it.
- Based: passes — The paper gives a reason why it holds.
A result the paper reports from its own data — it cites no other source for it, so there is none to check. The quote shows it is in the paper.
In the paper
“In every case, a correlation was evident between each model’s PC1 values and their TM scores.”
§ Sampling alternative conformational states of transporters and receptors with AlphaFold2 > Results and discussion > Distributions of predicted models relative to the experimental structures
plaincorrelational- Asserted: passes — The authors put it forward as true.
- Checkable: passes — It can be checked against evidence.
- Load-bearing: passes — The paper’s conclusions depend on it.
- Based: passes — The paper gives a reason why it holds.
A result the paper reports from its own data — it cites no other source for it, so there is none to check. The quote shows it is in the paper.
In the paper
“No general pattern was readily apparent regarding the ideal MSA depth required to achieve this balance, even when accounting for sequence length of the target”
§ Sampling alternative conformational states of transporters and receptors with AlphaFold2 > Results and discussion > AF2 generates multiple conformations of all eight target proteins
plain- Asserted: passes — The authors put it forward as true.
- Checkable: passes — It can be checked against evidence.
- Load-bearing: unclear — It is unclear whether the paper’s conclusions depend on it.
- Based: passes — The paper gives a reason why it holds.
A result the paper reports from its own data — it cites no other source for it, so there is none to check. The quote shows it is in the paper.
In the paper
“Correlation between these two measures was observed in most cases and was notable for ASCT2, LAT1, CGRPR, and MCT1 with templates (R2 ≥ 0.75).”
§ Sampling alternative conformational states of transporters and receptors with AlphaFold2 > Results and discussion > Predicted conformational fluctuations correlate with implied conformational dynamics
plaincorrelational- Asserted: passes — The authors put it forward as true.
- Checkable: passes — It can be checked against evidence.
- Load-bearing: passes — The paper’s conclusions depend on it.
- Based: passes — The paper gives a reason why it holds.
A result the paper reports from its own data — it cites no other source for it, so there is none to check. The quote shows it is in the paper.
In the paper
“MSAs with hundreds or thousands of sequences were generally observed to engender tighter clustering in conformations specific to each protein.”
§ Sampling alternative conformational states of transporters and receptors with AlphaFold2 > Results and discussion > AF2 generates multiple conformations of all eight target proteins
hedgeddirect- Asserted: passes — The authors put it forward as true.
- Checkable: passes — It can be checked against evidence.
- Load-bearing: passes — The paper’s conclusions depend on it.
- Based: passes — The paper gives a reason why it holds.
A result the paper reports from its own data — it cites no other source for it, so there is none to check. The quote shows it is in the paper.
In the paper
“The conformational diversity of these models, including those generated using shallow MSAs, was far more limited than what was generally observed for the proteins discussed above, with the exception of MCT1”
§ Sampling alternative conformational states of transporters and receptors with AlphaFold2 > Results and discussion > Limited conformational sampling is observed for proteins with structures in the AF2 training set
plain- Asserted: passes — The authors put it forward as true.
- Checkable: passes — It can be checked against evidence.
- Load-bearing: passes — The paper’s conclusions depend on it.
- Based: passes — The paper gives a reason why it holds.
A result the paper reports from its own data — it cites no other source for it, so there is none to check. The quote shows it is in the paper.
In the paper
“Moreover, the experimental structures virtually always flanked the AF2 models along PC1.”
§ Sampling alternative conformational states of transporters and receptors with AlphaFold2 > Results and discussion > Distributions of predicted models relative to the experimental structures
plaincorrelational- Asserted: passes — The authors put it forward as true.
- Checkable: passes — It can be checked against evidence.
- Load-bearing: passes — The paper’s conclusions depend on it.
- Based: passes — The paper gives a reason why it holds.
A result the paper reports from its own data — it cites no other source for it, so there is none to check. The quote shows it is in the paper.
In the paper
“The increased diversity coincided with the generation of misfolded or outlier models.”
§ Sampling alternative conformational states of transporters and receptors with AlphaFold2 > Results and discussion > AF2 generates multiple conformations of all eight target proteins
plaincorrelational- Asserted: passes — The authors put it forward as true.
- Checkable: passes — It can be checked against evidence.
- Load-bearing: passes — The paper’s conclusions depend on it.
- Based: passes — The paper gives a reason why it holds.
A result the paper reports from its own data — it cites no other source for it, so there is none to check. The quote shows it is in the paper.
In the paper
“comparison of PC1/PC2 values suggested that the predicted dynamics deviate from simple interpolation of two end states”
§ Sampling alternative conformational states of transporters and receptors with AlphaFold2 > Results and discussion > Distributions of predicted models relative to the experimental structures
hedged- Asserted: passes — The authors put it forward as true.
- Checkable: passes — It can be checked against evidence.
- Load-bearing: passes — The paper’s conclusions depend on it.
- Based: passes — The paper gives a reason why it holds.
- It may state two separate claims as one. 16
- Probably not a substantial claim. 9
- The quote only partly states this claim. 1
A result the paper reports from its own data — it cites no other source for it, so there is none to check. The quote shows it is in the paper.
In the paper
“Indeed, the models with the most extreme PC1 values were also among the most accurate: average TM scores were 0.94 for the top 1, top 3, and top 10 PC1 models”
§ Sampling alternative conformational states of transporters and receptors with AlphaFold2 > Results and discussion > Distributions of predicted models relative to the experimental structures
plaincorrelational- Asserted: passes — The authors put it forward as true.
- Checkable: passes — It can be checked against evidence.
- Load-bearing: passes — The paper’s conclusions depend on it.
- Based: passes — The paper gives a reason why it holds.
It may state two separate claims as one.
A result the paper reports from its own data — it cites no other source for it, so there is none to check. The quote shows it is in the paper.
In the paper
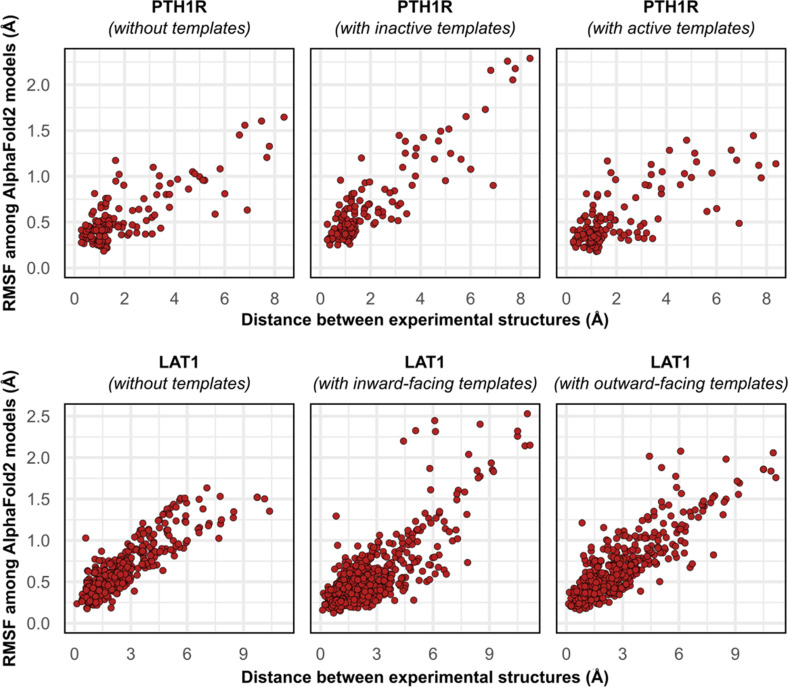
“Similar results were observed when we modeled PTH1R using either inactive or active templates, as well as LAT1 using either OF or IF templates”
§ Sampling alternative conformational states of transporters and receptors with AlphaFold2 > Results and discussion > AF2 generates multiple conformations of all eight target proteins
plain- Asserted: passes — The authors put it forward as true.
- Checkable: passes — It can be checked against evidence.
- Load-bearing: passes — The paper’s conclusions depend on it.
- Based: passes — The paper gives a reason why it holds.
It may state two separate claims as one.
A result the paper reports from its own data — it cites no other source for it, so there is none to check. The quote shows it is in the paper.
In the paper
“Increasing the depth of subsampled MSAs had the desirable effect of eliminating these models, while also limiting the extent to which alternative conformations were sampled.”
§ Sampling alternative conformational states of transporters and receptors with AlphaFold2 > Results and discussion > AF2 generates multiple conformations of all eight target proteins
plaindirect- Asserted: passes — The authors put it forward as true.
- Checkable: passes — It can be checked against evidence.
- Load-bearing: passes — The paper’s conclusions depend on it.
- Based: passes — The paper gives a reason why it holds.
It may state two separate claims as one.
A result the paper reports from its own data — it cites no other source for it, so there is none to check. The quote shows it is in the paper.
In the paper
“One target, MCT1, was exclusively modeled by AF2 in either inward-facing (IF) or fully occluded conformations; over 99% of the models had TM scores of ≥0.9 and <0.9 to the IF and outward-facing (OF) structures, respectively, regardless of MSA depth.”
§ Sampling alternative conformational states of transporters and receptors with AlphaFold2 > Results and discussion > AF2 generates multiple conformations of all eight target proteins
plainSingle case- Asserted: passes — The authors put it forward as true.
- Checkable: passes — It can be checked against evidence.
- Load-bearing: passes — The paper’s conclusions depend on it.
- Based: passes — The paper gives a reason why it holds.
It may state two separate claims as one.
A result the paper reports from its own data — it cites no other source for it, so there is none to check. The quote shows it is in the paper.
In the paper
“misfolded models virtually never coclustered and could thus be identified and excluded from further analysis”
§ Sampling alternative conformational states of transporters and receptors with AlphaFold2 > Results and discussion > AF2 generates multiple conformations of all eight target proteins
hedged- Asserted: passes — The authors put it forward as true.
- Checkable: passes — It can be checked against evidence.
- Load-bearing: passes — The paper’s conclusions depend on it.
- Based: passes — The paper gives a reason why it holds.
It may state two separate claims as one.
A result the paper reports from its own data — it cites no other source for it, so there is none to check. The quote shows it is in the paper.
In the paper
“The inclusion of templates restored this correlation in MCT1 but contributed negligibly to those of PTH1R and LAT1”
§ Sampling alternative conformational states of transporters and receptors with AlphaFold2 > Results and discussion > Predicted conformational fluctuations correlate with implied conformational dynamics
plaindirect- Asserted: passes — The authors put it forward as true.
- Checkable: passes — It can be checked against evidence.
- Load-bearing: unclear — It is unclear whether the paper’s conclusions depend on it.
- Based: passes — The paper gives a reason why it holds.
It may state two separate claims as one.
A result the paper reports from its own data — it cites no other source for it, so there is none to check. The quote shows it is in the paper.
In the paper
“In our benchmark, these conformations spanned the range between two experimental structures of interest, with models at the extremes of these conformational distributions observed to be among the most accurate (average template modeling score of 0.94).”
§ Sampling alternative conformational states of transporters and receptors with AlphaFold2 > Abstract
plaincorrelational- Asserted: passes — The authors put it forward as true.
- Checkable: passes — It can be checked against evidence.
- Load-bearing: passes — The paper’s conclusions depend on it.
- Based: passes — The paper gives a reason why it holds.
It may state two separate claims as one.
A result the paper reports from its own data — it cites no other source for it, so there is none to check. The quote shows it is in the paper.
In the paper
“Accurate OF models were obtained only with MSAs containing 16–32 sequences and constituted a minor population in an ensemble dominated by IF models.”
§ Sampling alternative conformational states of transporters and receptors with AlphaFold2 > Results and discussion > AF2 generates multiple conformations of all eight target proteins
plaindirect- Asserted: passes — The authors put it forward as true.
- Checkable: passes — It can be checked against evidence.
- Load-bearing: passes — The paper’s conclusions depend on it.
- Based: passes — The paper gives a reason why it holds.
It may state two separate claims as one.
The paper states this without a source or data behind it here, so there is nothing to check it against. The quote shows it is in the paper.
In the paper
“Whereas models of most proteins generated using the default AF2 pipeline are conformationally homogeneous and nearly identical to one another”
§ Sampling alternative conformational states of transporters and receptors with AlphaFold2 > Abstract
plain- Asserted: passes — The authors put it forward as true.
- Checkable: passes — It can be checked against evidence.
- Load-bearing: passes — The paper’s conclusions depend on it.
- Based: fails — The paper may give no reason why it holds.
Probably not a substantial claim. The paper may give no reason why it holds.
The paper states this without a source or data behind it here, so there is nothing to check it against. The quote shows it is in the paper.
In the paper
“while models of CCR5 were less biased toward the training set conformation, deep MSAs reduced conformational diversity.”
§ Sampling alternative conformational states of transporters and receptors with AlphaFold2 > Results and discussion > Limited conformational sampling is observed for proteins with structures in the AF2 training set
plaindirect- Asserted: passes — The authors put it forward as true.
- Checkable: passes — It can be checked against evidence.
- Load-bearing: passes — The paper’s conclusions depend on it.
- Based: passes — The paper gives a reason why it holds.
It may state two separate claims as one.
A result the paper reports from its own data — it cites no other source for it, so there is none to check. The quote shows it is in the paper.
In the paper
“because the optimal MSA depth and choice of templates varied for each protein”
§ Sampling alternative conformational states of transporters and receptors with AlphaFold2 > Results and discussion > AF2 generates multiple conformations of all eight target proteins
plain- Asserted: passes — The authors put it forward as true.
- Checkable: passes — It can be checked against evidence.
- Load-bearing: passes — The paper’s conclusions depend on it.
- Based: passes — The paper gives a reason why it holds.
It may state two separate claims as one.
None of the sources cited for this claim have been checked yet.
In the paper
“Upon examining the list of CASP14 targets and corresponding models, we found that AF2 modeled the multidrug transporter LmrP (target T1024) in multiple conformations, two of which were individually consistent with published experimental data”
§ Sampling alternative conformational states of transporters and receptors with AlphaFold2 > Introduction
What the sources say
- Not checked yetcites Jumper et al., 2021b
- Not checked yetcites Del Alamo et al., 2021a
- Not checked yetcites Debruycker et al., 2020 source
plainSingle case- Asserted: passes — The authors put it forward as true.
- Checkable: passes — It can be checked against evidence.
- Load-bearing: passes — The paper’s conclusions depend on it.
- Based: passes — The paper gives a reason why it holds.
It may state two separate claims as one.
A result the paper reports from its own data — it cites no other source for it, so there is none to check. The quote shows it is in the paper.
In the paper
“reducing the depth of the input multiple sequence alignments by stochastic subsampling led to the generation of accurate models in multiple conformations.”
§ Sampling alternative conformational states of transporters and receptors with AlphaFold2 > Abstract
plaindirect- Asserted: passes — The authors put it forward as true.
- Checkable: passes — It can be checked against evidence.
- Load-bearing: passes — The paper’s conclusions depend on it.
- Based: passes — The paper gives a reason why it holds.
The quote only partly states this claim.
A result the paper reports from its own data — it cites no other source for it, so there is none to check. The quote shows it is in the paper.
In the paper
“Although conformational diversity was demonstrated to a limited extent by the generation of occluded models of MurJ and PfMATE, none of the models observed adopted the alternative conformer.”
§ Sampling alternative conformational states of transporters and receptors with AlphaFold2 > Results and discussion > Limited conformational sampling is observed for proteins with structures in the AF2 training set
plain- Asserted: passes — The authors put it forward as true.
- Checkable: passes — It can be checked against evidence.
- Load-bearing: passes — The paper’s conclusions depend on it.
- Based: passes — The paper gives a reason why it holds.
It may state two separate claims as one.
A conclusion the paper draws from its own results — it cites no other source for it, so there is none to check. The quote shows it is in the paper.
In the paper
“Accurate representatives of distinct conformers were generally obtainable with exhaustive sampling and could be identified by performing PCA and selecting models at the extreme positions of PC1.”
§ Sampling alternative conformational states of transporters and receptors with AlphaFold2 > Results and discussion > Concluding remarks: proposed workflow and future directions
plaindirect- Asserted: passes — The authors put it forward as true.
- Checkable: passes — It can be checked against evidence.
- Load-bearing: passes — The paper’s conclusions depend on it.
- Based: passes — The paper gives a reason why it holds.
It may state two separate claims as one.
None of the sources cited for this claim have been checked yet.
In the paper
“hinting at the possibility that traditional methods may still be required to capture alternative conformers”
§ Sampling alternative conformational states of transporters and receptors with AlphaFold2 > Results and discussion > Concluding remarks: proposed workflow and future directions
What the sources say
- Not checked yetcites Crawley et al., 2011
- Not checked yetcites Ollikainen et al., 2013
hedgedconditional- Asserted: passes — The authors put it forward as true.
- Checkable: passes — It can be checked against evidence.
- Load-bearing: passes — The paper’s conclusions depend on it.
- Based: passes — The paper gives a reason why it holds.
Probably not a substantial claim.
None of the sources cited for this claim have been checked yet.
In the paper
“The resulting models are unnaturally compact and frequently distorted, preventing critical questions about ligand and/or drug binding modes from being addressed (Ovchinnikov et al., 2015; Nicoludis and Gaudet, 2018).”
§ Sampling alternative conformational states of transporters and receptors with AlphaFold2 > Introduction
What the sources say
- Not checked yetcites Ovchinnikov et al., 2015
- Not checked yetcites Nicoludis and Gaudet, 2018
plaindirect- Asserted: passes — The authors put it forward as true.
- Checkable: passes — It can be checked against evidence.
- Load-bearing: passes — The paper’s conclusions depend on it.
- Based: passes — The paper gives a reason why it holds.
It may state two separate claims as one.
A conclusion the paper draws from its own results — it cites no other source for it, so there is none to check. The quote shows it is in the paper.
In the paper
“The physiological relevance of these proposed structural movements nonetheless requires experimental validation.”
§ Sampling alternative conformational states of transporters and receptors with AlphaFold2 > Results and discussion > Concluding remarks: proposed workflow and future directions
plain- Asserted: passes — The authors put it forward as true.
- Checkable: passes — It can be checked against evidence.
- Load-bearing: fails — The paper’s conclusions may not depend on it.
- Based: passes — The paper gives a reason why it holds.
Probably not a substantial claim. The paper’s conclusions may not depend on it.
- Rests on an assumption: AF2 does not directly account for the lipid environment.
None of the sources cited for this claim have been checked yet.
In the paper
“For G-protein-coupled receptors (GPCRs), ligand binding on the extracellular side triggers structural rearrangements on the intracellular side that initiate downstream signaling (Wang et al., 2020; Gusach et al., 2020).”
§ Sampling alternative conformational states of transporters and receptors with AlphaFold2 > Introduction
What the sources say
- Not checked yetcites Wang et al., 2020
- Not checked yetcites Gusach et al., 2020
plaindirect- Asserted: passes — The authors put it forward as true.
- Checkable: passes — It can be checked against evidence.
- Load-bearing: fails — The paper’s conclusions may not depend on it.
- Based: passes — The paper gives a reason why it holds.
Probably not a substantial claim. The paper’s conclusions may not depend on it.
None of the sources cited for this claim have been checked yet.
In the paper
“the vectorial translocation of substrates by transporters is mediated by movements that open and close extra- and intracellular gates (Drew and Boudker, 2016; Kazmier et al., 2017).”
§ Sampling alternative conformational states of transporters and receptors with AlphaFold2 > Introduction
What the sources say
- Not checked yetcites Drew and Boudker, 2016
- Not checked yetcites Kazmier et al., 2017
plaindirect- Asserted: passes — The authors put it forward as true.
- Checkable: passes — It can be checked against evidence.
- Load-bearing: passes — The paper’s conclusions depend on it.
- Based: passes — The paper gives a reason why it holds.
Probably not a substantial claim.
What the paper did — it cites no source for this, so there is none to check. The quote shows it is in the paper.
In the paper
“All templates were manually inspected, and those with structures similar to the desired conformation of interest were retained.”
§ Sampling alternative conformational states of transporters and receptors with AlphaFold2 > Materials and methods > Template-based predictions
plain- Asserted: passes — The authors put it forward as true.
- Checkable: passes — It can be checked against evidence.
- Load-bearing: passes — The paper’s conclusions depend on it.
- Based: passes — The paper gives a reason why it holds.
Probably not a substantial claim. It may state two separate claims as one.
None of the sources cited for this claim have been checked yet.
In the paper
“A performance breakthrough was unveiled during CASP14 by AlphaFold2 (AF2) (Jumper et al., 2021a; Tunyasuvunakool et al., 2021; Pereira et al., 2021), which achieved remarkably accurate de novo structure prediction.”
§ Sampling alternative conformational states of transporters and receptors with AlphaFold2 > Introduction
What the sources say
boosted- Asserted: passes — The authors put it forward as true.
- Checkable: passes — It can be checked against evidence.
- Load-bearing: passes — The paper’s conclusions depend on it.
- Based: passes — The paper gives a reason why it holds.
Probably not a substantial claim.
What the paper did — it cites no source for this, so there is none to check. The quote shows it is in the paper.
In the paper
“MSA subsampling was carried out randomly by AF2”
§ Sampling alternative conformational states of transporters and receptors with AlphaFold2 > Materials and methods > MSA subsampling
plaindirect- Asserted: passes — The authors put it forward as true.
- Checkable: passes — It can be checked against evidence.
- Load-bearing: fails — The paper’s conclusions may not depend on it.
- Based: passes — The paper gives a reason why it holds.
Probably not a substantial claim. The paper’s conclusions may not depend on it.
What the paper did — it cites no source for this, so there is none to check. The quote shows it is in the paper.
In the paper
“No manual intervention was carried out to fine-tune the composition of these alignments.”
§ Sampling alternative conformational states of transporters and receptors with AlphaFold2 > Materials and methods > MSA subsampling
plain- Asserted: passes — The authors put it forward as true.
- Checkable: passes — It can be checked against evidence.
- Load-bearing: fails — The paper’s conclusions may not depend on it.
- Based: passes — The paper gives a reason why it holds.
Probably not a substantial claim. The paper’s conclusions may not depend on it.
In the paper
“The structural model deposited in the AF2 database, which likely depicts an active conformation that diverges from the structure of the homolog GPR97 (Ping et al., 2021), could be recapitulated by using deep MSAs.”
§ Sampling alternative conformational states of transporters and receptors with AlphaFold2 > Results and discussion > Concluding remarks: proposed workflow and future directions
What the sources say
- Not checked yetcites Ping et al., 2021
hedgedSingle case- Asserted: passes — The authors put it forward as true.
- Checkable: passes — It can be checked against evidence.
- Load-bearing: passes — The paper’s conclusions depend on it.
- Based: passes — The paper gives a reason why it holds.
It may state two separate claims as one.
The paper relies on this without support.
AlphaFold2 was designed to predict static structures of proteins.
“Given that AF2 was designed to predict static structures of proteins, it remains unclear if this result represents an underexplored capability to accurately predict multiple conformations and/or structural heterogeneity.”
The paper relies on this without support.
The experimental structures used as references are accurate representations of the native conformations.
“we used the active conformation of FZD7 and the inactive conformation of the nearly identical FZD4”
The paper relies on this without support.
The two experimental structures of each target bracket the relevant conformational ensemble.
“In our benchmark, these conformations spanned the range between two experimental structures of interest”
The paper relies on this without support.
AF2 does not directly account for the lipid environment.
“AF2 does not directly account for the lipid environment”
The paper relies on this without support.
The structure of GPR114/ADGRG5 has not been experimentally determined.
“GPR114/ADGRG5, a class B2 adhesion GPCR whose structure has not been experimentally determined.”
Claims other papers make about this one
Each is checked against this paper’s own text: does it say what the citing paper says it does?
In the citing paper
“del Alamo et al modified the AF2 pipeline by reducing the number of recycles and restricting the depth of randomly subsampled MSAs to sample functionally relevant alternative conformations of transporters and G-protein-coupled receptors46”
From The power and pitfalls of AlphaFold2 for structure prediction beyond rigid globular proteins (2024) · cites this paper as [46]
In the citing paper
“Initial efforts to enhance sampling of different conformations have involved altering the number of sequences used to generate shallower MSA representations, masking coevolutionary information provided by MSAs, and splitting conflicting coevolutionary signals by clustering MSAs46,47,105.”
From The power and pitfalls of AlphaFold2 for structure prediction beyond rigid globular proteins (2024) · cites this paper as [46]
In the citing paper
“Despite these demonstrations of shortcomings, it was shown that subsampling the input MSA enables AF2 to predict known conformational changes of transporters14.”
From Predicting multiple conformations via sequence clustering and AlphaFold2 (2024) · cites this paper as [14]
Self-check
Percentages, sums and reported differences re-computed from the paper’s own numbers.
Each contradiction between two passages listed here was confirmed by an independent check.
Rated minor: it would not touch a result — a value no result rests on, a p-value that stays on the same side of the significance level, or a conflict that is clerical, resolved elsewhere in the paper, or outside its own findings.
In the paper
§ Sampling alternative conformational states of transporters and receptors with AlphaFold2 > Results and discussion
“Therefore, by necessity, this study is restricted to proteins whose structures were absent from the PDB before this date and have since been determined at atomic resolution in two or more conformations.”
§ Sampling alternative conformational states of transporters and receptors with AlphaFold2 > Results and discussion
“to serve as points of comparison, we used the active conformation of FZD7 and the inactive conformation of the nearly identical FZD4, Yang et al., 2018”
Citations
Cites
Highly accurate protein structure prediction with AlphaFold
Jumper, J., Evans, R., Pritzel, A., Green, T., Figurnov, M., Ronneberger, O., Tunyasuvunakool, K., Bates, R., Žídek, A., Potapenko, A., et al. (2021) · Nature · doi:10.1038/s41586-021-03819-2 · Cited by 43,764
Needleman, S. B., & Wunsch, C. D. (1970) · Journal of Molecular Biology · doi:10.1016/0022-2836(70)90057-4 · Cited by 11,288 · cited 2×
“The following templates were used: OF MCT1 with FucB (PDB 3O7Pa and 3O7Qa, 18% sequence identity calculated using Needleman Wunsch Needleman and Wunsch, 1970 ; Madeira et al., 2019 ); OF LAT1 with AdiC (3OB6a and 5J4Ib, 22%); IF LAT1 with b(0,+)AT1 (6LI9, 45%), KCC3 (6Y5Ra, 12%), GkApcT (6F34a,…”
ColabFold - Making protein folding accessible to all
Mirdita, M., Schütze, K., Moriwaki, Y., Heo, L., Ovchinnikov, S., & Steinegger, M. (2021) · doi:10.1101/2021.08.15.456425 · Cited by 9,391 · cited 1×
“0.1 and a modified version of ColabFold ( Mirdita et al., 2021 ) that is available at https://github.com/delalamo/af2_conformations, ( Del Alamo, 2021b copy archived at swh:1:rev:d60db86886186e80622deaa91045caccaf4103d3).”
BackgroundInfluentialPTRAJ and CPPTRAJ: Software for Processing and Analysis of Molecular Dynamics Trajectory Data
Roe, D. R., & Cheatham, T. E. (2013) · Journal of Chemical Theory and Computation · doi:10.1021/ct400341p · Cited by 7,466 · cited 1×
“PCA and RMSF calculations were carried out in CPPTRAJ ( Roe and Cheatham, 2013 ).”
MethodMMseqs2 enables sensitive protein sequence searching for the analysis of massive data sets
Steinegger, M., & Söding, J. (2017) · Nature Biotechnology · doi:10.1038/nbt.3988 · Cited by 4,840 · cited 1×
“First, all MSAs were obtained using the MMSeqs2 server ( Steinegger and Söding, 2017 ), rather than the default databases.”
The EMBL-EBI search and sequence analysis tools APIs in 2019
Madeira, F., Park, Y. M., Lee, J., Buso, N., Gur, T., Madhusoodanan, N., Basutkar, P., Tivey, A. R. N., Potter, S. C., Finn, R. D., et al. (2019) · Nucleic Acids Research · doi:10.1093/nar/gkz268 · Cited by 4,167 · cited 1×
“…templates were used: OF MCT1 with FucB (PDB 3O7Pa and 3O7Qa, 18% sequence identity calculated using Needleman Wunsch Needleman and Wunsch, 1970 ; Madeira et al., 2019 ); OF LAT1 with AdiC (3OB6a and 5J4Ib, 22%); IF LAT1 with b(0,+)AT1 (6LI9, 45%), KCC3 (6Y5Ra, 12%), GkApcT (6F34a, 24%), NKCC1…”
MethodTM-align: a protein structure alignment algorithm based on the TM-score
Zhang, Y. (2005) · Nucleic Acids Research · doi:10.1093/nar/gki524 · Cited by 3,774 · cited 3×
“…the targets, each model’s similarity to the experimental structures was quantified using template modeling (TM) score ( Zhang and Skolnick, 2004 ; Zhang and Skolnick, 2005 ; Xu and Zhang, 2010 ), a metric ranging from 0 to 1, which indicates how well the two backbone (C α atoms) structures…”
MethodHighly accurate protein structure prediction for the human proteome
Tunyasuvunakool, K., Adler, J., Wu, Z., Green, T., Zielinski, M., Žídek, A., Bridgland, A., Cowie, A., Meyer, C., Laydon, A., et al. (2021) · Nature · doi:10.1038/s41586-021-03828-1 · Cited by 3,025 · cited 1×
“A performance breakthrough was unveiled during CASP14 by AlphaFold2 (AF2) ( Jumper et al., 2021a ; Tunyasuvunakool et al., 2021 ; Pereira et al., 2021 ), which achieved remarkably accurate de novo structure prediction.”
Scoring function for automated assessment of protein structure template quality
Zhang, Y., & Skolnick, J. (2004) · Proteins: Structure, Function, and Bioinformatics · doi:10.1002/prot.20264 · Cited by 2,392 · cited 1×
“For the targets, each model’s similarity to the experimental structures was quantified using template modeling (TM) score ( Zhang and Skolnick, 2004 ; Zhang and Skolnick, 2005 ; Xu and Zhang, 2010 ), a metric ranging from 0 to 1, which indicates how well the two backbone (C α atoms) structures…”
MethodThe role of dynamic conformational ensembles in biomolecular recognition
Boehr, D. D., Nussinov, R., & Wright, P. E. (2009) · Nature Chemical Biology · doi:10.1038/nchembio.232 · Cited by 2,008 · cited 1×
“Dynamic interconversion between multiple conformations underpins the functions of integral membrane proteins in all domains of life ( Campbell et al., 2016 ; Cournia et al., 2015 ; Shaw et al., 2010 ; Boehr et al., 2009 ).”
Background
Research works printed but not linked: 1
- Del Alamo D. 2021b. Prediction of alternative conformations using AlphaFold 2. Software Heritage. swh:1:rev:d60db86886186e80622deaa91045caccaf4103d3. https://archive.softwareheritage.org/swh:1:dir:732ab369a1b141030fbc5728d9ab3f50e222b3ea;origin=https://github.com/delalamo/af2_conformations;visit=swh:1:snp:cb0ae8b45df2c5f548867364bbfe52debb482bda;anchor=swh:1:rev:d60db86886186e80622deaa91045caccaf4103d3.
Cited by
Sorted by citations
Items 401–500 of 568
Xie, L., Lu, X., Zhang, D., Xu, L., Yang, M., Jeong, Y.-S., Chang, S., & Xu, X. (2025) · bioRxiv (Cold Spring Harbor Laboratory) · doi:10.1101/2025.02.09.637298 · Cited by 2
Galeazzi, F. M., da Silva, G. M., Arantes, P. R., Varghese, I., Shukla, A., & Rubenstein, B. M. (2025) · bioRxiv (Cold Spring Harbor Laboratory) · doi:10.1101/2025.05.09.653048 · Cited by 2
Xiang, C., Wang, W., Peng, Z., & Yang, J. (2025) · doi:10.1101/2025.05.28.656531 · Cited by 6
Harnessing AlphaFold to reveal hERG channel conformational state secretsPreprint
Ngo, K., Yang, P., Yarov-Yarovoy, V. M., Clancy, C. E., & Vorobyov, I. V. (2025) · eLife · doi:10.7554/elife.104901.2 · Cited by 2
Learning Dynamic Protein Representations at Scale with DistogramsPreprint
Portal, N., Karroucha, W., Mallet, V., & Bonomi, M. (2026) · bioRxiv (Cold Spring Harbor Laboratory) · doi:10.64898/2026.01.29.702509 · Cited by 3
Parikh, V., Foley, B., Gatlin, W., Ludwick, M., Turano, L., & Verkhivker, G. M. (2026) · bioRxiv (Cold Spring Harbor Laboratory) · doi:10.64898/2026.02.24.707829 · Cited by 4
Sampling antibody conformational ensembles with ABodyBuilder4-STEROIDSPreprint
Spoendlin, F. C., Cagiada, M., Ifashe, K., Vavourakis, O., & Deane, C. (2026) · bioRxiv · doi:10.64898/2026.04.14.718378 · Cited by 2
Combining Protein Conformational Diversity and Phylogenetic Information Using CoDNaS and CoDNaS‐Q
Escobedo, N., Monzón, A. M., Fornasari, M. S., Palópoli, N., & Parisi, G. D. (2023) · Current Protocols · doi:10.1002/cpz1.764 · Cited by 1
The Role of Protonation in the PfMATE Transporter Protein Structural Transitions
Hossen, M. L., Bhattarai, N., Chapagain, P. P., & Gerstman, B. S. (2024) · Methods in molecular biology · doi:10.1007/978-1-0716-4213-9_16 · Cited by 1
Coban, M., Gokara, M., Vargas, L. M. F., Tanzer, S. D., Zhou, S. X., Hockla, A., Sankaran, B., Caulfield, T. R., & Radisky, E. S. (2025) · Science Advances · doi:10.1126/sciadv.adu9129 · Cited by 1
Uchikawa, K., Furui, K., & Ohue, M. (2025) · Biochemistry and Biophysics Reports · doi:10.1016/j.bbrep.2025.102110 · Cited by 1
Amadei, M., Lauro, A. D., Polticelli, F., Musci, G., & di Patti, M. C. B. (2025) · BioMetals · doi:10.1007/s10534-025-00725-2 · Cited by 2
Solvation Energetic Costs of Cognate Binding Site Formation
Ji, Y., Molino, V., Ramsey, S., & Kurtzman, T. (2025) · Journal of Chemical Information and Modeling · doi:10.1021/acs.jcim.5c01432 · Cited by 1
Molecular simulation-based 3D structural construction of olfactory receptor with agonist binding
Hirao, T., Ihara, Y., Ijichi, C., Kudo, G., Yoshino, R., & Hirokawa, T. (2025) · Journal of Computer-Aided Molecular Design · doi:10.1007/s10822-025-00706-0 · Cited by 1
Pham, H.-A., Mai, Q.-G., Dinh, T., Cho, B.-H., Le, M.-L., Huynh, K.-Q., Jang, Y., & Tran‐Van, H. (2026) · Bioorganic & Medicinal Chemistry · doi:10.1016/j.bmc.2026.118579 · Cited by 1
Exploring the potential of AlphaFold distograms for predicting binding‐induced hinge motions
Savaş, B., Barlas, A. B., & Karaca, E. (2026) · FEBS Letters · doi:10.1002/1873-3468.70297 · Cited by 6
Systematic cysteine scanning identifies a druggable pocket in oncogenic KRAS
van Tienen, L. M., Bayoumi, S., Muneeruddin, K., Leymarie, N., Popa, A., Shekhar, M., Mueller, M. A., Li, R., Żak, K. M., Chilukuri, H., et al. (2026) · Cell chemical biology · doi:10.1016/j.chembiol.2026.01.007 · Cited by 2
Seki, T., Ohnuki, J., & Okazaki, K.-I. (2026) · Journal of Chemical Information and Modeling · doi:10.1021/acs.jcim.6c00347 · Cited by 1
Sato, K., Kanaoka, Y., Tsukazaki, T., Uchihashi, T., & Mori, T. (2026) · Journal of Chemical Information and Modeling · doi:10.1021/acs.jcim.6c00142 · Cited by 1
Hori, T., Moriwaki, Y., & Ishitani, R. (2026) · Journal of Chemical Theory and Computation · doi:10.1021/acs.jctc.6c00199 · Cited by 1
Xie, L., Ma, T., Lu, X., Zhang, D., Xu, L., Yang, M., Jeong, Y.-S., Chang, S., & Xu, X. (2026) · Journal of Chemical Theory and Computation · doi:10.1021/acs.jctc.6c00695 · Cited by 4
Duncan, M., Sylvester, T. P., Walden, E., Lozano, J. R., Turner, E., Duncan, S., Mitchell, R. F., McKenna, D. D., & Adams, R. (2026) · Insects · doi:10.3390/insects17060587 · Cited by 1
Lombard, V., Van, J. N., Grudinin, S., & Laine, É. (2026) · Acta Crystallographica Section D Structural Biology · doi:10.1107/s2059798326006054 · Cited by 4
Shin, J., Joo, K., & Yoo, J. (2026) · Journal of Chemical Information and Modeling · doi:10.1021/acs.jcim.6c01677 · Cited by 1
Artificial intelligence for CRISPR-based biosensing: From molecular design to assay intelligence
Wang, R., Zhang, Q., Gaira, S., Zhao, Y., Lai, J., Li, M., Zhang, C., Wu, L., Deng, F., & Tang, S. (2026) · TrAC Trends in Analytical Chemistry · doi:10.1016/j.trac.2026.119061 · Cited by 1
AlphaFold2 Predicts Alternative Conformation Populations in Green Fluorescent Protein Variants
Núñez‐Franco, R., Muriel-Olaya, M. M., Jiménez‐Osés, G., & Peccati, F. (2024) · Journal of Chemical Information and Modeling · doi:10.1021/acs.jcim.4c01388 · Cited by 2
Allosterically switchable network orients β -flap in Clostridioides difficile toxins
Finn, L. M., Cummer, R., Castagner, B., & Keller, B. G. (2025) · Proceedings of the National Academy of Sciences · doi:10.1073/pnas.2419263122 · Cited by 1
Sahoo, A. R., Souza, P. C. T., Meng, Z., & Buck, M. (2021) · bioRxiv (Cold Spring Harbor Laboratory) · doi:10.1101/2021.09.10.459840 · Cited by 1
Exploring generality of experimental conformational changes with AlphaFold predictionsPreprint
Castellví, A., Medina, A., Petrillo, G., et al. (2022) · bioRxiv (Cold Spring Harbor Laboratory) · doi:10.1101/2022.04.12.488086 · Cited by 1
CryoEM structure of QacA, an antibacterial efflux transporter from Staphylococcus aureusPreprint
Majumder, P., Ahmed, S., Ahuja, P., Athreya, A., Ranjan, R. D., & Penmatsa, A. (2022) · bioRxiv (Cold Spring Harbor Laboratory) · doi:10.1101/2022.07.09.499445 · Cited by 1
Protein Model Refinement for Cryo-EM Maps Using DAQ scorePreprint
Terashi, G., Wang, X., & Kihara, D. (2022) · bioRxiv (Cold Spring Harbor Laboratory) · doi:10.1101/2022.08.23.505034 · Cited by 1
AlphaFold2 captures the conformational landscape of the HAMP signaling domainPreprint
Winski, A., Ludwiczak, J., Orłowska, M., et al. (2023) · bioRxiv (Cold Spring Harbor Laboratory) · doi:10.1101/2023.05.23.541686 · Cited by 1
Is the functional response of a receptor determined by the thermodynamics of ligand binding?Preprint
Vögele, M., Zhang, B. W., Kaindl, J. M., et al. (2023) · ChemRxiv · doi:10.26434/chemrxiv-2023-p1507 · Cited by 1
Representing Structures of the Multiple Conformational States of Proteins
Ramelot, T., Tejero, R., & Montelione, G. (2023) · doi:10.26434/chemrxiv-2023-wc3mx · Cited by 25
Can Protein Structure Prediction Methods Capture Alternative Conformations of Membrane Proteins?
Xie, T., & Huang, J. (2023) · doi:10.1101/2023.08.04.552045 · Cited by 23
Modeling flexible protein structure with AlphaFold2 and cross-linking mass spectrometry
Manalastas-Cantos, K., Adoni, K. R., Pfeifer, M., Märtens, B., Grünewald, K., Thalassinos, K., & Topf, M. (2023) · doi:10.1101/2023.09.11.557128 · Cited by 1
The role of protonation in the PfMATE transporter protein structural transitionsPreprint
Gerstman, B. S., Hossen, M., Bhattarai, N., & Chapagain, P. P. (2023) · doi:10.22541/au.169645521.18264971/v1 · Cited by 1
Vats, S., Bobrovs, R., Söderhjelm, P., & Bhakat, S. (2023) · bioRxiv (Cold Spring Harbor Laboratory) · doi:10.1101/2023.11.21.568098 · Cited by 1
Sequence-Based Drug Design Using TransformersPreprint
Vendruscolo, M., Zhang, S., Huo, D., Horne, R. I., Qi, Y., Ojeda, S. P., & Yan, A. (2024) · Research Square · doi:10.21203/rs.3.rs-3682847/v1 · Cited by 1
Explaining Conformational Diversity in Protein Families through Molecular MotionsPreprint
Lombard, V., Grudinin, S., & Laine, É. (2024) · bioRxiv (Cold Spring Harbor Laboratory) · doi:10.1101/2024.02.06.578951 · Cited by 1
Raisinghani, N., Alshahrani, M., Gupta, G., Tian, H., Xiao, S., Tao, P., & Verkhivker, G. M. (2024) · bioRxiv (Cold Spring Harbor Laboratory) · doi:10.1101/2024.05.17.594786 · Cited by 1
Computational Tools for Structural Analysis of Proteins
Brezovský, J., Sethi, A., & Surpeta, B. (2024) · Elsevier eBooks · doi:10.1016/b978-0-323-95502-7.00089-0 · Cited by 1
SeaMoon: from protein language models to continuous structural heterogeneity
Lombard, V., Timsit, D., Grudinin, S., & Laine, E. (2024) · doi:10.1101/2024.09.23.614585 · Cited by 8
Decoding protein dynamicity in DNA ligase activity through deep learning-based structural ensemblesPreprint
Mishra, N., Callaghan, S., & Briney, B. S. (2024) · bioRxiv (Cold Spring Harbor Laboratory) · doi:10.1101/2024.11.07.622521 · Cited by 1
Editorial: Machine Learning for Structural Biology
Corso, G., Nesr, G. E., & Wayment-Steele, H. K. (2024) · PRX Life · doi:10.1103/prxlife.2.040001 · Cited by 1
Wang, B., Wang, C., Chen, J., Liu, D., Sun, C., Zhang, J., Zhang, K., & Li, H. (2025) · doi:10.1101/2025.02.21.639488 · Cited by 5
LetA defines a structurally distinct transporter family involved in lipid traffickingPreprint
Santarossa, C., Li, Y., Yousef, S., Hasdemir, H. S., Rodriguez, C. C., Haase, M. B., Baek, M., Coudray, N., Pavek, J. G., Focke, K. N., et al. (2025) · bioRxiv (Cold Spring Harbor Laboratory) · doi:10.1101/2025.03.21.644421 · Cited by 1
Piomponi, V., Cazzaniga, A., & Cuturello, F. (2025) · bioRxiv (Cold Spring Harbor Laboratory) · doi:10.1101/2025.04.08.647782 · Cited by 1
Kyrylenko, R., Koleiev, I., Savchenko, I., Voitsitskyi, T., Stratiichuk, R., Husak, V., Yesylevskyy, S., Starosyla, S., & Nafiiev, A. (2025) · doi:10.1101/2025.05.13.652389 · Cited by 6
Lin, Y., Zhou, Z., Han, Y., Cheng, D., Wang, H., Ju, A. L., Zhang, Y., Cox, C. D., & Corry, B. (2025) · doi:10.1101/2025.07.26.664997 · Cited by 7
Zhou, H., Yu, H., Yau, S. S. ‐., & Gong, H. (2026) · bioRxiv (Cold Spring Harbor Laboratory) · doi:10.64898/2026.01.14.699462 · Cited by 1
Gizzio, J., Faezov, B., Xu, Q., & Dunbrack, R. L. (2026) · bioRxiv (Cold Spring Harbor Laboratory) · doi:10.64898/2026.02.19.706771 · Cited by 1
Assessing State-Specific Accuracy of Cofolding Models for Kinases and GPCRsPreprint
Obendorf, L., Doering, N. P., Knaus, P., et al. (2026) · bioRxiv (Cold Spring Harbor Laboratory) · doi:10.64898/2026.05.06.723350 · Cited by 1
_sampleworks:_ A Modular Platform for Experimentally Guided Biomolecular Ensemble Generation
Chrispens, K. M., Collins, M., Fraser, J. S., Mai, D., van den Bedem, H., & Wankowicz, S. A. M. (2026) · The Stacks · doi:10.82153/jkxj-tw08 · Cited by 2
Stelzl, L. S., Kritsiligkou, P., Mehdipour, A. R., Baldwin, A. J., Ferguson, S. J., Mavridou, D. A. I., Sansom, M. S. P., & Redfield, C. (2022) · bioRxiv (Cold Spring Harbor Laboratory) · doi:10.1101/2022.09.07.506916
Structural Insights into Pink-eyed Dilution Protein (Oca2)
(2022) · doi:10.1101/2022.12.09.519718 · Cited by 13
Mitrovic, D., Chen, Y., Marciniak, A., & Delemotte, L. (2023) · doi:10.1101/2023.07.20.549854 · Cited by 10
Lateral gating mechanism and plasticity of the BAM complex in micelles and E. coliPreprint
Gopinath, A., Rath, T., Morgner, N., et al. (2023) · bioRxiv (Cold Spring Harbor Laboratory) · doi:10.1101/2023.08.13.553113
Probing different conformational states of polar organizing protein Z with AlphaFoldPreprint
Taneja, I., & Lasker, K. (2023) · bioRxiv (Cold Spring Harbor Laboratory) · doi:10.1101/2023.10.11.561952
Moffat, K., & Lattman, E. E. (2023) · Wiley eBooks · doi:10.1002/9781119696353.ch9
The physical logic of protein machinesPreprint
Mcbride, J., & Tlusty, T. (2023) · bioRxiv · doi:10.1101/2023.11.16.567487 · Cited by 4
Raisinghani, N., Alshahrani, M., Gupta, G., Xiao, S., Tao, P., & Verkhivker, G. M. (2023) · bioRxiv (Cold Spring Harbor Laboratory) · doi:10.1101/2023.11.18.567697
Raisinghani, N., Alshahrani, M., Gupta, G., Xiao, S., Tao, P., & Verkhivker, G. M. (2023) · bioRxiv (Cold Spring Harbor Laboratory) · doi:10.1101/2023.12.11.571185
Karatzas, P., Brotzakis, Z. F., & Sarimveis, H. (2024) · bioRxiv (Cold Spring Harbor Laboratory) · doi:10.1101/2024.02.23.581804
Albanese, K. I., Barbe, S., Tagami, S., Woolfson, D. N., & Schiex, T. (2025) · Nature Reviews Methods Primers · doi:10.1038/s43586-025-00383-1 · Cited by 104
Ion Channel Tools and Therapeutics from Venoms and Toxins
Trim, C. M., Leffler, A. E., Samanani, Z., & Trim, S. A. (2024) · Springer eBooks · doi:10.1007/978-3-031-52197-3_15 · Cited by 1
Exploring Neuroscience Researchers’ Trust in Preprints through Citation AnalysisPreprint
Rasuli, B., Seyfzadehdarabad, F., Cardone, P., Thibaut, A., & Gosseries, O. (2024) · bioRxiv (Cold Spring Harbor Laboratory) · doi:10.1101/2024.04.29.591455
Deciphering GB1’s Single Mutational Landscape: Insights from MuMi Analysis
Guclu, T. F., Atilgan, A. R., & Atilgan, C. (2024) · doi:10.1101/2024.06.01.596930
Assessing the functional roles of coevolving PHD finger residues
Basu, S., Subedi, U., Tonelli, M., Afshinpour, M., Tiwari, N., Fuentes, E. J., & Chakravarty, S. (2024) · Protein Science · doi:10.1002/pro.5065
Estudio genómico y antigénico de una cepa virulenta de virus Junín
Thomas, P. D. (2024) · doi:10.35537/10915/168155
Deciphering GB1’s Single Mutational Landscape: Insights from MuMi Analysis
Guclu, T. F., Atilgan, A. R., & Atilgan, C. (2024) · The Journal of Physical Chemistry B · doi:10.1021/acs.jpcb.4c04916
Clostridioides difficile Toxins Unhinged: Allosterically Switchable Network Orients β -flapPreprint
Finn, L. M., Cummer, R., Castagner, B., et al. (2024) · bioRxiv (Cold Spring Harbor Laboratory) · doi:10.1101/2024.08.08.607137
Generating Multi-state Conformations of P-type ATPases with a Conditional Diffusion ModelPreprint
Xu, J., & Wang, Y. (2024) · bioRxiv (Cold Spring Harbor Laboratory) · doi:10.1101/2024.08.07.607107
Trozzi, F., Tran, O., Masri, C. A., Lin, S.-H., Ravikumar, B., & Rahman, R. (2024) · bioRxiv (Cold Spring Harbor Laboratory) · doi:10.1101/2024.08.16.608358
Jin, L., Qian, C., Wei, Z., Zhang, D., Xi, J., Sun, D., Fu, L., Liu, X., & Zhang, X. (2024) · Arabian Journal of Chemistry · doi:10.1016/j.arabjc.2024.105979
Raisinghani, N., Parikh, V., Foley, B., & Verkhivker, G. M. (2024) · bioRxiv (Cold Spring Harbor Laboratory) · doi:10.1101/2024.11.04.621947
AlphaFold-Metainference: Prediction of Structural Ensembles of Disordered ProteinsPreprint
Brotzakis, Z. F., Zhang, S., Murtada, M. H., & Vendruscolo, M. (2024) · bioRxiv (Cold Spring Harbor Laboratory) · doi:10.1101/2024.11.09.622758 · Cited by 1
Study of the Variability of the Native Protein Structure
Christoffer, C. W., Nakamura, T., Han, X., Shin, W., Terashi, G., Monroe, L. K., Kurgan, L., & Kihara, D. (2024) · Elsevier eBooks · doi:10.1016/b978-0-323-95502-7.00176-7
Takashi, K., Matsuzawa, F., Shojima, N., & Yamauchi, T. (2024) · Journal of Molecular Graphics and Modelling · doi:10.1016/j.jmgm.2024.108912 · Cited by 2
Towards an information-theoretic framework for multiple sequence alignment sub-sampling
Barrett, C., Bura, A. C., Huang, F. W. D., & Reidys, C. M. (2024) · Proceedings of the Royal Society A Mathematical Physical and Engineering Sciences · doi:10.1098/rspa.2023.0797
AI decodes CNNM Na+/Mg2+ exchange
Nethramangalath, T., & Runnels, L. W. (2025) · Structure · doi:10.1016/j.str.2024.12.006
Physics-informed deep learning approach for fixing and sampling protein 3D structures
Chen, Z., Lin, X., Li, Y., Ma, Z., Zhang, J., & Gao, Y. Q. (2025) · Chinese Science Bulletin (Chinese Version) · doi:10.1360/tb-2024-1149
AlphaFold2 captures conformational transitions in the voltage-gated channel superfamilyPreprint
Tao, E., & Corry, B. (2025) · bioRxiv (Cold Spring Harbor Laboratory) · doi:10.1101/2025.03.12.642934
PhysDock: A Physics-Guided All-Atom Diffusion Model for Protein-Ligand Complex PredictionPreprint
Zhang, K., Ma, Y., Yu, J., Luo, H., Lin, J. Y., Qin, Y., Li, X., Jiang, Q., Bai, F., Dou, J., et al. (2025) · bioRxiv (Cold Spring Harbor Laboratory) · doi:10.1101/2025.04.28.650887
AlphaFold modeling of polyubiquitin complexes and covalently linked proteins
Fábián, B., Stuke, J. F. M., Heinz, M., & Hummer, G. (2025) · doi:10.1101/2025.05.27.656350 · Cited by 3
The potential of AI techniques in biomolecular simulations
Frasnetti, E., & Colombo, G. (2025) · Elsevier eBooks · doi:10.1016/b978-0-443-29808-0.00033-9
Progress in protein structure prediction: AlphaFold2 and beyond
Nagao, C. (2024) · Japanese Journal of Lactic Acid Bacteria · doi:10.4109/jslab.35.113
A LARGE-SCALE EVOLUTIONARY AND STRUCTURAL ANALYSIS OF CLC CHANNELS AND TRANSPORTERS
Mishra, A., Vázquez, G. D., & Robertson, J. L. (2025) · doi:10.1101/2025.07.07.663545 · Cited by 3
Predicting blood group antigens: accessible or not?
Walser, P. J. (2025) · Blood · doi:10.1182/blood.2025029154
Pharmacological Mechanisms of SLC6 Neurotransmitter Transporter Inhibition
Bandyopadhyay, D., Nayak, S. R., & Penmatsa, A. (2025) · Advances in neurobiology · doi:10.1007/978-3-031-96364-3_1
Uncovering distinct protein conformations using coevolutionary information and AlphaFoldPreprint
Chen, Y., Wong, S. W. K., & Kou, S. (2025) · bioRxiv (Cold Spring Harbor Laboratory) · doi:10.1101/2025.10.08.681198
ConforFold Recovers Alternative Protein Conformations Beyond MSA Subsampling
Syrlybaeva, R., & Strauch, E.-M. (2025) · doi:10.1101/2025.10.14.682366 · Cited by 2
Metadata
- Authors
- del Alamo, D., Sala, D., Mchaourab, H. S., & Meiler, J.
- Affiliations
- Department of Molecular Physiology and Biophysics, Vanderbilt University
- Leipzig University (DE)
- Vanderbilt University (US)
- Corresponding author
- Mchaourab, Hassane S
- Meiler, Jens
- Venue
- eLife
- Publisher
- eLife Sciences Publications, Ltd
- Published
- 2022-03-03
- Volume
- 11
- ISSN
- 2050-084X (ISSN-L)
- PMC
- PMC9023059
- OpenAlex
- W4214847177
- Semantic Scholar
- ff9b84297f16760472c791456befb31ff1d224ef
- Cited by
- 511
- References
- 66
- Citations by year
- 2026: 115 · 2025: 121 · 2024: 138 · 2023: 93 · 2022: 42
- FWCI
- 32.09
- Type
- journal article
- Language
- en
- Open access
- gold
- doi.org
- Licence
- Locations
- eLife (publishedVersion, cc-by)
- bioRxiv (Cold Spring Harbor Laboratory) (acceptedVersion, cc-by-nc-nd)
- PubMed Central (publishedVersion, cc-by)
- PubMed (publishedVersion)
- DOAJ (DOAJ: Directory of Open Access Journals) (submittedVersion, cc-by-sa)
- Florence Research (University of Florence) (submittedVersion, other-oa)
- Funders
- National Institutes of Health (GM 128087)
- Deutsche Forschungsgemeinschaft (CRC 1423, project number 421152132, subproject Z04)
- Topics
- Life Sciences › Biochemistry, Genetics and Molecular Biology › Molecular Biology › Protein Structure and Dynamics
- Life Sciences › Biochemistry, Genetics and Molecular Biology › Molecular Biology › Receptor Mechanisms and Signaling
- Life Sciences › Biochemistry, Genetics and Molecular Biology › Molecular Biology › Machine Learning in Bioinformatics
- Keywords
- AlphaFold2, conformational sampling, membrane transporters, G protein-coupled receptors, structural heterogeneity, protein conformational plasticity, protein structure prediction, conformational ensembles
- MeSH terms
- Algorithms, Furylfuramide, Protein Conformation, Sequence Alignment, Membrane Transport Proteins
About these checks
Registry, retraction, Cites and statistics results are computed, not judged, with one exception: a printed reference that no index lists is read once by a model before it counts as a citation error. Claims are extracted by a model and kept only when their quote appears verbatim in the text; each cited source is then checked, with a model’s help, for whether it says what the claim relies on. Those verdicts can be wrong — read the claim’s quote and the cited source before relying on one.
A language model drew the claims from the paper on 2026-10-07, under version 3 of the claim definition (model deepseek-v4.1-flash, prompt extract-v3).
A second model labelled each claim on 2026-10-07 (model jev-1.13-20260917, definition revision gold-guideline-v0.2).
Statistics and arithmetic are recomputed, not judged.
Confidence bands are shown only for fields calibrated on our annotated test set. None is calibrated yet, so no band is shown.
What counts as a claim ›How we measure confidence ›How we check this ›
Are you an author, or do you see a problem with this page? Request a review
