

The DOI matches its Crossref record; 44 of the 46 references it cites were found in a registry or an index; none of the 38 sources its claims cite is checked for support yet.
Evaluation of the Diagnostic Stability of the Early Autism Spectrum Disorder Phenotype in the General Population Starting at 12 Months
Open accessAbstract
Importance: Universal early screening for autism spectrum disorder (ASD) in primary care is becoming increasingly common and is believed to be a pivotal step toward early treatment. However, the diagnostic stability of ASD in large cohorts from the general population, particularly in those younger than 18 months, is unknown. Changes in the phenotypic expression of ASD across early development compared with toddlers with other delays are also unknown. Objectives: To examine the diagnostic stability of ASD in a large cohort of toddlers starting at 12 months of age and to compare this stability with that of toddlers with other disorders, such as developmental delay. Design, Setting, and Participants: In this prospective cohort study performed from January 1, 2006, to December 31, 2018, a total of 2241 toddlers were referred from the general population through a universal screening program in primary care or community referral. Eligible toddlers received their first diagnostic evaluation between 12 and 36 months of age and had at least 1 subsequent evaluation. Exposures: Diagnosis was denoted after each evaluation visit as ASD, ASD features, language delay, developmental delay, other developmental issue, typical sibling of an ASD proband, or typical development. Main Outcomes and Measures: Diagnostic stability coefficients were calculated within 2-month age bands, and logistic regression models were used to explore the associations of sex, age, diagnosis at first visit, and interval between first and last diagnosis with stability. Toddlers with a non-ASD diagnosis at their first visit diagnosed with ASD at their last were designated as having late-identified ASD. Results: Among the 1269 toddlers included in the study (918 [72.3%] male; median age at first evaluation, 17.6 months [interquartile range, 14.0-24.4 months]; median age at final evaluation, 36.2 months [interquartile range, 33.4-40.9 months]), the overall diagnostic stability for ASD was 0.84 (95% CI, 0.80-0.87), which was higher than any other diagnostic group. Only 7 toddlers (1.8%) initially considered to have ASD transitioned into a final diagnosis of typical development. Diagnostic stability of ASD within the youngest age band (12-13 months) was lowest at 0.50 (95% CI, 0.32-0.69) but increased to 0.79 by 14 months and 0.83 by 16 months (age bands of 12 vs 14 and 16 months; odds ratio, 4.25; 95% CI, 1.59-11.74). A total of 105 toddlers (23.8%) were not designated as having ASD at their first visit but were identified at a later visit. Conclusions and Relevance: The findings suggest that an ASD diagnosis becomes stable starting at 14 months of age and overall is more stable than other diagnostic categories, including language or developmental delay. After a toddler is identified as having ASD, there may be a low chance that he or she will test within typical levels at 3 years of age. This finding opens the opportunity to test the impact of very early-age treatment of ASD.
Overview
AI snapshot
Written from the paper’s full text.
TL;DR
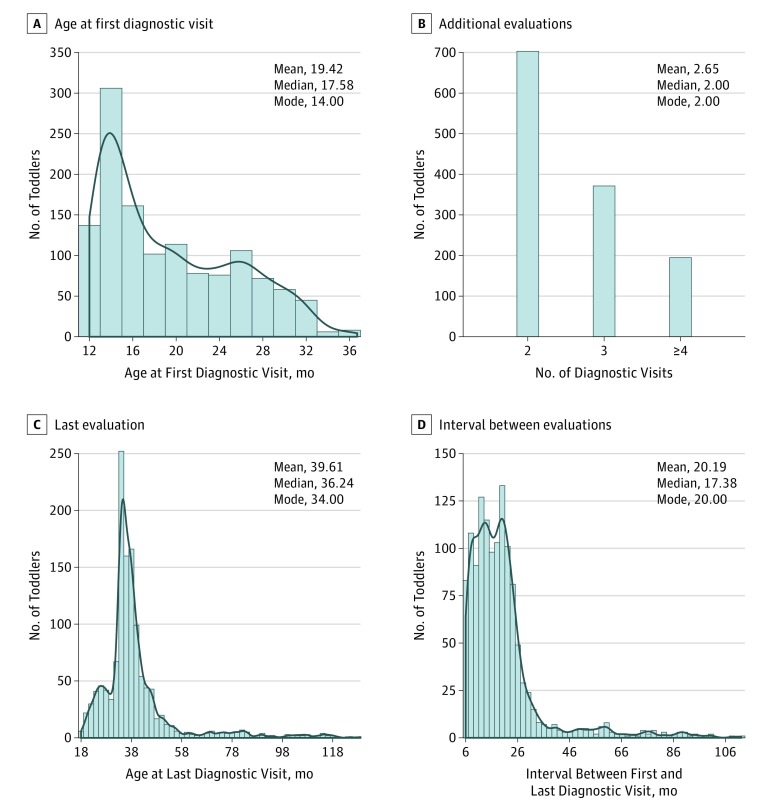
In a general-population cohort of 1269 toddlers evaluated longitudinally from 12 to 36 months, an ASD diagnosis was more stable than other diagnoses, with overall stability of 0.84. Stability was weakest at 12–13 months (0.50) and improved by 14 months (0.79) and 16 months (0.83), while late-identified ASD occurred in 23.8% of toddlers ultimately diagnosed with ASD.
Key findings
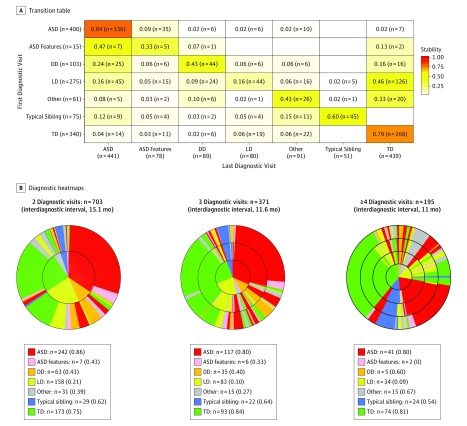
- Overall diagnostic stability was 0.84 (95% CI, 0.80–0.87) for ASD and 0.79 (95% CI, 0.74–0.83) for typical development (TD); ASD vs TD stability did not differ significantly (OR, 0.86; 95% CI, 0.57–1.29). ASD was significantly more stable than ASD features (OR, 0.11; 95% CI, 0.03–0.32), developmental delay (DD; OR, 0.15; 95% CI, 0.09–0.25), language delay (LD; OR, 0.04; 95% CI, 0.03–0.06), and other diagnoses (OR, 0.16; 95% CI, 0.09–0.28).
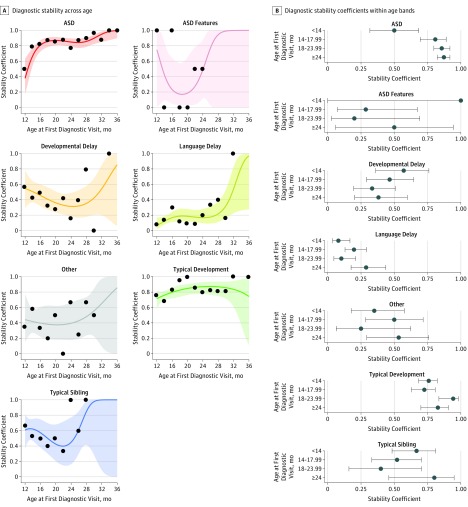
- ASD stability was weakest at 12–13 months (0.50; 95% CI, 0.32–0.69), increasing to 0.79 by 14 months and 0.83 by 16 months (12 vs 14/16 months OR, 4.25; 95% CI, 1.59–11.74). When toddlers with ASD features were counted as ASD, stability rose to 0.70 at 12 months, 0.85 at 14 months, and 0.94 at 16 months.
- Of 400 toddlers initially designated as having ASD, 336 retained the diagnosis at final visit; only 7 (1.8%) transitioned to TD, and 5 of those 7 were initially evaluated at 12–13 months. The most common transition was from an initial diagnosis of LD or DD to ASD.
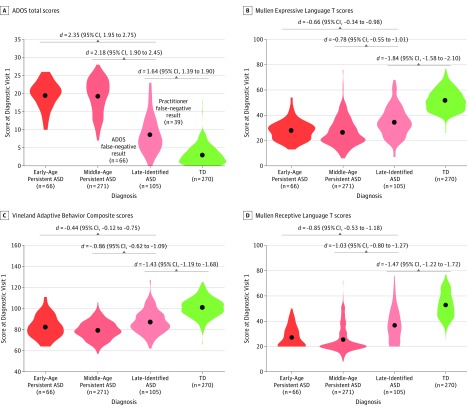
- Among toddlers ultimately diagnosed with ASD, 66 (15.9%) were early-age persistent, 270 (61.2%) middle-age persistent, and 105 (23.8%) late-identified. Late-identified toddlers had better first-visit scores than the other ASD groups (Cohen d range, 0.44–2.35) but worse scores than TD toddlers (Cohen d range, 1.43–1.84); 39 late-identified toddlers (37%) fell within the ADOS toddler-module concern cutoff but were designated non-ASD by practitioner judgment.
Methods
- A total of 2241 toddlers aged 12–36 months were referred to a University of California, San Diego autism expert evaluation center through the Get SET Early program or community referral; 1269 were longitudinally evaluated 2 or more times with an interval of 6 months or longer and were the focus. Approximately 75% came from Get SET Early and 25% from community referral. Median age at first evaluation was 17.6 months, median age at final evaluation was 36.2 months, and mean number of diagnostic visits was 2.7.
- Licensed psychologists performed diagnostic and psychometric testing, including ADOS-2, Mullen Scales of Early Learning, and Vineland Adaptive Behavior Scales. Toddlers were designated as having ASD, ASD features, developmental delay, language delay, other issue, TD, or typical sibling of an ASD proband.
- Stability coefficients were calculated as the proportion retaining the same diagnosis from first to last visit within 2-month age bands. Logistic regression included sex, age at first diagnosis, interval between first and last diagnosis, and diagnostic group at first visit; age was binned as younger than 14 months, 14–17.99 months, 18–23.99 months, and 24 months or older. Analyses were performed in R.
Limitations
- The paper states that practitioners making final diagnoses were not masked to previous diagnoses because DSM-5 procedures and criteria require consideration of historical information regarding ASD symptoms; this could have biased psychologists toward increased diagnostic stability, although the relatively weak stability in other delay groups was cited as counterevidence.
- The paper notes that lower ASD stability at 12 months likely reflects limitations in the diagnostic tools used at that age, including the ADOS-2 and DSM.
- The study was not designed to determine whether early treatments affected the speed with which toddlers with language delay caught up by final diagnosis age.
Model-written summary. Check it against the paper before relying on it.
Integrity signals
Registry
Cites
Statistics
Figures
Verification
Claims the paper makes
37 Own result · 27 Not checked yet · 6 No basis given · 5 Own method · 5 Own interpretation
A result the paper reports from its own data — it cites no other source for it, so there is none to check. The quote shows it is in the paper.
In the paper
“No clinical differences were found between the early and middle diagnosis groups (Figure 4).”
§ Evaluation of the Diagnostic Stability of the Early Autism Spectrum Disorder Phenotype in the General Population Starting at 12 Months > Results > ASD Identification Patterns and Clinical Differences
plain- Asserted: passes — The authors put it forward as true.
- Checkable: passes — It can be checked against evidence.
- Load-bearing: passes — The paper’s conclusions depend on it.
- Based: passes — The paper gives a reason why it holds.
A result the paper reports from its own data — it cites no other source for it, so there is none to check. The quote shows it is in the paper.
In the paper
“In our cohort, 84% of toddlers initially diagnosed with ASD at their first visit retained this diagnosis at 3 to 4 years of age.”
§ Evaluation of the Diagnostic Stability of the Early Autism Spectrum Disorder Phenotype in the General Population Starting at 12 Months > Discussion
plaincorrelational- Asserted: passes — The authors put it forward as true.
- Checkable: passes — It can be checked against evidence.
- Load-bearing: passes — The paper’s conclusions depend on it.
- Based: passes — The paper gives a reason why it holds.
A result the paper reports from its own data — it cites no other source for it, so there is none to check. The quote shows it is in the paper.
In the paper
“The transition from an initial diagnosis of LD or developmental delay to ASD was the most common transition type.”
§ Evaluation of the Diagnostic Stability of the Early Autism Spectrum Disorder Phenotype in the General Population Starting at 12 Months > Results > Transition Patterns
plain- Asserted: passes — The authors put it forward as true.
- Checkable: passes — It can be checked against evidence.
- Load-bearing: unclear — It is unclear whether the paper’s conclusions depend on it.
- Based: passes — The paper gives a reason why it holds.
A result the paper reports from its own data — it cites no other source for it, so there is none to check. The quote shows it is in the paper.
In the paper
“Overall stability was 0.84 (95% CI, 0.80-0.87) for an ASD diagnosis and 0.79 (95% CI, 0.74-0.83) for a TD diagnosis (Figure 2A).”
§ Evaluation of the Diagnostic Stability of the Early Autism Spectrum Disorder Phenotype in the General Population Starting at 12 Months > Results > Diagnostic Stability
plain- Asserted: passes — The authors put it forward as true.
- Checkable: passes — It can be checked against evidence.
- Load-bearing: passes — The paper’s conclusions depend on it.
- Based: passes — The paper gives a reason why it holds.
- Rests on an assumption: The final diagnostic evaluation at the last visit provides a valid reference standard for true ASD diagnostic status.
- Rests on an assumption: The lack of masking of psychologists to previous diagnoses did not materially bias the diagnostic stability estimates.
A result the paper reports from its own data — it cites no other source for it, so there is none to check. The quote shows it is in the paper.
In the paper
“When toddlers with ASD features were considered to have ASD, the stability coefficients increased to 0.70 (95% CI, 0.52-0.85) at 12 months of age, 0.85 (95% CI, 0.71-0.94) at 14 months of age, and 0.94 (95% CI, 0.81-0.99) at 16 months of age.”
§ Evaluation of the Diagnostic Stability of the Early Autism Spectrum Disorder Phenotype in the General Population Starting at 12 Months > Results > Diagnostic Stability
plaindirect- Asserted: passes — The authors put it forward as true.
- Checkable: passes — It can be checked against evidence.
- Load-bearing: passes — The paper’s conclusions depend on it.
- Based: passes — The paper gives a reason why it holds.
- Rests on an assumption: The final diagnostic evaluation at the last visit provides a valid reference standard for true ASD diagnostic status.
- Rests on an assumption: The lack of masking of psychologists to previous diagnoses did not materially bias the diagnostic stability estimates.
A result the paper reports from its own data — it cites no other source for it, so there is none to check. The quote shows it is in the paper.
In the paper
“Stability of an ASD diagnosis increased to 0.79 by 14 months of age and 0.83 by 16 months of age (age bands of 12 vs 14 and 16 months; OR, 4.25; 95% CI, 1.59-11.74) (Figure 3 and eFigure 4, eFigure 5, eTable 2, and eTable 3 in the Supplement).”
§ Evaluation of the Diagnostic Stability of the Early Autism Spectrum Disorder Phenotype in the General Population Starting at 12 Months > Results > Diagnostic Stability
plaindirect- Asserted: passes — The authors put it forward as true.
- Checkable: passes — It can be checked against evidence.
- Load-bearing: passes — The paper’s conclusions depend on it.
- Based: passes — The paper gives a reason why it holds.
- Rests on an assumption: The final diagnostic evaluation at the last visit provides a valid reference standard for true ASD diagnostic status.
- Rests on an assumption: The lack of masking of psychologists to previous diagnoses did not materially bias the diagnostic stability estimates.
A result the paper reports from its own data — it cites no other source for it, so there is none to check. The quote shows it is in the paper.
In the paper
“yet even when such toddlers were removed from analyses, the stability coefficient did not improve.”
§ Evaluation of the Diagnostic Stability of the Early Autism Spectrum Disorder Phenotype in the General Population Starting at 12 Months > Discussion
plain- Asserted: passes — The authors put it forward as true.
- Checkable: passes — It can be checked against evidence.
- Load-bearing: passes — The paper’s conclusions depend on it.
- Based: passes — The paper gives a reason why it holds.
A result the paper reports from its own data — it cites no other source for it, so there is none to check. The quote shows it is in the paper.
In the paper
“Results from the overall logistic regression model showed a significant association of age and diagnosis at first visit with stability (eTable 1 in the Supplement).”
§ Evaluation of the Diagnostic Stability of the Early Autism Spectrum Disorder Phenotype in the General Population Starting at 12 Months > Results > Diagnostic Stability
plaincorrelational- Asserted: passes — The authors put it forward as true.
- Checkable: passes — It can be checked against evidence.
- Load-bearing: passes — The paper’s conclusions depend on it.
- Based: passes — The paper gives a reason why it holds.
- Rests on an assumption: The final diagnostic evaluation at the last visit provides a valid reference standard for true ASD diagnostic status.
A result the paper reports from its own data — it cites no other source for it, so there is none to check. The quote shows it is in the paper.
In the paper
“The most common transition was ASD to ASD features, a diagnostic category used for toddlers with signs of ASD but not enough to meet DSM criteria.”
§ Evaluation of the Diagnostic Stability of the Early Autism Spectrum Disorder Phenotype in the General Population Starting at 12 Months > Discussion
plain- Asserted: passes — The authors put it forward as true.
- Checkable: passes — It can be checked against evidence.
- Load-bearing: unclear — It is unclear whether the paper’s conclusions depend on it.
- Based: passes — The paper gives a reason why it holds.
A result the paper reports from its own data — it cites no other source for it, so there is none to check. The quote shows it is in the paper.
In the paper
“No significant differences were found in stability based on sex (OR, 0.76; 95% CI, 0.56-1.04) or interval between first and last diagnostic evaluations (OR, 0.99; 95% CI, 0.98-1.00).”
§ Evaluation of the Diagnostic Stability of the Early Autism Spectrum Disorder Phenotype in the General Population Starting at 12 Months > Results > Diagnostic Stability
plain- Asserted: passes — The authors put it forward as true.
- Checkable: passes — It can be checked against evidence.
- Load-bearing: unclear — It is unclear whether the paper’s conclusions depend on it.
- Based: passes — The paper gives a reason why it holds.
- Rests on an assumption: The final diagnostic evaluation at the last visit provides a valid reference standard for true ASD diagnostic status.
- Probably not a substantial claim. 23
- It may state two separate claims as one. 9
The paper states this without a source or data behind it here, so there is nothing to check it against. The quote shows it is in the paper.
In the paper
“Evidence counter to this point is the relatively weak diagnostic stability found in other delay groups.”
§ Evaluation of the Diagnostic Stability of the Early Autism Spectrum Disorder Phenotype in the General Population Starting at 12 Months > Discussion > Limitations
plain- Asserted: passes — The authors put it forward as true.
- Checkable: passes — It can be checked against evidence.
- Load-bearing: fails — The paper’s conclusions may not depend on it.
- Based: fails — The paper may give no reason why it holds.
Probably not a substantial claim. The paper’s conclusions may not depend on it. The paper may give no reason why it holds.
A result the paper reports from its own data — it cites no other source for it, so there is none to check. The quote shows it is in the paper.
In the paper
“Although the overall stability of an ASD diagnosis was high, examination of the data within 2-month age bands revealed that stability was selectively low at 12 months, with a stability coefficient of 0.50.”
§ Evaluation of the Diagnostic Stability of the Early Autism Spectrum Disorder Phenotype in the General Population Starting at 12 Months > Discussion
plaincorrelational- Asserted: passes — The authors put it forward as true.
- Checkable: passes — It can be checked against evidence.
- Load-bearing: passes — The paper’s conclusions depend on it.
- Based: passes — The paper gives a reason why it holds.
It may state two separate claims as one.
A result the paper reports from its own data — it cites no other source for it, so there is none to check. The quote shows it is in the paper.
In the paper
“When toddlers with ASD features were included in the calculation at 12, 14, and 16 months of age, stability coefficients increased to 0.70 at 12 months, 0.85 at 14 months, and 0.94 at 16 months.”
§ Evaluation of the Diagnostic Stability of the Early Autism Spectrum Disorder Phenotype in the General Population Starting at 12 Months > Discussion
plaindirect- Asserted: passes — The authors put it forward as true.
- Checkable: passes — It can be checked against evidence.
- Load-bearing: passes — The paper’s conclusions depend on it.
- Based: passes — The paper gives a reason why it holds.
It may state two separate claims as one.
A result the paper reports from its own data — it cites no other source for it, so there is none to check. The quote shows it is in the paper.
In the paper
“For ASD, 66 toddlers (15.9%) were classified into the early-age diagnosis group, 270 (61.2%) into the middle-age diagnosis group, and 105 (23.8%) into the late-identified group.”
§ Evaluation of the Diagnostic Stability of the Early Autism Spectrum Disorder Phenotype in the General Population Starting at 12 Months > Results > ASD Identification Patterns and Clinical Differences
plain- Asserted: passes — The authors put it forward as true.
- Checkable: passes — It can be checked against evidence.
- Load-bearing: passes — The paper’s conclusions depend on it.
- Based: passes — The paper gives a reason why it holds.
It may state two separate claims as one.
The paper states this without a source or data behind it here, so there is nothing to check it against. The quote shows it is in the paper.
In the paper
“First, it is unclear whether stability estimates from infant sibling designs would be found within a general population cohort.”
§ Evaluation of the Diagnostic Stability of the Early Autism Spectrum Disorder Phenotype in the General Population Starting at 12 Months > Introduction
hedged- Asserted: passes — The authors put it forward as true.
- Checkable: passes — It can be checked against evidence.
- Load-bearing: passes — The paper’s conclusions depend on it.
- Based: passes — The paper gives a reason why it holds.
Probably not a substantial claim.
In the paper
“but only 69% of siblings first diagnosed as having ASD at 24 months did so (ie, 27 of 39 retained diagnosis).17”
§ Evaluation of the Diagnostic Stability of the Early Autism Spectrum Disorder Phenotype in the General Population Starting at 12 Months > Introduction
What the sources say
- Not checked yetcites [17] Ozonoff S, Young GS, Landa RJ, Diagnostic stability in young children at risk for autism spectrum disorder: a baby siblings research consortium study. J Child Psychol Psychiatry. 2015; 56(9): 988- 998. doi: 10.1111/jcpp.12421 25921776 PMC4532646
plain- Asserted: passes — The authors put it forward as true.
- Checkable: passes — It can be checked against evidence.
- Load-bearing: passes — The paper’s conclusions depend on it.
- Based: passes — The paper gives a reason why it holds.
Probably not a substantial claim.
In the paper
“One of these studies reported that 93% of siblings first diagnosed as having ASD at 18 months retained that diagnosis at a final diagnostic age of 36 months,17”
§ Evaluation of the Diagnostic Stability of the Early Autism Spectrum Disorder Phenotype in the General Population Starting at 12 Months > Introduction
What the sources say
- Not checked yetcites [17] Ozonoff S, Young GS, Landa RJ, Diagnostic stability in young children at risk for autism spectrum disorder: a baby siblings research consortium study. J Child Psychol Psychiatry. 2015; 56(9): 988- 998. doi: 10.1111/jcpp.12421 25921776 PMC4532646
plain- Asserted: passes — The authors put it forward as true.
- Checkable: passes — It can be checked against evidence.
- Load-bearing: passes — The paper’s conclusions depend on it.
- Based: passes — The paper gives a reason why it holds.
Probably not a substantial claim.
The paper states this without a source or data behind it here, so there is nothing to check it against. The quote shows it is in the paper.
In the paper
“Third, clinic-referred studies are small, usually containing 50 to 100 participants, and may generate less stable results.”
§ Evaluation of the Diagnostic Stability of the Early Autism Spectrum Disorder Phenotype in the General Population Starting at 12 Months > Introduction
plain- Asserted: passes — The authors put it forward as true.
- Checkable: passes — It can be checked against evidence.
- Load-bearing: passes — The paper’s conclusions depend on it.
- Based: passes — The paper gives a reason why it holds.
Probably not a substantial claim. It may state two separate claims as one.
The paper states this without a source or data behind it here, so there is nothing to check it against. The quote shows it is in the paper.
In the paper
“yet the stability of an ASD diagnosis at this pivotal age is unknown.”
§ Evaluation of the Diagnostic Stability of the Early Autism Spectrum Disorder Phenotype in the General Population Starting at 12 Months > Introduction
plain- Asserted: passes — The authors put it forward as true.
- Checkable: passes — It can be checked against evidence.
- Load-bearing: passes — The paper’s conclusions depend on it.
- Based: passes — The paper gives a reason why it holds.
Probably not a substantial claim.
In the paper
“A previous report17 stated that most studies examining the diagnostic stability of ASD before 3 years of age have involved slightly older, clinic-referred cohorts, usually at approximately 2 years of age.”
§ Evaluation of the Diagnostic Stability of the Early Autism Spectrum Disorder Phenotype in the General Population Starting at 12 Months > Introduction
What the sources say
- Not checked yetcites [17] Ozonoff S, Young GS, Landa RJ, Diagnostic stability in young children at risk for autism spectrum disorder: a baby siblings research consortium study. J Child Psychol Psychiatry. 2015; 56(9): 988- 998. doi: 10.1111/jcpp.12421 25921776 PMC4532646
plain- Asserted: passes — The authors put it forward as true.
- Checkable: passes — It can be checked against evidence.
- Load-bearing: passes — The paper’s conclusions depend on it.
- Based: passes — The paper gives a reason why it holds.
Probably not a substantial claim.
None of the sources cited for this claim have been checked yet.
In the paper
“Although several studies have shown that early signs of ASD can sometimes be detected using parent report screens as early as 126,7,8 or 18 months of age,9,10”
§ Evaluation of the Diagnostic Stability of the Early Autism Spectrum Disorder Phenotype in the General Population Starting at 12 Months > Introduction
What the sources say
- Not checked yetcites [6] Pierce K, Carter C, Weinfeld M, Detecting, studying, and treating autism early: the one-year well-baby check-up approach. J Pediatr. 2011; 159(3): 458- 465, e451-e456. 21524759 PMC3157595 source
- Not checked yetcites [7] Wetherby AM, Brosnan-Maddox S, Peace V, Newton L Validation of the Infant-Toddler Checklist as a broadband screener for autism spectrum disorders from 9 to 24 months of age. Autism. 2008; 12(5): 487- 511. doi: 10.1177/1362361308094501 18805944 PMC2663025 source
- Not checked yetcites [8] Turner-Brown LM, Baranek GT, Reznick JS, Watson LR, Crais ER The First Year Inventory: a longitudinal follow-up of 12-month-old to 3-year-old children. Autism. 2013; 17(5): 527- 540. doi: 10.1177/1362361312439633 22781058 PMC3470769 source
hedgedcorrelational- Asserted: passes — The authors put it forward as true.
- Checkable: passes — It can be checked against evidence.
- Load-bearing: passes — The paper’s conclusions depend on it.
- Based: passes — The paper gives a reason why it holds.
Probably not a substantial claim.
None of the sources cited for this claim have been checked yet.
In the paper
“The toddler stage is also the earliest age that ASD can be detected and treatment started,6,16 yet the stability of an ASD diagnosis at this pivotal age is unknown.”
§ Evaluation of the Diagnostic Stability of the Early Autism Spectrum Disorder Phenotype in the General Population Starting at 12 Months > Introduction
What the sources say
- Not checked yetcites [6] Pierce K, Carter C, Weinfeld M, Detecting, studying, and treating autism early: the one-year well-baby check-up approach. J Pediatr. 2011; 159(3): 458- 465, e451-e456. 21524759 PMC3157595
- Not checked yetcites [16] Baranek GT, Watson LR, Turner-Brown L, Preliminary efficacy of adapted responsive teaching for infants at risk of autism spectrum disorder in a community sample. Autism Res Treat. 2015; 2015: 386951. 25648749 PMC4306223
plain- Asserted: passes — The authors put it forward as true.
- Checkable: passes — It can be checked against evidence.
- Load-bearing: passes — The paper’s conclusions depend on it.
- Based: passes — The paper gives a reason why it holds.
It may state two separate claims as one.
In the paper
“Autism spectrum disorder is a common disorder that begins in prenatal life.2”
§ Evaluation of the Diagnostic Stability of the Early Autism Spectrum Disorder Phenotype in the General Population Starting at 12 Months > Conclusions
What the sources say
- Not checked yetcites [2] Courchesne E, Pramparo T, Gazestani V, Lombardo MV, Pierce K, Lewis NE The ASD living biology: from cell proliferation to clinical phenotype. Mol Psychiatry. 2019; 24(1): 88- 107. doi: 10.1038/s41380-018-0056-y 29934544 PMC6309606 source
plain- Asserted: passes — The authors put it forward as true.
- Checkable: passes — It can be checked against evidence.
- Load-bearing: unclear — It is unclear whether the paper’s conclusions depend on it.
- Based: passes — The paper gives a reason why it holds.
It may state two separate claims as one.
None of the sources cited for this claim have been checked yet.
In the paper
“the recent finding from infant sibling studies17,18 that 50% to 80% of toddlers eventually diagnosed as having ASD at 3 years of age were not identified as having ASD by expert clinicians at 18 months of age.”
§ Evaluation of the Diagnostic Stability of the Early Autism Spectrum Disorder Phenotype in the General Population Starting at 12 Months > Introduction
What the sources say
- Not checked yetcites [17] Ozonoff S, Young GS, Landa RJ, Diagnostic stability in young children at risk for autism spectrum disorder: a baby siblings research consortium study. J Child Psychol Psychiatry. 2015; 56(9): 988- 998. doi: 10.1111/jcpp.12421 25921776 PMC4532646
- Not checked yetcites [18] Zwaigenbaum L, Bryson SE, Brian J, Stability of diagnostic assessment for autism spectrum disorder between 18 and 36 months in a high-risk cohort. Autism Res. 2016; 9(7): 790- 800. doi: 10.1002/aur.1585 26613202
plain- Asserted: passes — The authors put it forward as true.
- Checkable: passes — It can be checked against evidence.
- Load-bearing: passes — The paper’s conclusions depend on it.
- Based: passes — The paper gives a reason why it holds.
Probably not a substantial claim.
What the paper did — it cites no source for this, so there is none to check. The quote shows it is in the paper.
In the paper
“Psychologists were not masked to previous diagnoses during longitudinal test visits.”
§ Evaluation of the Diagnostic Stability of the Early Autism Spectrum Disorder Phenotype in the General Population Starting at 12 Months > Methods > Diagnostic and Psychometric Testing
plain- Asserted: passes — The authors put it forward as true.
- Checkable: passes — It can be checked against evidence.
- Load-bearing: fails — The paper’s conclusions may not depend on it.
- Based: passes — The paper gives a reason why it holds.
Probably not a substantial claim. The paper’s conclusions may not depend on it.
In the paper
“Children with ASD are detected and treated nationally at approximately 4 years of age.1”
§ Evaluation of the Diagnostic Stability of the Early Autism Spectrum Disorder Phenotype in the General Population Starting at 12 Months > Discussion
What the sources say
- Not checked yetcites [1] Baio J, Wiggins L, Christensen DL, Prevalence of autism spectrum disorder among children aged 8 years: Autism and Developmental Disabilities Monitoring Network, 11 sites, United States, 2014. MMWR Surveill Summ. 2018; 67(6): 1- 23. doi: 10.15585/mmwr.ss6706a1 29701730 PMC5919599 source
plain- Asserted: passes — The authors put it forward as true.
- Checkable: passes — It can be checked against evidence.
- Load-bearing: passes — The paper’s conclusions depend on it.
- Based: passes — The paper gives a reason why it holds.
Probably not a substantial claim.
What the paper did — it cites no source for this, so there is none to check. The quote shows it is in the paper.
In the paper
“Although unlikely, it is possible that review of this information could have biased psychologists in favor of increased diagnostic stability.”
§ Evaluation of the Diagnostic Stability of the Early Autism Spectrum Disorder Phenotype in the General Population Starting at 12 Months > Discussion > Limitations
hedgedconditional- Asserted: passes — The authors put it forward as true.
- Checkable: passes — It can be checked against evidence.
- Load-bearing: fails — The paper’s conclusions may not depend on it.
- Based: passes — The paper gives a reason why it holds.
Probably not a substantial claim. The paper’s conclusions may not depend on it.
- Rests on an assumption: DSM-5 procedures and criteria require consideration of historical information regarding ASD symptoms.
None of the sources cited for this claim have been checked yet.
In the paper
“which research suggests may be more beneficial than treatment started at older ages.26,27,28”
§ Evaluation of the Diagnostic Stability of the Early Autism Spectrum Disorder Phenotype in the General Population Starting at 12 Months > Discussion
What the sources say
- Not checked yetcites [26] Anderson DK, Liang JW, Lord C Predicting young adult outcome among more and less cognitively able individuals with autism spectrum disorders. J Child Psychol Psychiatry. 2014; 55(5): 485- 494. doi: 10.1111/jcpp.12178 24313878 PMC5819743 source
- Not checked yetcites [27] MacDonald R, Parry-Cruwys D, Dupere S, Ahearn W Assessing progress and outcome of early intensive behavioral intervention for toddlers with autism. Res Dev Disabil. 2014; 35(12): 3632- 3644. doi: 10.1016/j.ridd.2014.08.036 25241118 source
- Not checked yetcites [28] Rogers SJ, Vismara L, Wagner AL, McCormick C, Young G, Ozonoff S Autism treatment in the first year of life: a pilot study of infant start, a parent-implemented intervention for symptomatic infants. J Autism Dev Disord. 2014; 44(12): 2981- 2995. doi: 10.1007/s10803-014-2202-y 25212413 PMC4951093 source
hedgedconditional- Asserted: passes — The authors put it forward as true.
- Checkable: passes — It can be checked against evidence.
- Load-bearing: passes — The paper’s conclusions depend on it.
- Based: passes — The paper gives a reason why it holds.
Probably not a substantial claim.
In the paper
“Such transient LD cases have been commonly noted in the literature.25”
§ Evaluation of the Diagnostic Stability of the Early Autism Spectrum Disorder Phenotype in the General Population Starting at 12 Months > Discussion
What the sources say
- Not checked yetcites [25] Dale PS, Price TS, Bishop DV, Plomin R Outcomes of early language delay, I: predicting persistent and transient language difficulties at 3 and 4 years. J Speech Lang Hear Res. 2003; 46(3): 544- 560. doi: 10.1044/1092-4388(2003/044) 14696985 source
boosted- Asserted: passes — The authors put it forward as true.
- Checkable: passes — It can be checked against evidence.
- Load-bearing: fails — The paper’s conclusions may not depend on it.
- Based: passes — The paper gives a reason why it holds.
Probably not a substantial claim. The paper’s conclusions may not depend on it.
In the paper
“In many places in the United States, such experience is severely lacking.37”
§ Evaluation of the Diagnostic Stability of the Early Autism Spectrum Disorder Phenotype in the General Population Starting at 12 Months > Discussion
What the sources say
- Not checked yetcites [37] Martinez M, Thomas KC, Williams CS, Family experiences with the diagnosis of autism spectrum disorder: system barriers and facilitators of efficient diagnosis. J Autism Dev Disord. 2018; 48(7): 2368- 2378. doi: 10.1007/s10803-018-3493-1 29453706
plain- Asserted: passes — The authors put it forward as true.
- Checkable: fails — It may be too vague to check against evidence.
- Load-bearing: fails — The paper’s conclusions may not depend on it.
- Based: passes — The paper gives a reason why it holds.
Probably not a substantial claim. It may be too vague to check against evidence. The paper’s conclusions may not depend on it.
None of the sources cited for this claim have been checked yet.
In the paper
“This finding is likely related to the possibility that ASD is a dimensional rather than categorical disorder38,39”
§ Evaluation of the Diagnostic Stability of the Early Autism Spectrum Disorder Phenotype in the General Population Starting at 12 Months > Discussion
What the sources say
- Not checked yetcites [38] Elton A, Di Martino A, Hazlett HC, Gao W Neural connectivity evidence for a categorical-dimensional hybrid model of autism spectrum disorder. Biol Psychiatry. 2016; 80(2): 120- 128. doi: 10.1016/j.biopsych.2015.10.020 26707088 PMC4853295 source
- Not checked yetcites [39] Kapur S, Phillips AG, Insel TR Why has it taken so long for biological psychiatry to develop clinical tests and what to do about it? Mol Psychiatry. 2012; 17(12): 1174- 1179. doi: 10.1038/mp.2012.105 22869033 source
hedged- Asserted: passes — The authors put it forward as true.
- Checkable: passes — It can be checked against evidence.
- Load-bearing: passes — The paper’s conclusions depend on it.
- Based: passes — The paper gives a reason why it holds.
Probably not a substantial claim.
None of the sources cited for this claim have been checked yet.
In the paper
“yet most screening studies9,10,41,42 validate diagnoses only once, usually at approximately the age of screening, leaving unclear the degree to which an initial diagnosis persists at later ages.”
§ Evaluation of the Diagnostic Stability of the Early Autism Spectrum Disorder Phenotype in the General Population Starting at 12 Months > Discussion
What the sources say
- Not checked yetcites [9] Chlebowski C, Robins DL, Barton ML, Fein D Large-scale use of the modified checklist for autism in low-risk toddlers. Pediatrics. 2013; 131(4): e1121- e1127. doi: 10.1542/peds.2012-1525 23530174 PMC3608483 source
- Not checked yetcites [10] Robins DL, Casagrande K, Barton M, Chen CM, Dumont-Mathieu T, Fein D Validation of the modified checklist for autism in toddlers, revised with follow-up (M-CHAT-R/F). Pediatrics. 2014; 133(1): 37- 45. doi: 10.1542/peds.2013-1813 24366990 PMC3876182 source
- Not checked yetcites [41] Charman T, Baird G, Simonoff E, Testing two screening instruments for autism spectrum disorder in UK community child health services. Dev Med Child Neurol. 2016; 58(4): 369- 375. doi: 10.1111/dmcn.12874 26303216 source
- Not checked yetcites [42] Hardy S, Haisley L, Manning C, Fein D Can screening with the Ages and Stages Questionnaire detect autism? J Dev Behav Pediatr. 2015; 36(7): 536- 543. doi: 10.1097/DBP.0000000000000201 26348972 PMC4563819 source
plain- Asserted: passes — The authors put it forward as true.
- Checkable: passes — It can be checked against evidence.
- Load-bearing: passes — The paper’s conclusions depend on it.
- Based: passes — The paper gives a reason why it holds.
It may state two separate claims as one.
What the paper did — it cites no source for this, so there is none to check. The quote shows it is in the paper.
In the paper
“Our study was not designed to determine whether such early treatments affected the speed with which toddlers caught up by the time they reached final diagnosis age.”
§ Evaluation of the Diagnostic Stability of the Early Autism Spectrum Disorder Phenotype in the General Population Starting at 12 Months > Discussion
plain- Asserted: passes — The authors put it forward as true.
- Checkable: passes — It can be checked against evidence.
- Load-bearing: fails — The paper’s conclusions may not depend on it.
- Based: passes — The paper gives a reason why it holds.
Probably not a substantial claim. The paper’s conclusions may not depend on it.
What the paper did — it cites no source for this, so there is none to check. The quote shows it is in the paper.
In the paper
“Although this was not a screening study and the cohort contained approximately 25% community-referred cases”
§ Evaluation of the Diagnostic Stability of the Early Autism Spectrum Disorder Phenotype in the General Population Starting at 12 Months > Discussion
plain- Asserted: passes — The authors put it forward as true.
- Checkable: passes — It can be checked against evidence.
- Load-bearing: unclear — It is unclear whether the paper’s conclusions depend on it.
- Based: passes — The paper gives a reason why it holds.
It may state two separate claims as one.
In the paper
“A newer study,20 however, suggests that such so-called late-onset cases may be attributable to weaknesses inherent in standardized diagnostic tools at early ages, rather than a lack of observable ASD symptoms per se.”
§ Evaluation of the Diagnostic Stability of the Early Autism Spectrum Disorder Phenotype in the General Population Starting at 12 Months > Introduction
What the sources say
- Not checked yetcites [20] Bacon EC, Courchesne E, Barnes CC, Rethinking the idea of late autism spectrum disorder onset. Dev Psychopathol. 2018; 30(2): 553- 569. doi: 10.1017/S0954579417001067 28803559 PMC10515446 source
hedgedconditional- Asserted: fails — The authors may not put it forward as true.
- Checkable: passes — It can be checked against evidence.
- Load-bearing: passes — The paper’s conclusions depend on it.
- Based: passes — The paper gives a reason why it holds.
Probably not a substantial claim. The authors may not put it forward as true.
In the paper
“Research from the ADOS-2 developers cautions that it is not valid for use with toddlers who have a nonverbal mental age younger than 12 months,24”
§ Evaluation of the Diagnostic Stability of the Early Autism Spectrum Disorder Phenotype in the General Population Starting at 12 Months > Discussion
What the sources say
- Not checked yetcites [24] Luyster R, Gotham K, Guthrie W, The Autism Diagnostic Observation Schedule-toddler module: a new module of a standardized diagnostic measure for autism spectrum disorders. J Autism Dev Disord. 2009; 39(9): 1305- 1320. doi: 10.1007/s10803-009-0746-z 19415479 PMC2893552
plain- Asserted: passes — The authors put it forward as true.
- Checkable: passes — It can be checked against evidence.
- Load-bearing: fails — The paper’s conclusions may not depend on it.
- Based: passes — The paper gives a reason why it holds.
Probably not a substantial claim. The paper’s conclusions may not depend on it.
In the paper
“particularly when early screening starting at 18 months is recommended by the American Academy of Pediatrics,40”
§ Evaluation of the Diagnostic Stability of the Early Autism Spectrum Disorder Phenotype in the General Population Starting at 12 Months > Discussion
What the sources say
- Not checked yetcites [40] Johnson CP, Myers SM; American Academy of Pediatrics Council on Children With Disabilities Identification and evaluation of children with autism spectrum disorders. Pediatrics. 2007; 120(5): 1183- 1215. doi: 10.1542/peds.2007-2361 17967920
plain- Asserted: passes — The authors put it forward as true.
- Checkable: passes — It can be checked against evidence.
- Load-bearing: passes — The paper’s conclusions depend on it.
- Based: passes — The paper gives a reason why it holds.
Probably not a substantial claim.
In the paper
“This finding is consistent with an infant sibling study17 that reported lower-than-expected language scores on the Mullen Scales of Early Learning test within their late-identified group.”
§ Evaluation of the Diagnostic Stability of the Early Autism Spectrum Disorder Phenotype in the General Population Starting at 12 Months > Discussion
What the sources say
- Not checked yetcites [17] Ozonoff S, Young GS, Landa RJ, Diagnostic stability in young children at risk for autism spectrum disorder: a baby siblings research consortium study. J Child Psychol Psychiatry. 2015; 56(9): 988- 998. doi: 10.1111/jcpp.12421 25921776 PMC4532646
plaincorrelational- Asserted: passes — The authors put it forward as true.
- Checkable: passes — It can be checked against evidence.
- Load-bearing: fails — The paper’s conclusions may not depend on it.
- Based: passes — The paper gives a reason why it holds.
Probably not a substantial claim. The paper’s conclusions may not depend on it.
In the paper
“Given caution from the ADOS developers regarding use of the ADOS with toddlers with nonverbal mental ages younger than 12 months and those who are not ambulatory,24 stability coefficients were also recalculated after removing such cases.”
§ Evaluation of the Diagnostic Stability of the Early Autism Spectrum Disorder Phenotype in the General Population Starting at 12 Months > Methods > Statistics and Data Visualization
What the sources say
- Not checked yetcites [24] Luyster R, Gotham K, Guthrie W, The Autism Diagnostic Observation Schedule-toddler module: a new module of a standardized diagnostic measure for autism spectrum disorders. J Autism Dev Disord. 2009; 39(9): 1305- 1320. doi: 10.1007/s10803-009-0746-z 19415479 PMC2893552
plain- Asserted: passes — The authors put it forward as true.
- Checkable: passes — It can be checked against evidence.
- Load-bearing: fails — The paper’s conclusions may not depend on it.
- Based: passes — The paper gives a reason why it holds.
Probably not a substantial claim. The paper’s conclusions may not depend on it.
In the paper
“Because of this, there is a demand for early detection, intervention, and services,5 and,in response, marked effort and funding have gone into discovery of methods for early-age universal screening, detection, and diagnosis.”
§ Evaluation of the Diagnostic Stability of the Early Autism Spectrum Disorder Phenotype in the General Population Starting at 12 Months > Conclusions
What the sources say
- Not checked yetcites [5] Pierce K, Courchesne E, Bacon E To screen or not to screen universally for autism is not the question: why the task force got it wrong. J Pediatr. 2016; 176: 182- 194. doi: 10.1016/j.jpeds.2016.06.004 27421956 PMC5679123
plaindirect- Asserted: passes — The authors put it forward as true.
- Checkable: passes — It can be checked against evidence.
- Load-bearing: fails — The paper’s conclusions may not depend on it.
- Based: passes — The paper gives a reason why it holds.
Probably not a substantial claim. The paper’s conclusions may not depend on it. It may state two separate claims as one.
The paper relies on this without support.
The 1269 toddlers longitudinally evaluated are representative of the general population of toddlers.
“A total of 2241 toddlers 12 to 36 months of age were referred for a diagnostic evaluation to an autism expert evaluation center created at University of California, San Diego.”
“A total of 1269 of the 2241 toddlers were longitudinally evaluated 2 or more times and were the focus of this study.”
The paper relies on this without support.
The final diagnostic evaluation at the last visit provides a valid reference standard for true ASD diagnostic status.
“A toddler was designated as having 1 of the following: ASD, ASD features, developmental delay, language delay (LD), other issue, TD, or typical sibling of an ASD proband.”
“Stability coefficients were first calculated within 2-month age bands by determining the proportion of toddlers with a particular diagnosis at their first diagnostic visit who retained that same diagnosis at their last visit.”
The paper relies on this without support.
The lack of masking of psychologists to previous diagnoses did not materially bias the diagnostic stability estimates.
“Psychologists were not masked to previous diagnoses during longitudinal test visits.”
The paper relies on this without support.
The human brain has an enormous capacity to resculpt and remodel, particularly during the first postnatal years.
“The human brain has an enormous capacity to resculpt and remodel, particularly during the first postnatal years.”
The paper relies on this without support.
DSM-5 procedures and criteria require consideration of historical information regarding ASD symptoms.
“This lack of masking was because DSM-5 procedures and criteria require consideration of historical information regarding ASD symptoms.”
Self-check
Percentages, sums and reported differences re-computed from the paper’s own numbers.
Rated minor: it would not touch a result — a value no result rests on, a p-value that stays on the same side of the significance level, or a conflict that is clerical, resolved elsewhere in the paper, or outside its own findings.
In the paper
“For ASD, 66 toddlers (15.9%) were classified into the early-age diagnosis group, 270 (61.2%) into the middle-age diagnosis group, and 105 (23.8%) into the late-identified group.”
§ Evaluation of the Diagnostic Stability of the Early Autism Spectrum Disorder Phenotype in the General Population Starting at 12 Months > Results > ASD Identification Patterns and Clinical Differences
Reported 15.9 · recomputed 14.965986
Rated minor: it would not touch a result — a value no result rests on, a p-value that stays on the same side of the significance level, or a conflict that is clerical, resolved elsewhere in the paper, or outside its own findings.
In the paper
“| Male | 361 (81.9) | 68 (87.2) | 66 (74.2) | 58 (72.5) | 61 (67.0) | 26 (51.0) | 278 (65.6) |”
§ Evaluation of the Diagnostic Stability of the Early Autism Spectrum Disorder Phenotype in the General Population Starting at 12 Months > Methods > Diagnostic and Psychometric Testing
Reported 65.6 · recomputed 63.32574
Citations
Cites
Baio, J., Wiggins, L., Christensen, D. L., Maenner, M. J., Daniels, J., Warren, Z., Kurzius-Spencer, M., Zahorodny, W., Robinson, C., Rosenberg, et al. (2018) · MMWR. Surveillance Summaries · doi:10.15585/mmwr.ss6706a1 · Cited by 6,078
Dawson, G., Rogers, S., Munson, J., Smith, M., Winter, J., Greenson, J., Donaldson, A., & Varley, J. (2010) · Pediatrics · doi:10.1542/peds.2009-0958 · Cited by 2,835
Variability in Early Communicative Development
Fenson, L., Dale, P. S., Reznick, J. S., Bates, E., Thal, D. J., Pethick, S. J., Tomasello, M., Mervis, C. B., & Stiles, J. (1994) · Monographs of the Society for Research in Child Development · doi:10.2307/1166093 · Cited by 2,790
Synaptic density in human frontal cortex —Developmental changes and effects of aging
Peter R., H. (1979) · Brain Research · doi:10.1016/0006-8993(79)90349-4 · Cited by 2,645
Neural consequences of enviromental enrichment
van Praag, H., Kempermann, G., & Gage, F. H. (2000) · Nature Reviews Neuroscience · doi:10.1038/35044558 · Cited by 2,468
Mullen Scales of Early Learning
Bradley‐Johnson, S. (1997) · Psychology in the Schools · doi:10.1002/(sici)1520-6807(199710)34:4 · Cited by 2,329
Identification and Evaluation of Children With Autism Spectrum Disorders
Johnson, C. P., Myers, S. M., & and the Council on Children With Disabilities (2007) · Pediatrics · doi:10.1542/peds.2007-2361 · Cited by 2,011
Enriched environments, experience-dependent plasticity and disorders of the nervous system
Nithianantharajah, J., & Hannan, A. J. (2006) · Nature Reviews Neuroscience · doi:10.1038/nrn1970 · Cited by 1,771
Autism Diagnostic Observation Schedule
Lord, C., Rutter, M. L., Goode, S., Heemsbergen, J., Jordan, H., Mawhood, L., & Schopler, E. (1989) · PsycTESTS Dataset · doi:10.1037/t54175-000 · Cited by 1,697
Validation of the Modified Checklist for Autism in Toddlers, Revised With Follow-up (M-CHAT-R/F)
Robins, D. L., Casagrande, K., Barton, M., Chen, C.-M. A., Dumont-Mathieu, T., & Fein, D. (2014) · Pediatrics · doi:10.1542/peds.2013-1813 · Cited by 1,081
Research works printed but not linked: 1
- Sparrow, 2005, Vineland-II Scales of Adaptive Behavior: Survey Form Manual
Cited by
Sorted by citations
Items 301–333 of 333
Chuang, P.-C., Hou, Y., Iao, L., & Wu, C. (2025) · Research in Autism · doi:10.1016/j.reia.2025.202645
Haque, M. M., Islam, M. A., Rabbani, M., Das, D., Schwichtenberg, A. J., Bansal, N. K., Soron, T. R., Akhter, S., Parveen, S., Begum, A., et al. (2025) · EAI Endorsed Transactions on Pervasive Health and Technology · doi:10.4108/eetpht.11.9981
Bekele, T. A., Woodman, A. C., McDermott, J. M., & Harvey, L. (2025) · Journal of Applied Developmental Psychology · doi:10.1016/j.appdev.2025.101860
Khlaif, A. I., Naceur, M. S., & Kherallah, M. (2025) · Lecture notes in networks and systems · doi:10.1007/978-3-031-90893-4_71
Autism Diagnosis Patterns in Bolivia
DuBay, M. F., Howard, M., & Cárdenas, G. (2025) · Research in Autism · doi:10.1016/j.reia.2025.202763
Perry, B., Cooper, J. J., Zhang, R., & Harrison, M. (2025) · Journal of Developmental & Behavioral Pediatrics · doi:10.1097/dbp.0000000000001442
Xiao, Y., Wen, T. H., Kupis, L. B., Eyler, L. T., Taluja, V., Troxel, J., Goel, D., Lombardo, M. V., Pierce, K., & Courchesne, E. (2023) · Figshare · doi:10.6084/m9.figshare.22623109
Self-citationCourchesne, E., Taluja, V., Nazari, S., Aamodt, C., Pierce, K., Duan, K., Stophaeros, S. L., Lopez, L., Barnes, C. C., Troxel, J., et al. (2024) · Figshare · doi:10.6084/m9.figshare.26725550
Self-citationCourchesne, E., Taluja, V., Nazari, S., Aamodt, C., Pierce, K., Duan, K., Stophaeros, S. L., Lopez, L., Barnes, C. C., Troxel, J., et al. (2024) · Figshare · doi:10.6084/m9.figshare.26725556
Self-citationCourchesne, E., Taluja, V., Nazari, S., Aamodt, C., Pierce, K., Duan, K., Stophaeros, S. L., Lopez, L., Barnes, C. C., Troxel, J., et al. (2024) · Figshare · doi:10.6084/m9.figshare.26725559
Self-citationCourchesne, E., Taluja, V., Nazari, S., Aamodt, C., Pierce, K., Duan, K., Stophaeros, S. L., Lopez, L., Barnes, C. C., Troxel, J., et al. (2024) · Figshare · doi:10.6084/m9.figshare.26725553
Self-citationCourchesne, E., Taluja, V., Nazari, S., Aamodt, C., Pierce, K., Duan, K., Stophaeros, S. L., Lopez, L., Barnes, C. C., Troxel, J., et al. (2024) · Figshare · doi:10.6084/m9.figshare.26725562
Self-citationAhn, S., Oh, J.-H., Kang, Y. G., Oh, D. E., Lee, T., Kim, S., Hyun, Y., Sung, C. O., & Kim, H.-W. (2026) · Progress in Neuro-Psychopharmacology and Biological Psychiatry · doi:10.1016/j.pnpbp.2026.111655
Trajectories of Autism Symptoms and Overlapping Patterns in a Chinese Cohort From 18 to 36 Months
Zhang, L., Xu, Y., Liu, L., Xing, Y., You, C., Lv, S., Huang, H., Zou, Y., Liang, F., Ye, Q., et al. (2026) · Autism Research · doi:10.1002/aur.70219
Avaliação de habilidades pragmáticas de crianças pequenas com e sem diagnóstico de TEA
Sun, I. Y. I., Santos, T. H. F., & Fernandes, F. D. M. (2026) · CoDAS · doi:10.1590/2317-1782/e20250083pt
Assessing pragmatic abilities of small children with and without ASD diagnosis
Sun, I. Y. I., Santos, T. H. F., & Fernandes, F. D. M. (2026) · CoDAS · doi:10.1590/2317-1782/e20250083en
The 3‐Hit Metabolic Signaling Model for Autism Spectrum Disorder: A Summary
Naviaux, R. K. (2026) · Autism Research · doi:10.1002/aur.70228 · Cited by 1
Garner, P. W., Shadur, J. M., & Bassett, H. H. (2026) · Springer eBooks · doi:10.1007/978-3-032-14688-5_9
Fontaine, T. J.-L., Baduel, S., Guillon, Q., & Batty, M. (2026) · Enfance · doi:10.3917/enf2.261.0003
Antolí, A., & Chía, L. (2026) · Acta Psychologica · doi:10.1016/j.actpsy.2026.107156
Modern vıews on features of clınıc, dıagnosıs of autısm spectrum dısorders ın chıldren
Dzhanbakhyshova, E. C., & Asadov, B. (2026) · Azərbaycan Psixiatriya Jurnalı · doi:10.66642/jxhi7630
Universal Autism Screening in Early Learning Programs: A Feasibility Study
Dumont-Mathieu, T. M., Barton, M. L., Chuckta, R., Martinez, N. S., & FEIN, D. A. (2026) · Children · doi:10.3390/children13060775
Autism Spectrum Disorder in Childhood
Sterrett, K., Schiltz, H. K., Byrne, K., & Lord, C. (2026) · Cambridge University Press eBooks · doi:10.1017/9781009706896
Zhang, X., Chen, Y., Meng, Q., Li, K. E., Cao, Y., Zhao, Y., & Han, R. (2026) · Lecture notes in computer science · doi:10.1007/978-981-92-3498-1_27
Ai, D., Hu, B., Wei, Q., Zhang, D., Zhang, Y., Zhang, H., Xiong, Y., 聂, 欣., Cai, Y., Chen, J. S., et al. (2026) · BMC Psychiatry · doi:10.1186/s12888-026-08274-9
de Marchena, A. B., Wieckowski, A. T., Dickerson, A. F., Cheng, H. S., Liz, G. P., Dubin, A. H., Vivanti, G., Barton, M. L., FEIN, D. A., & Robins, D. L. (2026) · Autism · doi:10.1177/13623613261464200
Kaat, A. J., Campagna, A., Feiner, H., Grauzer, J. M., Hobson, A. N., Jones, M. K., Lee, J. P., Sudec, L., & Roberts, M. Y. (2026) · JCPP Advances · doi:10.1002/jcv2.70157
Chumkomlue, Y., Laopongsit, A., Homkham, N., Srikummoon, P., Koobubpha, K., & Traisathit, P. (2026) · International Journal of Developmental Disabilities · doi:10.1080/20473869.2026.2712433
Shao, Z., Zhang, L., Zhang, Y., Guo, L., Luo, Y., Meng, Z., 匡桂芳, Hong, Q., Tian, X., Wang, Z., et al. (2026) · Frontiers in Psychiatry · doi:10.3389/fpsyt.2026.1810421
Kurmashev, R. (2026) · International Journal of Developmental Disabilities · doi:10.1080/20473869.2026.2726331
Doruk, O., Adsız, G., Ünsal, S., & Elgörmüş, M. N. (2026) · Journal of Autism and Developmental Disorders · doi:10.1007/s10803-026-07556-1
Muthuka, J. K., Wanjiku, L. N., Onyango, C., Oluoch, K., Kioko, M., Maluki, J., Nzioki, J. M., & Kim, S. (2026) · Cureus · doi:10.7759/cureus.117972
Metadata
- Authors
- Pierce, K., Gazestani, V. H., Bacon, E., Barnes, C. C., Cha, D., Nalabolu, S., Lopez, L., Moore, A., Pence-Stophaeros, S., & Courchesne, E.
- Affiliations
- University of California San Diego (US)
- Department of Neurosciences, University of California, San Diego, La Jolla
- Corresponding author
- Pierce, Karen
- ORCID
- Venue
- JAMA Pediatrics
- Publisher
- American Medical Association (AMA)
- Published
- 2019-06-01
- Volume
- 173
- Issue
- 6
- Pages
- 578
- ISSN
- 1072-4710 (ISSN-L)
- 2168-6203
- PMC
- PMC6547081
- OpenAlex
- W2941892929
- Semantic Scholar
- 0a120397c84a76e8bcf0e8b038a0df35e679579c
- Cited by
- 333
- References
- 46
- Citations by year
- 2026: 27 · 2025: 39 · 2024: 43 · 2023: 49 · 2022: 65 · 2021: 66 · 2020: 32 · 2019: 11
- FWCI
- 25.27
- Type
- journal article
- Language
- en
- Open access
- hybrid
- doi.org
- Licence
- cc-by
- Locations
- Archives of Pediatrics and Adolescent Medicine (publishedVersion, cc-by)
- Europe PMC (PubMed Central) (publishedVersion, cc-by)
- PubMed Central (publishedVersion, cc-by)
- PubMed (publishedVersion)
- Funders
- National Institutes of Health (5r01mh110558-05)
- National Institute of Mental Health (R01MH104446, R01-MH110558, R01MH036840, P50MH081755)
- National Institute on Deafness and Other Communication Disorders (R01DC016385)
- Topics
- Life Sciences › Neuroscience › Cognitive Neuroscience › Autism Spectrum Disorder Research
- Health Sciences › Medicine › Psychiatry and Mental health › Child Nutrition and Feeding Issues
- Social Sciences › Psychology › Developmental and Educational Psychology › Language Development and Disorders
- Keywords
- autism spectrum disorder, diagnostic stability, toddlers, primary care, developmental delay, language delay, sex differences, age differences, typical development
- MeSH terms
- Autism Spectrum Disorder, Developmental Disabilities, Child, Preschool, Female, Follow-Up Studies, Humans, Infant, Male, Mass Screening, Phenotype, Primary Health Care, Prospective Studies, Psychiatric Status Rating Scales, Referral and Consultation, Logistic Models, Early Diagnosis
About these checks
Registry, retraction, Cites and statistics results are computed, not judged, with one exception: a printed reference that no index lists is read once by a model before it counts as a citation error. Claims are extracted by a model and kept only when their quote appears verbatim in the text; each cited source is then checked, with a model’s help, for whether it says what the claim relies on. Those verdicts can be wrong — read the claim’s quote and the cited source before relying on one.
A language model drew the claims from the paper on 2026-10-07, under version 3 of the claim definition (model deepseek-v4.1-flash, prompt extract-v3).
A second model labelled each claim on 2026-10-07 (model jev-1.13-20260917, definition revision gold-guideline-v0.2).
Statistics and arithmetic are recomputed, not judged.
Confidence bands are shown only for fields calibrated on our annotated test set. None is calibrated yet, so no band is shown.
What counts as a claim ›How we measure confidence ›How we check this ›
Are you an author, or do you see a problem with this page? Request a review
