

The DOI matches its Crossref record; 37 of the 37 references it cites were found in a registry or an index.
Single‐Cell Mass Spectrometry for Discovery Proteomics: Quantifying Translational Cell Heterogeneity in the 16‐Cell Frog (Xenopus) Embryo
Open accessAbstract
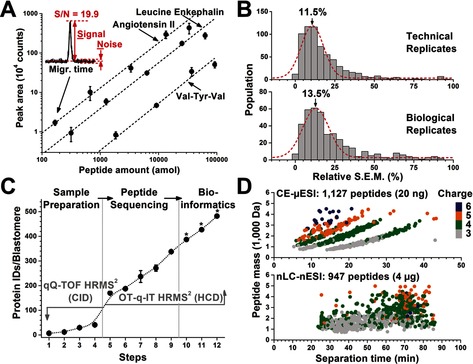
We advance mass spectrometry from a cell population‐averaging tool to one capable of quantifying the expression of diverse proteins in single embryonic cells. Our instrument combines capillary electrophoresis (CE), electrospray ionization, and a tribrid ultrahigh‐resolution mass spectrometer (HRMS) to enable untargeted (discovery) proteomics with ca. 25 amol lower limit of detection. CE‐μESI‐HRMS enabled the identification of 500–800 nonredundant protein groups by measuring 20 ng, or <0.2% of the total protein content in single blastomeres that were isolated from the 16‐cell frog (Xenopus laevis) embryo, amounting to a total of 1709 protein groups identified between n=3 biological replicates. By quantifying ≈150 nonredundant protein groups between all blastomeres and replicate measurements, we found significant translational cell heterogeneity along multiple axes of the embryo at this very early stage of development when the transcriptional program of the embryo has yet to begin.
Overview
The claims and statistics of this paper haven’t been checked yet.
Free: it reads the open-access text and checks the first 5 claims that cite a source we can check. Create a free account to check every claim.
Integrity signals
Registry
Cites
Statistics
Figures


Verification
Claims the paper makes
The claims and statistics of this paper haven’t been checked yet.
Free: it reads the open-access text and checks the first 5 claims that cite a source we can check. Create a free account to check every claim.
Claims other papers make about this one
Each is checked against this paper’s own text: does it say what the citing paper says it does?
The cited source says what the claim attributes to it.
In the citing paper
“In this study, the quantification of ~150 non-redundant protein groups revealed significant translational cell heterogeneity along multiple axes of the embryo at very early stage of development.”
From Recent trends of capillary electrophoresis‐mass spectrometry in proteomics research (2019) · cites this paper as [130]
Self-check
Percentages, sums and reported differences re-computed from the paper’s own numbers.
The self-check needs the paper’s full text.
Citations
Cites
Bendall, S. C., Simonds, E. F., Qiu, P., Amir, E.-A. D., Krutzik, P. O., Finck, R., Bruggner, R. V., Melamed, R., Trejo, A., Ornatsky, O. I., et al. (2011) · Science · doi:10.1126/science.1198704 · Cited by 2,279
A draft map of the human proteome
Kim, M.-S., Pinto, S. M., Getnet, D., Nirujogi, R. S., Manda, S. S., Chaerkady, R., Madugundu, A. K., Kelkar, D. S., Isserlin, R., Jain, S., et al. (2014) · Nature · doi:10.1038/nature13302 · Cited by 2,198
Ishihama, Y., Oda, Y., Tabata, T., Sato, T., Nagasu, T., Rappsilber, J., & Mann, M. (2005) · Molecular & Cellular Proteomics · doi:10.1074/mcp.m500061-mcp200 · Cited by 2,055
Protein Analysis by Shotgun/Bottom-up Proteomics
Zhang, Y., Fonslow, B. R., Shan, B., Baek, M.-C., & Yates, J. R. (2013) · Chemical Reviews · doi:10.1021/cr3003533 · Cited by 1,491
Cellular Heterogeneity: Do Differences Make a Difference?
Altschuler, S. J., & Wu, L. F. (2010) · Cell · doi:10.1016/j.cell.2010.04.033 · Cited by 1,214
Hebert, A. S., Richards, A. L., Bailey, D. J., Ulbrich, A., Coughlin, E. E., Westphall, M. S., & Coon, J. J. (2014) · Molecular & Cellular Proteomics · doi:10.1074/mcp.m113.034769 · Cited by 528
Attomole Protein Characterization by Capillary Electrophoresis-Mass Spectrometry
Valaskovic, G. A., Kelleher, N. L., & McLafferty, F. W. (1996) · Science · doi:10.1126/science.273.5279.1199 · Cited by 398
Fates of the blastomeres of the 32-cell-stage Xenopus embryo
Moody, S. A. (1987) · Developmental Biology · doi:10.1016/0012-1606(87)90296-x · Cited by 381
Self-citationProfiling metabolites and peptides in single cells
Rubakhin, S. S., Romanova, E. V., Nemes, P., & Sweedler, J. V. (2011) · Nature Methods · doi:10.1038/nmeth.1549 · Cited by 347
Self-citationAntagonizing the Spemann organizer: role of the homeobox gene Xvent-1.
Gawantka, V., Delius, H., Hirschfeld, K., Blumenstock, C., & Niehrs, C. (1995) · The EMBO Journal · doi:10.1002/j.1460-2075.1995.tb00317.x · Cited by 330
Cited by
Budnik, B., Levy, E., Harmange, G., & Slavov, N. (2018) · Genome Biology · doi:10.1186/s13059-018-1547-5 · Cited by 832
“low-input samples can also be separated by capillary electrophoresis [29].”
BackgroundZhu, Y., Piehowski, P. D., Zhao, R., Chen, J., Shen, Y., Moore, R. J., Shukla, A. K., Petyuk, V. A., Campbell-Thompson, M., Mathews, C. E., et al. (2018) · Nature Communications · doi:10.1038/s41467-018-03367-w · Cited by 587
Single-cell proteomic and transcriptomic analysis of macrophage heterogeneity using SCoPE2
Specht, H., Emmott, E., Petelski, A. A., Huffman, R. G., Perlman, D. H., Serra, M., Kharchenko, P., Koller, A., & Slavov, N. (2021) · Genome Biology · doi:10.1186/s13059-021-02267-5 · Cited by 493
Single-cell Proteomics: Progress and Prospects
Kelly, R. T. (2020) · Molecular & Cellular Proteomics · doi:10.1074/mcp.r120.002234 · Cited by 356
Single-cell proteomics enabled by next-generation sequencing or mass spectrometry
Bennett, H. M., Stephenson, W., Rose, C. M., & Darmanis, S. (2023) · Nature Methods · doi:10.1038/s41592-023-01791-5 · Cited by 351
Metadata
- Authors
- Lombard‐Banek, C., Moody, S. A., & Nemes, P.
- Affiliations
- George Washington University (US)
- Department of Chemistry W. M. Keck Institute for Proteomics Technology and Applications The George Washington University 800 22ndStreet, NW, Suite 4000 Washington DC 20052 USA
- Venue
- Angewandte Chemie International Edition
- Publisher
- Wiley
- Published
- 2016-01-12
- Volume
- 55
- Issue
- 7
- Pages
- 2454-2458
- ISSN
- 1433-7851 (ISSN-L)
- 1521-3773
- PMC
- PMC4755155
- OpenAlex
- W2237943218
- Cited by
- 214
- References
- 37
- Citations by year
- 2026: 5 · 2025: 16 · 2024: 15 · 2023: 20 · 2022: 12 · 2021: 26 · 2020: 25 · 2019: 28 · 2018: 38 · 2017: 19 · 2016: 10
- FWCI
- 15.74
- Type
- journal article
- Language
- en
- Open access
- hybrid
- doi.org
- Licence
- Locations
- Angewandte Chemie International Edition (publishedVersion, cc-by-nc)
- Europe PMC (PubMed Central) (publishedVersion, cc-by-nc)
- PubMed Central (publishedVersion, cc-by-nc)
- PubMed (publishedVersion)
- Funders
- National Science Foundation (DBI-1455474)
- Topics
- Physical Sciences › Chemistry › Spectroscopy › Advanced Proteomics Techniques and Applications
- Physical Sciences › Chemistry › Spectroscopy › Mass Spectrometry Techniques and Applications
- Life Sciences › Biochemistry, Genetics and Molecular Biology › Molecular Biology › Metabolomics and Mass Spectrometry Studies
- Keywords
- single-cell proteomics, discovery proteomics, Xenopus laevis embryos, blastomeres, capillary electrophoresis, electrospray ionization, ultrahigh-resolution mass spectrometry, protein expression quantification, early embryonic development, cell-to-cell variability
- MeSH terms
- Animals, Embryo, Nonmammalian, Xenopus, Spectrometry, Mass, Electrospray Ionization, Proteomics
About these checks
Registry, retraction, Cites and statistics results are computed, not judged, with one exception: a printed reference that no index lists is read once by a model before it counts as a citation error. Claims are extracted by a model and kept only when their quote appears verbatim in the text; each cited source is then checked, with a model’s help, for whether it says what the claim relies on. Those verdicts can be wrong — read the claim’s quote and the cited source before relying on one.
Statistics and arithmetic are recomputed, not judged.
Confidence bands are shown only for fields calibrated on our annotated test set. None is calibrated yet, so no band is shown.
What counts as a claim ›How we measure confidence ›How we check this ›
Are you an author, or do you see a problem with this page? Request a review
How to cite
Cite CoChat for the checks on this page, and the paper for its own findings.
- This page
- CoChat. (2026). Citation check: Single‐Cell Mass Spectrometry for Discovery Proteomics: Quantifying Translational Cell Heterogeneity in the 16‐Cell Frog (Xenopus) Embryo. https://app.cochat.ai/papers/10.1002/anie.201510411
- The paper
- Lombard‐Banek, C., Moody, S. A., & Nemes, P. (2016). Single‐Cell Mass Spectrometry for Discovery Proteomics: Quantifying Translational Cell Heterogeneity in the 16‐Cell Frog (Xenopus) Embryo. Angewandte Chemie International Edition. https://doi.org/10.1002/anie.201510411
Data sources
Bibliographic data: Semantic Scholar, OpenAlex, Crossref.
Contains information from the Semantic Scholar Academic Graph Datasets, made available under the ODC Attribution License (ODC-BY 1.0).
Semantic Scholar’s data is described in: Kinney, R., et al. (2023). The Semantic Scholar Open Data Platform. arXiv:2301.10140.
