

The DOI matches its Crossref record; 54 of the 55 references it cites were found in a registry or an index; 7 of the 32 sources its claims cite were checked for support.
Spatial analysis of distribution grid capacity and costs to enable massive deployment of PV, electric mobility and electric heating
Open accessAbstract
Rapid deployment of solar photovoltaics (PV), electric heat pumps (HP) and electric vehicles (EV) is needed to decarbonize the economy. However, the integration of these technologies into the power system creates challenges for the distribution grid infrastructure. It is therefore vital to analyse to which extent grid reinforcement is needed to enable decarbonization strategies while also studying alternative flexibility measures. In this GIS-based study, we model the impact of the deployment of PV, HP and EV on a low-voltage distribution grid network serving 170’000 households in Switzerland, and analyse scenarios for their penetration in the years 2035 and 2050. Using a detailed grid model in collaboration with a distribution system operator, we find that PV leads to 18.5% and 13.7% more voltage violation issues compared to HP and EV respectively, which on the other hand, cause slightly more line overloading, 0.5% and 2.5%, respectively. We also find that grid reinforcement costs markedly depend on the type of urban setting ranging between 51–213 CHF/kWp, 46–1’385 CHF/kW and 34–143 CHF/kW for PV, HP and EV, respectively, with the higher limit corresponding to rural areas. The total distribution grid reinforcement costs can amount up to 11 billion CHF until 2050 i.e. 2’900 CHF per household in Switzerland. Interestingly, we find that batteries, even with current costs, have the potential to defer grid reinforcement for up to 15% of the transformer stations with the highest specific grid reinforcement costs. Our study aims to inform various stakeholders about the required grid investments to enable the massive deployment of low carbon technologies.
Overview
AI snapshot
Written from the paper’s full text.
TL;DR
This GIS-based study models PV, heat pump (HP), and EV deployment on a low-voltage distribution grid serving 170,000 Swiss households in 2035 and 2050, using scenarios and detailed DSO grid modeling. It finds PV drives more voltage violations while HP/EV drive more line overloading, and estimates substantial grid reinforcement costs that vary by urban setting and can reach 11 billion CHF nationally by 2050, with batteries able to defer some reinforcement.
Key findings
- PV leads to 18.5% and 13.7% more voltage violation issues compared to HP and EV, respectively; HP and EV cause slightly more line overloading, 0.5% and 2.5%, respectively.
- Specific grid reinforcement costs range from 51–213 CHF/kWp for PV, 46–1,385 CHF/kW for HP, and 34–143 CHF/kW for EV, with the higher limit corresponding to rural areas.
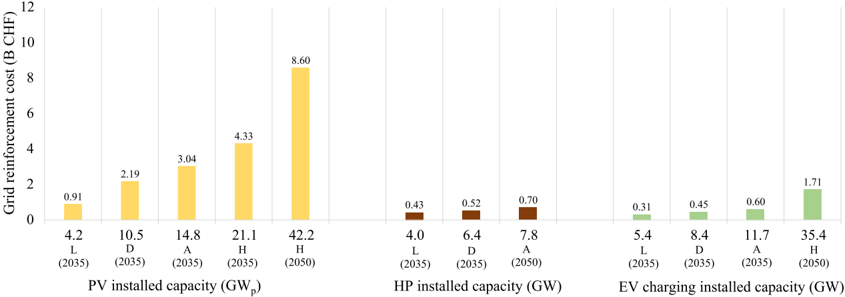
- Total distribution grid reinforcement costs can amount to up to 11 billion CHF until 2050, i.e. about 2,900 CHF per household in Switzerland; in 2035 the heroic scenario totals 5.4B CHF, or around 1,440 CHF per household.
- Batteries, even with current costs, can defer grid reinforcement for up to 15% of transformer stations with the highest specific grid reinforcement costs; for determined and aggressive PV scenarios this drops to 5%.
Methods
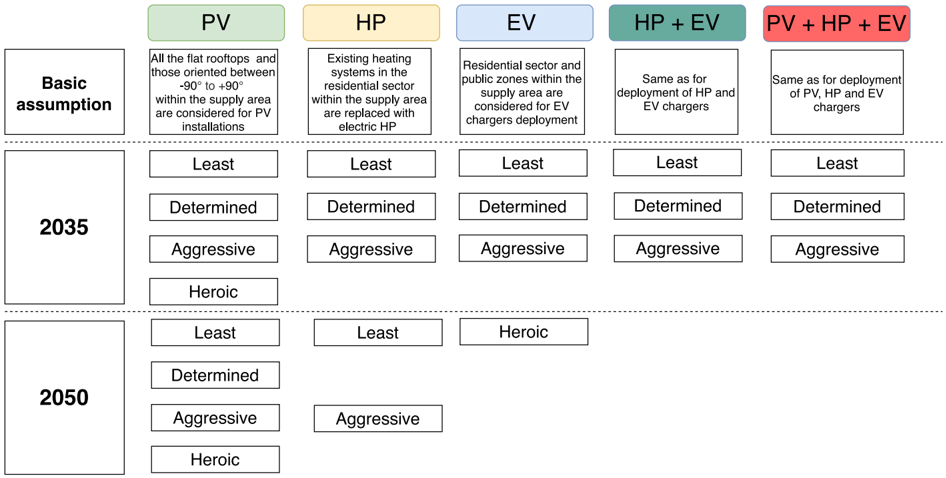
- GIS-based modeling of rooftop PV, residential HP, and EV charging deployment in a real DSO supply area of 170,000 households (population 379,100), with least, determined, aggressive, and heroic effort scenarios for 2035 and 2050.
- A detailed low-voltage distribution grid model from DSO BKW runs load flow calculations to identify voltage violations, line overloading, and transformer overloading, then applies iterative reinforcement using empirical DSO costs.
- Regression analysis relates installed technology capacity to grid reinforcement costs, results are upscaled to Switzerland, and battery storage is compared with grid reinforcement using NPV over a 15-year deferral period.
Limitations
- Stated: the model assumes capacity additions and grid reinforcement occur all at once; in reality incremental additions across the transition could lead to higher cumulative reinforcement costs.
- Stated: reinforcement costs are average values that vary by project and local circumstances; the study excludes building retrofits (which can reduce HP peak load by 42–73%) and demand-side flexibility, so costs represent extreme cases without behind-the-meter flexibility.
- Stated/evident: the analysis focuses only on the low-voltage grid, and national upscaling assumes specific costs per urban setting from the DSO supply area are representative for the rest of Switzerland, which the paper calls a strong assumption; future work should include medium/high-voltage levels.
Model-written summary. Check it against the paper before relying on it.
Integrity signals
Registry
Cites
Statistics
Figures

Verification
Claims the paper makes
65 Own result · 19 No basis given · 12 Own interpretation · 5 Sources not found · 5 Not checked yet · 4 Own method · 3 Partly supported · 3 No full text of the sources · 1 Supported · 1 Not supported · accuracy not yet measured
Every source the paper cites for this claim was checked and supports it.
In the paper
“The use of HP and EV, on the other hand, increases the peak electricity demand [14].”
§ Spatial analysis of distribution grid capacity and costs to enable massive deployment of PV, electric mobility and electric heating > 1. Introduction
What the sources say
- Supportedcites [14] Rüdisüli, 2019, Impacts of an increased substitution of fossil energy carriers with electricity-based technologies on the swiss electricity system, Energies source
Section 3.1.2, “Maximum Power Demand,” reports additional peak hourly electricity demand from heat pumps and battery electric vehicles: 5.9 GWh/h in winter and 0.9 GWh/h in summer. Section 3.2.1, “Demand,” also describes the resulting additional demand peaks in the total electricity profile. (LLM, conf=0.94)
plaindirect- Asserted: passes — The authors put it forward as true.
- Checkable: passes — It can be checked against evidence.
- Load-bearing: passes — The paper’s conclusions depend on it.
- Based: passes — The paper gives a reason why it holds.
- Supported
The cited sources support only part of this claim — read each source’s verdict below.
In the paper
“However, once the hosting capacity is reached after continued technology additions, upgrading or even a complete rebuilding of the existing transformer stations (also known as 'secondary substations') and reinforcement of the lines will be needed [3,22,26,27].”
§ Spatial analysis of distribution grid capacity and costs to enable massive deployment of PV, electric mobility and electric heating > 1. Introduction
What the sources say
- Partly supportedcites [3] Pudjianto, 2013, Smart control for minimizing distribution network reinforcement cost due to electrification, Energy Policy sourceExperimental — accuracy not yet measured
Section 4 says that accommodating future loads can require distribution-network reinforcement, depending on equipment thermal ratings and voltage constraints. The network-design passage considers transformer and cable ratings, but our copy does not say that reaching a hosting-capacity threshold necessarily requires upgrading or completely rebuilding secondary substations; Section 5 also describes smart control as an alternative to reinforcement. No page numbers are available in our copy. (LLM, conf=0.84)
- Partly supportedcites [22] Ismael, 2019, State-of-the-art of hosting capacity in modern power systems with distributed generation, Renew Energy sourceExperimental — accuracy not yet measured
Section 5.5 (page unavailable) describes network reinforcement and feeder upgrades as ways to increase hosting capacity. It does not say that reaching hosting capacity necessarily requires line reinforcement or upgrading or rebuilding transformer stations; Section 5 also describes other enhancement techniques. (LLM, conf=0.86)
- Not matchedcites [26] IEA ETSAP, 2015
Couldn’t be matched to a paper in Crossref, so it can’t be checked.
- Could not verifycites [27] Nykamp, 2012, Integration of heat pumps in distribution grids: Economic motivation for grid control sourceExperimental — accuracy not yet measured
The available indexed passages are bibliographic metadata (one labeled Abstract, with no page number); they do not discuss hosting capacity or required grid upgrades. Searches for transformer-station rebuilding, line reinforcement, and capacity-related investments found no passage addressing the claim. (LLM, conf=0.75)
plaindirect- Asserted: passes — The authors put it forward as true.
- Checkable: passes — It can be checked against evidence.
- Load-bearing: passes — The paper’s conclusions depend on it.
- Based: passes — The paper gives a reason why it holds.
- Partly supported
A result the paper reports from its own data — it cites no other source for it, so there is none to check. The quote shows it is in the paper.
In the paper
“we find that PV leads to 18.5% and 13.7% more voltage violation issues compared to HP and EV respectively”
§ Spatial analysis of distribution grid capacity and costs to enable massive deployment of PV, electric mobility and electric heating > Abstract
plaindirect- Asserted: passes — The authors put it forward as true.
- Checkable: passes — It can be checked against evidence.
- Load-bearing: passes — The paper’s conclusions depend on it.
- Based: passes — The paper gives a reason why it holds.
A result the paper reports from its own data — it cites no other source for it, so there is none to check. The quote shows it is in the paper.
In the paper
“PV leads to 18.5% and 13.7% more voltage violation issues compared to HP and EV respectively, which on the other hand, cause slightly more line overloading, 0.5% and 2.5%, respectively.”
§ Spatial analysis of distribution grid capacity and costs to enable massive deployment of PV, electric mobility and electric heating > Abstract
plaindirect- Asserted: passes — The authors put it forward as true.
- Checkable: passes — It can be checked against evidence.
- Load-bearing: unclear — It is unclear whether the paper’s conclusions depend on it.
- Based: passes — The paper gives a reason why it holds.
The paper states this without a source or data behind it here, so there is nothing to check it against. The quote shows it is in the paper.
In the paper
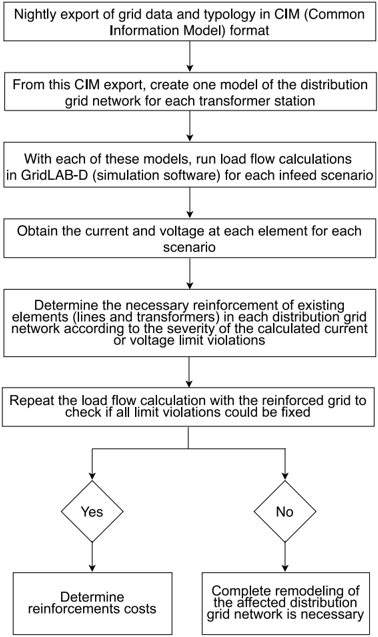
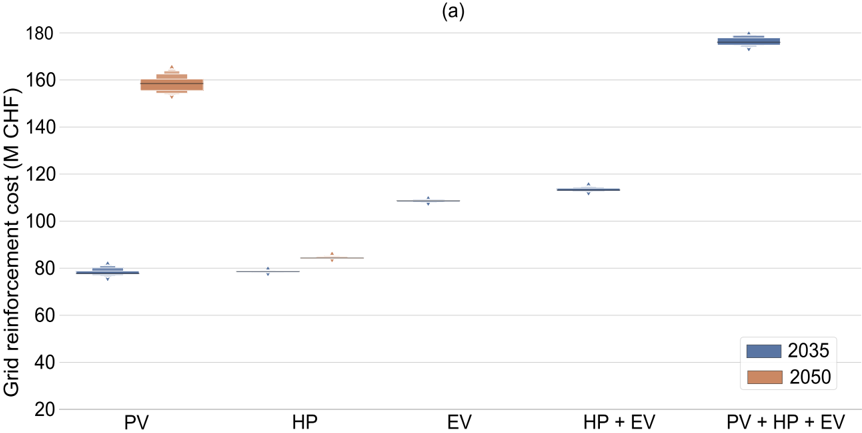
“These issues, overall, lead to a median grid reinforcement cost of 109M CHF (ranging between 108-109M CHF) for EV, as opposed to 79M CHF (ranging between 78-79M CHF) and 78M CHF (ranging between 76-82M CHF) for HP and PV, respectively, in 2035.”
§ Spatial analysis of distribution grid capacity and costs to enable massive deployment of PV, electric mobility and electric heating > 3.1. Least effort scenario
plain- Asserted: passes — The authors put it forward as true.
- Checkable: passes — It can be checked against evidence.
- Load-bearing: passes — The paper’s conclusions depend on it.
- Based: passes — The paper gives a reason why it holds.
A result the paper reports from its own data — it cites no other source for it, so there is none to check. The quote shows it is in the paper.
In the paper
“In 2050, the grid reinforcement needed to deploy 2'088 MW 𝑝 of PV is almost 5 times higher than to deploy 570 MW of HP.”
§ Spatial analysis of distribution grid capacity and costs to enable massive deployment of PV, electric mobility and electric heating > 3.3. Aggressive effort scenario
plaindirect- Asserted: passes — The authors put it forward as true.
- Checkable: passes — It can be checked against evidence.
- Load-bearing: passes — The paper’s conclusions depend on it.
- Based: passes — The paper gives a reason why it holds.
A result the paper reports from its own data — it cites no other source for it, so there is none to check. The quote shows it is in the paper.
In the paper
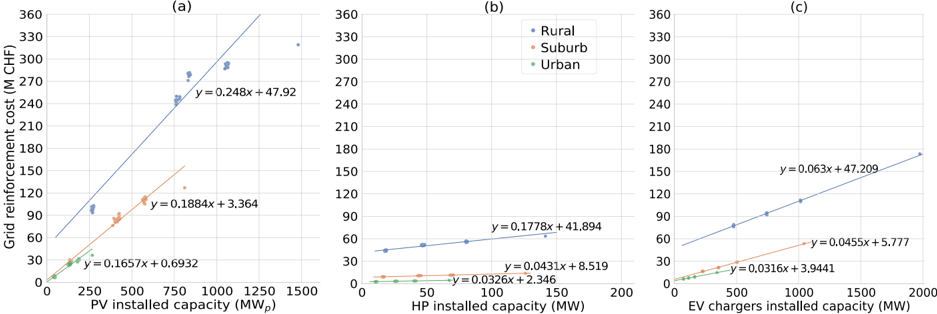
“The slope in Fig. 12(b) suggests that with each additional kW of HP capacity, the grid reinforcement cost increases by 178 CHF, 43 CHF and 33 CHF for rural, suburban and urban areas respectively and HP capacity explains the variance in grid reinforcement costs by R 2 of 94%, 95% and 97% across rural, suburban and urban areas respectively.”
§ Spatial analysis of distribution grid capacity and costs to enable massive deployment of PV, electric mobility and electric heating > 3.5. Regression analysis
hedgedcorrelational- Asserted: passes — The authors put it forward as true.
- Checkable: passes — It can be checked against evidence.
- Load-bearing: passes — The paper’s conclusions depend on it.
- Based: passes — The paper gives a reason why it holds.
A result the paper reports from its own data — it cites no other source for it, so there is none to check. The quote shows it is in the paper.
In the paper
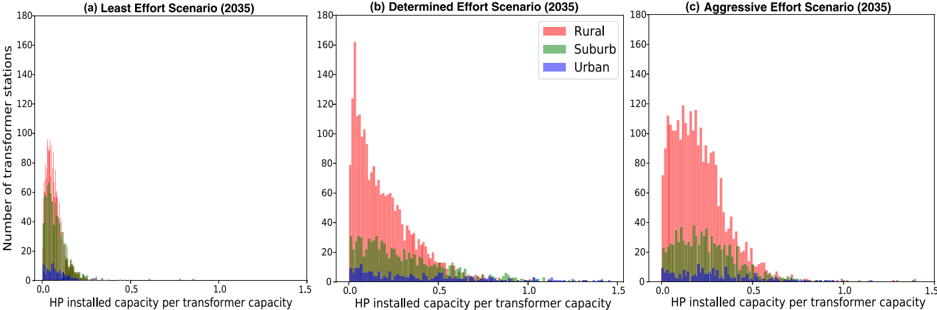
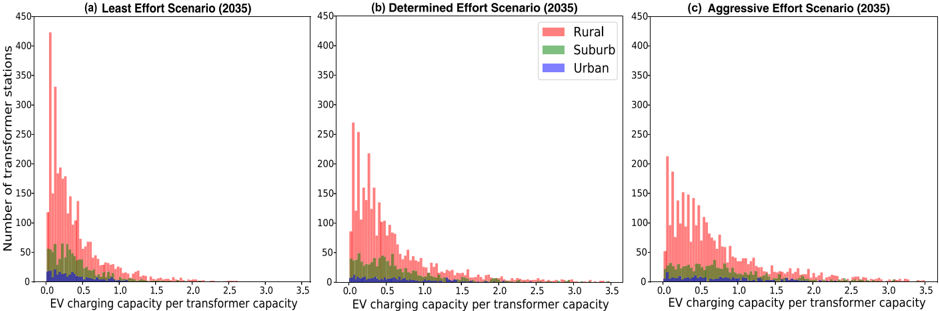
“Similar patterns are found for HP (Fig. 4) and EV (Fig. 5), however with the difference that the HP capacity per transformer capacity remains relatively low (nearly always below 0.5 across the scenarios).”
§ Spatial analysis of distribution grid capacity and costs to enable massive deployment of PV, electric mobility and electric heating > 2.5. Scenarios
plain- Asserted: passes — The authors put it forward as true.
- Checkable: passes — It can be checked against evidence.
- Load-bearing: unclear — It is unclear whether the paper’s conclusions depend on it.
- Based: passes — The paper gives a reason why it holds.
A result the paper reports from its own data — it cites no other source for it, so there is none to check. The quote shows it is in the paper.
In the paper
“The slope in Fig. 12(b) suggests that with each additional kW of HP capacity, the grid reinforcement cost increases by 178 CHF, 43 CHF and 33 CHF for rural, suburban and urban areas respectively and HP capacity explains the variance in grid reinforcement costs by R 2 of 94%, 95% and 97% across rural, suburban and urban areas respectively.”
§ Spatial analysis of distribution grid capacity and costs to enable massive deployment of PV, electric mobility and electric heating > 3.5. Regression analysis
hedgeddirect- Asserted: passes — The authors put it forward as true.
- Checkable: passes — It can be checked against evidence.
- Load-bearing: passes — The paper’s conclusions depend on it.
- Based: passes — The paper gives a reason why it holds.
A result the paper reports from its own data — it cites no other source for it, so there is none to check. The quote shows it is in the paper.
In the paper
“For 2035, we find that 5.8% of the house connections undergo voltage violation and around 222 km of lines are overloaded due to deployment of EV chargers (865 MW), compared to only 3.6% and 111 km for HP (100 MW) and 3.8% and 19 km for PV (299 MW 𝑝 ), respectively.”
§ Spatial analysis of distribution grid capacity and costs to enable massive deployment of PV, electric mobility and electric heating > 3.1. Least effort scenario
plaindirect- Asserted: passes — The authors put it forward as true.
- Checkable: passes — It can be checked against evidence.
- Load-bearing: passes — The paper’s conclusions depend on it.
- Based: passes — The paper gives a reason why it holds.
A result the paper reports from its own data — it cites no other source for it, so there is none to check. The quote shows it is in the paper.
In the paper
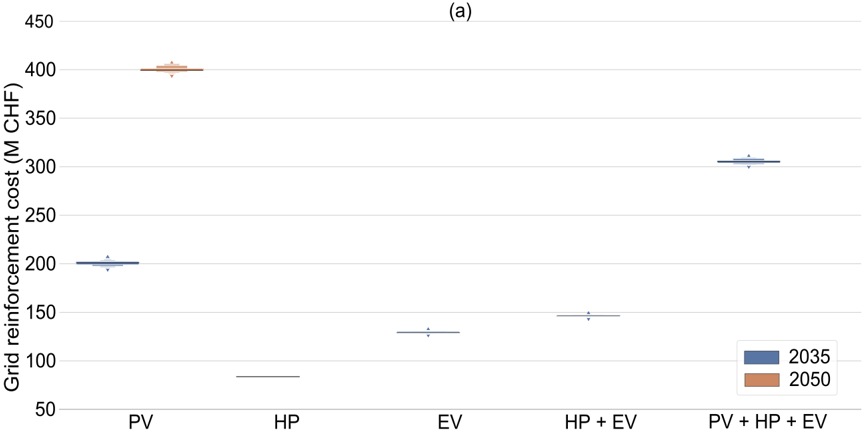
“The combined deployment of HP along with EV results in a median grid reinforcement cost of 147M CHF (ranging between 145-148M CHF) in 2035.”
§ Spatial analysis of distribution grid capacity and costs to enable massive deployment of PV, electric mobility and electric heating > 3.2. Determined effort scenario
plaindirect- Asserted: passes — The authors put it forward as true.
- Checkable: passes — It can be checked against evidence.
- Load-bearing: passes — The paper’s conclusions depend on it.
- Based: passes — The paper gives a reason why it holds.
A result the paper reports from its own data — it cites no other source for it, so there is none to check. The quote shows it is in the paper.
In the paper
“Our random allocation together with the characteristics of the supply area result in the following distributions for various technologies in 2035: 59%, 31% and 10% of the total PV capacity is installed in rural, suburban and urban areas respectively across all scenarios: 50%, 36% and 14% of the total HP capacity is installed in rural, suburban and urban areas respectively, whereas, 61%, 29.5% and”
§ Spatial analysis of distribution grid capacity and costs to enable massive deployment of PV, electric mobility and electric heating > 3.4. Grid reinforcement costs per urban setting
plain- Asserted: passes — The authors put it forward as true.
- Checkable: passes — It can be checked against evidence.
- Load-bearing: unclear — It is unclear whether the paper’s conclusions depend on it.
- Based: passes — The paper gives a reason why it holds.
A result the paper reports from its own data — it cites no other source for it, so there is none to check. The quote shows it is in the paper.
In the paper
“Our random allocation together with the characteristics of the supply area result in the following distributions for various technologies in 2035: 59%, 31% and 10% of the total PV capacity is installed in rural, suburban and urban areas respectively across all scenarios: 50%, 36% and 14% of the total HP capacity is installed in rural, suburban and urban areas respectively, whereas, 61%, 29.5% and”
§ Spatial analysis of distribution grid capacity and costs to enable massive deployment of PV, electric mobility and electric heating > 3.4. Grid reinforcement costs per urban setting
plain- Asserted: passes — The authors put it forward as true.
- Checkable: passes — It can be checked against evidence.
- Load-bearing: unclear — It is unclear whether the paper’s conclusions depend on it.
- Based: passes — The paper gives a reason why it holds.
A result the paper reports from its own data — it cites no other source for it, so there is none to check. The quote shows it is in the paper.
In the paper
“According to the regression analysis covering all urban settings and all scenarios, adding 1 kW 𝑝 of PV increases the grid reinforcement costs by 248 CHF, 188 CHF and 166 CHF for rural, suburban and urban areas respectively.”
§ Spatial analysis of distribution grid capacity and costs to enable massive deployment of PV, electric mobility and electric heating > 3.5. Regression analysis
plaindirect- Asserted: passes — The authors put it forward as true.
- Checkable: passes — It can be checked against evidence.
- Load-bearing: passes — The paper’s conclusions depend on it.
- Based: passes — The paper gives a reason why it holds.
A result the paper reports from its own data — it cites no other source for it, so there is none to check. The quote shows it is in the paper.
In the paper
“grid reinforcement costs markedly depend on the type of urban setting ranging between 51-213 CHF/kW 𝑝 , 46-1'385 CHF/kW and 34-143 CHF/kW for PV, HP and EV, respectively, with the higher limit corresponding to rural areas.”
§ Spatial analysis of distribution grid capacity and costs to enable massive deployment of PV, electric mobility and electric heating > Abstract
plaincorrelational- Asserted: passes — The authors put it forward as true.
- Checkable: passes — It can be checked against evidence.
- Load-bearing: passes — The paper’s conclusions depend on it.
- Based: passes — The paper gives a reason why it holds.
A result the paper reports from its own data — it cites no other source for it, so there is none to check. The quote shows it is in the paper.
In the paper
“PV leads to 18.5% and 13.7% more voltage violation issues compared to HP and EV respectively, which on the other hand, cause slightly more line overloading, 0.5% and 2.5%, respectively.”
§ Spatial analysis of distribution grid capacity and costs to enable massive deployment of PV, electric mobility and electric heating > Abstract
plaindirect- Asserted: passes — The authors put it forward as true.
- Checkable: passes — It can be checked against evidence.
- Load-bearing: unclear — It is unclear whether the paper’s conclusions depend on it.
- Based: passes — The paper gives a reason why it holds.
The paper states this without a source or data behind it here, so there is nothing to check it against. The quote shows it is in the paper.
In the paper
“For some cases, the specific grid reinforcement costs (CHF/kW) is exceptionally high (e.g., by one order of magnitude), for example if the line is a long overhead line and requires new piping for reinforcement.”
§ Spatial analysis of distribution grid capacity and costs to enable massive deployment of PV, electric mobility and electric heating > 3.6. Battery storage to defer distribution grid reinforcement costs
plainconditional- Asserted: passes — The authors put it forward as true.
- Checkable: passes — It can be checked against evidence.
- Load-bearing: passes — The paper’s conclusions depend on it.
- Based: passes — The paper gives a reason why it holds.
A result the paper reports from its own data — it cites no other source for it, so there is none to check. The quote shows it is in the paper.
In the paper
“The cost increases to 8.6B CHF to enable the deployment of 42 GW 𝑝 (heroic effort 2050) of PV in 2050.”
§ Spatial analysis of distribution grid capacity and costs to enable massive deployment of PV, electric mobility and electric heating > 3.7. National distribution grid reinforcement costs
plaindirect- Asserted: passes — The authors put it forward as true.
- Checkable: passes — It can be checked against evidence.
- Load-bearing: passes — The paper’s conclusions depend on it.
- Based: passes — The paper gives a reason why it holds.
A result the paper reports from its own data — it cites no other source for it, so there is none to check. The quote shows it is in the paper.
In the paper
“On the other hand, EV deployment results in 39% of transformer stations requiring an upgrade.”
§ Spatial analysis of distribution grid capacity and costs to enable massive deployment of PV, electric mobility and electric heating > 3.1. Least effort scenario
plaindirect- Asserted: passes — The authors put it forward as true.
- Checkable: passes — It can be checked against evidence.
- Load-bearing: passes — The paper’s conclusions depend on it.
- Based: passes — The paper gives a reason why it holds.
A result the paper reports from its own data — it cites no other source for it, so there is none to check. The quote shows it is in the paper.
In the paper
“These issues, overall, lead to a median grid reinforcement cost of 109M CHF (ranging between 108-109M CHF) for EV, as opposed to 79M CHF (ranging between 78-79M CHF) and 78M CHF (ranging between 76-82M CHF) for HP and PV, respectively, in 2035.”
§ Spatial analysis of distribution grid capacity and costs to enable massive deployment of PV, electric mobility and electric heating > 3.1. Least effort scenario
plain- Asserted: passes — The authors put it forward as true.
- Checkable: passes — It can be checked against evidence.
- Load-bearing: passes — The paper’s conclusions depend on it.
- Based: passes — The paper gives a reason why it holds.
The paper states this without a source or data behind it here, so there is nothing to check it against. The quote shows it is in the paper.
In the paper
“For example, for the determined and aggressive effort scenarios, batteries are more competitive than reinforcement only for 5% of the transformer stations with the highest specific grid reinforcement costs.”
§ Spatial analysis of distribution grid capacity and costs to enable massive deployment of PV, electric mobility and electric heating > 3.6. Battery storage to defer distribution grid reinforcement costs
plaincorrelational- Asserted: passes — The authors put it forward as true.
- Checkable: passes — It can be checked against evidence.
- Load-bearing: passes — The paper’s conclusions depend on it.
- Based: passes — The paper gives a reason why it holds.
A result the paper reports from its own data — it cites no other source for it, so there is none to check. The quote shows it is in the paper.
In the paper
“For 2035, we find that 5.8% of the house connections undergo voltage violation and around 222 km of lines are overloaded due to deployment of EV chargers (865 MW), compared to only 3.6% and 111 km for HP (100 MW) and 3.8% and 19 km for PV (299 MW 𝑝 ), respectively.”
§ Spatial analysis of distribution grid capacity and costs to enable massive deployment of PV, electric mobility and electric heating > 3.1. Least effort scenario
plaindirect- Asserted: passes — The authors put it forward as true.
- Checkable: passes — It can be checked against evidence.
- Load-bearing: passes — The paper’s conclusions depend on it.
- Based: passes — The paper gives a reason why it holds.
A result the paper reports from its own data — it cites no other source for it, so there is none to check. The quote shows it is in the paper.
In the paper
“For 2035, we find that 5.8% of the house connections undergo voltage violation and around 222 km of lines are overloaded due to deployment of EV chargers (865 MW), compared to only 3.6% and 111 km for HP (100 MW) and 3.8% and 19 km for PV (299 MW 𝑝 ), respectively.”
§ Spatial analysis of distribution grid capacity and costs to enable massive deployment of PV, electric mobility and electric heating > 3.1. Least effort scenario
plaindirect- Asserted: passes — The authors put it forward as true.
- Checkable: passes — It can be checked against evidence.
- Load-bearing: passes — The paper’s conclusions depend on it.
- Based: passes — The paper gives a reason why it holds.
A result the paper reports from its own data — it cites no other source for it, so there is none to check. The quote shows it is in the paper.
In the paper
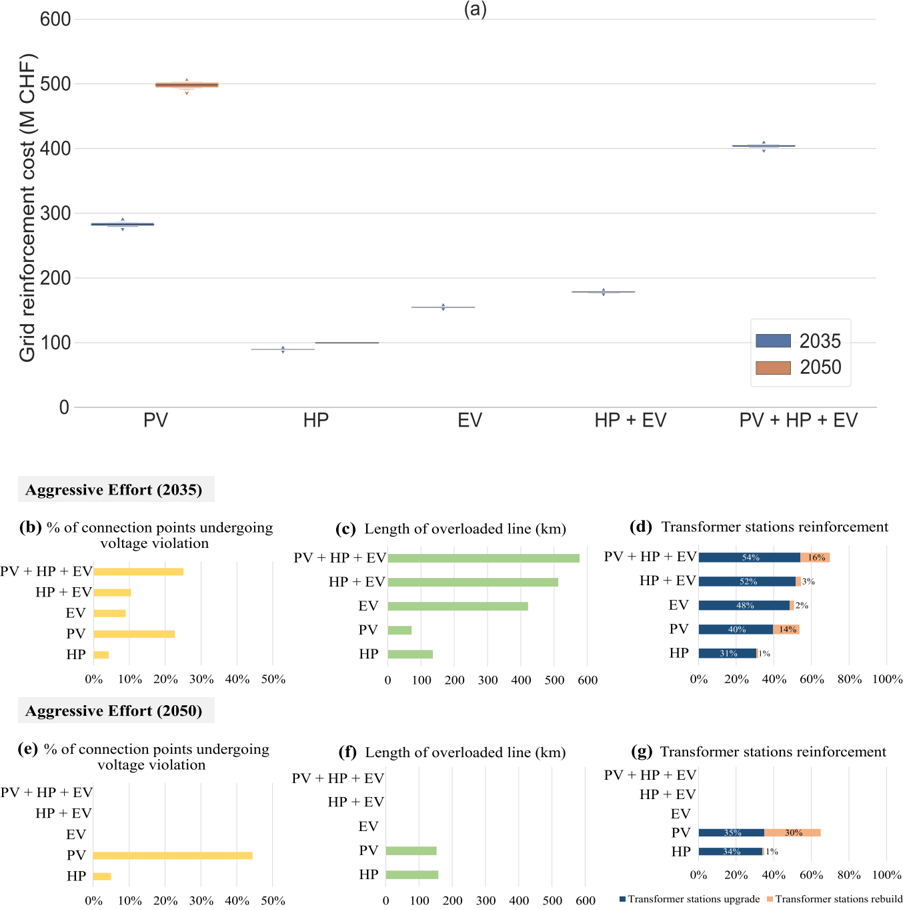
“However, the simultaneous deployment of PV along with HP and EV leads to a remarkable increase, with the median cost of around 405M CHF (ranging 399-407M CHF).”
§ Spatial analysis of distribution grid capacity and costs to enable massive deployment of PV, electric mobility and electric heating > 3.3. Aggressive effort scenario
plaindirect- Asserted: passes — The authors put it forward as true.
- Checkable: passes — It can be checked against evidence.
- Load-bearing: passes — The paper’s conclusions depend on it.
- Based: passes — The paper gives a reason why it holds.
The paper states this without a source or data behind it here, so there is nothing to check it against. The quote shows it is in the paper.
In the paper
“As a result, 14% of the transformer stations should be completely rebuilt to allow PV penetration, compared to only 2% and 1% for EV and HP respectively, thereby resulting in higher reinforcements costs for PV (see Figs. 9(b) to 9(g)).”
§ Spatial analysis of distribution grid capacity and costs to enable massive deployment of PV, electric mobility and electric heating > 3.3. Aggressive effort scenario
plaindirect- Asserted: passes — The authors put it forward as true.
- Checkable: passes — It can be checked against evidence.
- Load-bearing: passes — The paper’s conclusions depend on it.
- Based: passes — The paper gives a reason why it holds.
A result the paper reports from its own data — it cites no other source for it, so there is none to check. The quote shows it is in the paper.
In the paper
“For 2035, we find that 5.8% of the house connections undergo voltage violation and around 222 km of lines are overloaded due to deployment of EV chargers (865 MW), compared to only 3.6% and 111 km for HP (100 MW) and 3.8% and 19 km for PV (299 MW 𝑝 ), respectively.”
§ Spatial analysis of distribution grid capacity and costs to enable massive deployment of PV, electric mobility and electric heating > 3.1. Least effort scenario
plaindirect- Asserted: passes — The authors put it forward as true.
- Checkable: passes — It can be checked against evidence.
- Load-bearing: passes — The paper’s conclusions depend on it.
- Based: passes — The paper gives a reason why it holds.
A result the paper reports from its own data — it cites no other source for it, so there is none to check. The quote shows it is in the paper.
In the paper
“For the three regressions, the independent variable (installed capacity) is significant at 1% level (𝑝-value < 0.01), which means that grid reinforcement costs (dependent variable) can be explained very accurately by capacity additions of technologies (independent variable).”
§ Spatial analysis of distribution grid capacity and costs to enable massive deployment of PV, electric mobility and electric heating > 3.5. Regression analysis
plaincorrelational- Asserted: passes — The authors put it forward as true.
- Checkable: passes — It can be checked against evidence.
- Load-bearing: passes — The paper’s conclusions depend on it.
- Based: passes — The paper gives a reason why it holds.
A result the paper reports from its own data — it cites no other source for it, so there is none to check. The quote shows it is in the paper.
In the paper
“These issues, overall, lead to a median grid reinforcement cost of 109M CHF (ranging between 108-109M CHF) for EV, as opposed to 79M CHF (ranging between 78-79M CHF) and 78M CHF (ranging between 76-82M CHF) for HP and PV, respectively, in 2035.”
§ Spatial analysis of distribution grid capacity and costs to enable massive deployment of PV, electric mobility and electric heating > 3.1. Least effort scenario
plain- Asserted: passes — The authors put it forward as true.
- Checkable: passes — It can be checked against evidence.
- Load-bearing: passes — The paper’s conclusions depend on it.
- Based: passes — The paper gives a reason why it holds.
A result the paper reports from its own data — it cites no other source for it, so there is none to check. The quote shows it is in the paper.
In the paper
“PV deployment in 2050 results in approximately doubled grid reinforcement costs compared to 2035, with a median value of 159M CHF (ranging between 153-165M CHF).”
§ Spatial analysis of distribution grid capacity and costs to enable massive deployment of PV, electric mobility and electric heating > 3.1. Least effort scenario
plaindirect- Asserted: passes — The authors put it forward as true.
- Checkable: passes — It can be checked against evidence.
- Load-bearing: passes — The paper’s conclusions depend on it.
- Based: passes — The paper gives a reason why it holds.
The paper states this without a source or data behind it here, so there is nothing to check it against. The quote shows it is in the paper.
In the paper
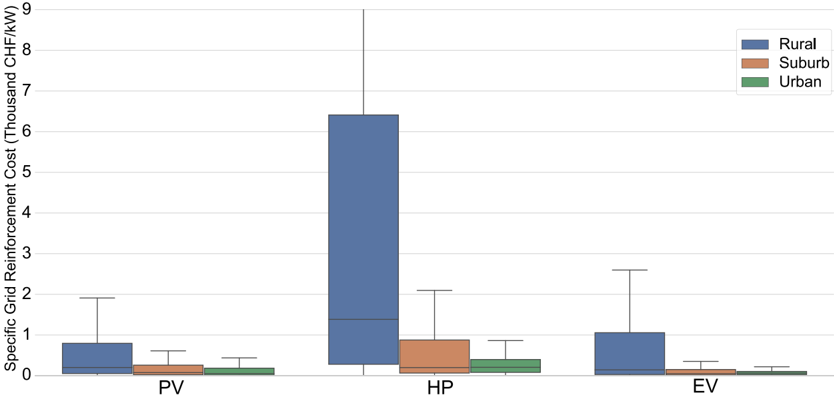
“For instance, the specific grid reinforcement costs for PV deployment in rural areas is around 170% and 290% higher than in suburban and urban areas, respectively.”
§ Spatial analysis of distribution grid capacity and costs to enable massive deployment of PV, electric mobility and electric heating > 3.4. Grid reinforcement costs per urban setting
plaincorrelational- Asserted: passes — The authors put it forward as true.
- Checkable: passes — It can be checked against evidence.
- Load-bearing: passes — The paper’s conclusions depend on it.
- Based: passes — The paper gives a reason why it holds.
A result the paper reports from its own data — it cites no other source for it, so there is none to check. The quote shows it is in the paper.
In the paper
“The reason is that PV causes voltage violation in 15% of the house connections compared to 7% and 4% in case of EV and HP respectively (see Figs. 8(b) to 8(g)).”
§ Spatial analysis of distribution grid capacity and costs to enable massive deployment of PV, electric mobility and electric heating > 3.2. Determined effort scenario
plaindirect- Asserted: passes — The authors put it forward as true.
- Checkable: passes — It can be checked against evidence.
- Load-bearing: passes — The paper’s conclusions depend on it.
- Based: passes — The paper gives a reason why it holds.
A result the paper reports from its own data — it cites no other source for it, so there is none to check. The quote shows it is in the paper.
In the paper
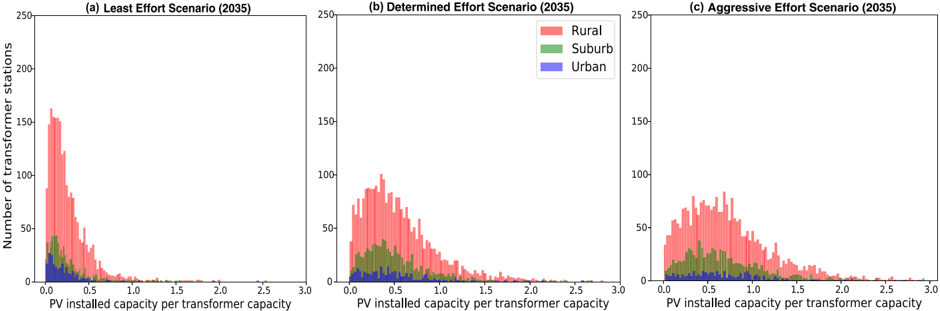
“While for the least effort scenario, the installed PV capacity only represents about half of the installed transformer capacity for most transformer stations, this ratio increases with the ambition level of the scenario (Fig. 3).”
§ Spatial analysis of distribution grid capacity and costs to enable massive deployment of PV, electric mobility and electric heating > 2.5. Scenarios
plaincorrelational- Asserted: passes — The authors put it forward as true.
- Checkable: passes — It can be checked against evidence.
- Load-bearing: unclear — It is unclear whether the paper’s conclusions depend on it.
- Based: passes — The paper gives a reason why it holds.
A result the paper reports from its own data — it cites no other source for it, so there is none to check. The quote shows it is in the paper.
In the paper
“Furthermore, the combined deployment of HP and EV results in grid reinforcement costs with a median value of 178M CHF (ranging between 177-179M CHF).”
§ Spatial analysis of distribution grid capacity and costs to enable massive deployment of PV, electric mobility and electric heating > 3.3. Aggressive effort scenario
plaindirect- Asserted: passes — The authors put it forward as true.
- Checkable: passes — It can be checked against evidence.
- Load-bearing: passes — The paper’s conclusions depend on it.
- Based: passes — The paper gives a reason why it holds.
A result the paper reports from its own data — it cites no other source for it, so there is none to check. The quote shows it is in the paper.
In the paper
“For 2035, we find that 5.8% of the house connections undergo voltage violation and around 222 km of lines are overloaded due to deployment of EV chargers (865 MW), compared to only 3.6% and 111 km for HP (100 MW) and 3.8% and 19 km for PV (299 MW 𝑝 ), respectively.”
§ Spatial analysis of distribution grid capacity and costs to enable massive deployment of PV, electric mobility and electric heating > 3.1. Least effort scenario
plaindirect- Asserted: passes — The authors put it forward as true.
- Checkable: passes — It can be checked against evidence.
- Load-bearing: passes — The paper’s conclusions depend on it.
- Based: passes — The paper gives a reason why it holds.
A result the paper reports from its own data — it cites no other source for it, so there is none to check. The quote shows it is in the paper.
In the paper
“For 2035, we find that 5.8% of the house connections undergo voltage violation and around 222 km of lines are overloaded due to deployment of EV chargers (865 MW), compared to only 3.6% and 111 km for HP (100 MW) and 3.8% and 19 km for PV (299 MW 𝑝 ), respectively.”
§ Spatial analysis of distribution grid capacity and costs to enable massive deployment of PV, electric mobility and electric heating > 3.1. Least effort scenario
plaindirect- Asserted: passes — The authors put it forward as true.
- Checkable: passes — It can be checked against evidence.
- Load-bearing: passes — The paper’s conclusions depend on it.
- Based: passes — The paper gives a reason why it holds.
The paper states this without a source or data behind it here, so there is nothing to check it against. The quote shows it is in the paper.
In the paper
“that batteries, even with current costs, have the potential to defer grid reinforcement for up to 15% of the transformer stations with the highest specific grid reinforcement costs.”
§ Spatial analysis of distribution grid capacity and costs to enable massive deployment of PV, electric mobility and electric heating > Abstract
hedgedconditional- Asserted: passes — The authors put it forward as true.
- Checkable: passes — It can be checked against evidence.
- Load-bearing: passes — The paper’s conclusions depend on it.
- Based: passes — The paper gives a reason why it holds.
A result the paper reports from its own data — it cites no other source for it, so there is none to check. The quote shows it is in the paper.
In the paper
“Although the deployment of HP and EV lead to a higher length of lines being overloaded compared to PV (422 km, 136 km and 72 km for EV, HP, and PV respectively), the cost related to PV-induced voltage violation issues becomes dominant.”
§ Spatial analysis of distribution grid capacity and costs to enable massive deployment of PV, electric mobility and electric heating > 3.3. Aggressive effort scenario
plaindirect- Asserted: passes — The authors put it forward as true.
- Checkable: passes — It can be checked against evidence.
- Load-bearing: passes — The paper’s conclusions depend on it.
- Based: passes — The paper gives a reason why it holds.
A result the paper reports from its own data — it cites no other source for it, so there is none to check. The quote shows it is in the paper.
In the paper
“Considering the current costs, batteries are found to be more cost effective than grid reinforcement for 15% of the transformer stations with the highest specific grid reinforcement costs in the least effort scenario.”
§ Spatial analysis of distribution grid capacity and costs to enable massive deployment of PV, electric mobility and electric heating > 3.6. Battery storage to defer distribution grid reinforcement costs
plain- Asserted: passes — The authors put it forward as true.
- Checkable: passes — It can be checked against evidence.
- Load-bearing: passes — The paper’s conclusions depend on it.
- Based: passes — The paper gives a reason why it holds.
A result the paper reports from its own data — it cites no other source for it, so there is none to check. The quote shows it is in the paper.
In the paper
“grid reinforcement costs markedly depend on the type of urban setting ranging between 51-213 CHF/kW 𝑝 , 46-1'385 CHF/kW and 34-143 CHF/kW for PV, HP and EV, respectively, with the higher limit corresponding to rural areas.”
§ Spatial analysis of distribution grid capacity and costs to enable massive deployment of PV, electric mobility and electric heating > Abstract
plaincorrelational- Asserted: passes — The authors put it forward as true.
- Checkable: passes — It can be checked against evidence.
- Load-bearing: passes — The paper’s conclusions depend on it.
- Based: passes — The paper gives a reason why it holds.
A result the paper reports from its own data — it cites no other source for it, so there is none to check. The quote shows it is in the paper.
In the paper
“The simultaneous deployment of PV along with HP and EV leads to high grid reinforcement cost with the median value of 305M CHF (ranging between 301-310M CHF).”
§ Spatial analysis of distribution grid capacity and costs to enable massive deployment of PV, electric mobility and electric heating > 3.2. Determined effort scenario
plaindirect- Asserted: passes — The authors put it forward as true.
- Checkable: passes — It can be checked against evidence.
- Load-bearing: passes — The paper’s conclusions depend on it.
- Based: passes — The paper gives a reason why it holds.
A result the paper reports from its own data — it cites no other source for it, so there is none to check. The quote shows it is in the paper.
In the paper
“The number of transformers for which the installed PV capacity exceeds the total transformer capacity (values > 1 on x-axis) becomes significant, especially in rural areas.”
§ Spatial analysis of distribution grid capacity and costs to enable massive deployment of PV, electric mobility and electric heating > 2.5. Scenarios
plaincorrelational- Asserted: passes — The authors put it forward as true.
- Checkable: passes — It can be checked against evidence.
- Load-bearing: passes — The paper’s conclusions depend on it.
- Based: passes — The paper gives a reason why it holds.
A result the paper reports from its own data — it cites no other source for it, so there is none to check. The quote shows it is in the paper.
In the paper
“For the aggressive effort scenario, for example, the installed PV capacity represents more than 50% of the total transformer capacity for most transformers.”
§ Spatial analysis of distribution grid capacity and costs to enable massive deployment of PV, electric mobility and electric heating > 2.5. Scenarios
plaincorrelational- Asserted: passes — The authors put it forward as true.
- Checkable: passes — It can be checked against evidence.
- Load-bearing: unclear — It is unclear whether the paper’s conclusions depend on it.
- Based: passes — The paper gives a reason why it holds.
The paper states this without a source or data behind it here, so there is nothing to check it against. The quote shows it is in the paper.
In the paper
“First, the specific grid reinforcement costs are remarkably higher for rural areas compared to suburban and urban areas.”
§ Spatial analysis of distribution grid capacity and costs to enable massive deployment of PV, electric mobility and electric heating > 3.4. Grid reinforcement costs per urban setting
plaincorrelational- Asserted: passes — The authors put it forward as true.
- Checkable: passes — It can be checked against evidence.
- Load-bearing: passes — The paper’s conclusions depend on it.
- Based: passes — The paper gives a reason why it holds.
A result the paper reports from its own data — it cites no other source for it, so there is none to check. The quote shows it is in the paper.
In the paper
“However, as PV penetration increases, it becomes cheaper to reinforce the grid than to install batteries.”
§ Spatial analysis of distribution grid capacity and costs to enable massive deployment of PV, electric mobility and electric heating > 3.6. Battery storage to defer distribution grid reinforcement costs
plaindirect- Asserted: passes — The authors put it forward as true.
- Checkable: passes — It can be checked against evidence.
- Load-bearing: passes — The paper’s conclusions depend on it.
- Based: passes — The paper gives a reason why it holds.
A result the paper reports from its own data — it cites no other source for it, so there is none to check. The quote shows it is in the paper.
In the paper
“we find that PV leads to 18.5% and 13.7% more voltage violation issues compared to HP and EV respectively”
§ Spatial analysis of distribution grid capacity and costs to enable massive deployment of PV, electric mobility and electric heating > Abstract
plaindirect- Asserted: passes — The authors put it forward as true.
- Checkable: passes — It can be checked against evidence.
- Load-bearing: passes — The paper’s conclusions depend on it.
- Based: passes — The paper gives a reason why it holds.
A result the paper reports from its own data — it cites no other source for it, so there is none to check. The quote shows it is in the paper.
In the paper
“Fig. 12(c) for EV shows a similar trend where EV charging explains the variance in grid reinforcement costs by 99% (R 2 ) across the three urban settings.”
§ Spatial analysis of distribution grid capacity and costs to enable massive deployment of PV, electric mobility and electric heating > 3.5. Regression analysis
plaincorrelational- Asserted: passes — The authors put it forward as true.
- Checkable: passes — It can be checked against evidence.
- Load-bearing: unclear — It is unclear whether the paper’s conclusions depend on it.
- Based: passes — The paper gives a reason why it holds.
A result the paper reports from its own data — it cites no other source for it, so there is none to check. The quote shows it is in the paper.
In the paper
“Our random allocation together with the characteristics of the supply area result in the following distributions for various technologies in 2035: 59%, 31% and 10% of the total PV capacity is installed in rural, suburban and urban areas respectively across all scenarios: 50%, 36% and 14% of the total HP capacity is installed in rural, suburban and urban areas respectively, whereas, 61%, 29.5% and”
§ Spatial analysis of distribution grid capacity and costs to enable massive deployment of PV, electric mobility and electric heating > 3.4. Grid reinforcement costs per urban setting
plain- Asserted: passes — The authors put it forward as true.
- Checkable: passes — It can be checked against evidence.
- Load-bearing: unclear — It is unclear whether the paper’s conclusions depend on it.
- Based: passes — The paper gives a reason why it holds.
A result the paper reports from its own data — it cites no other source for it, so there is none to check. The quote shows it is in the paper.
In the paper
“In 2050, the expected PV capacity in the least effort scenario is 597 MW 𝑝 (100% higher than in 2035), causing a voltage violation in 11% of the house connections compared to only around 4% in case of HP (with a installed capacity of 230 MW in 2050).”
§ Spatial analysis of distribution grid capacity and costs to enable massive deployment of PV, electric mobility and electric heating > 3.1. Least effort scenario
plaindirect- Asserted: passes — The authors put it forward as true.
- Checkable: passes — It can be checked against evidence.
- Load-bearing: passes — The paper’s conclusions depend on it.
- Based: passes — The paper gives a reason why it holds.
The paper states this without a source or data behind it here, so there is nothing to check it against. The quote shows it is in the paper.
In the paper
“For instance, HP results show that only 2% of the house connections in the urban areas undergo voltage violation compared to 12% in the rural areas.”
§ Spatial analysis of distribution grid capacity and costs to enable massive deployment of PV, electric mobility and electric heating > 3.4. Grid reinforcement costs per urban setting
plaincorrelational- Asserted: passes — The authors put it forward as true.
- Checkable: passes — It can be checked against evidence.
- Load-bearing: passes — The paper’s conclusions depend on it.
- Based: passes — The paper gives a reason why it holds.
A result the paper reports from its own data — it cites no other source for it, so there is none to check. The quote shows it is in the paper.
In the paper
“In 2050, the total cost amounts to 11B CHF when considering 42.2 GW 𝑝 , 7.8 GW and 35.4 GW for PV, HP and EV charging respectively.”
§ Spatial analysis of distribution grid capacity and costs to enable massive deployment of PV, electric mobility and electric heating > 5. Conclusions
plaindirect- Asserted: passes — The authors put it forward as true.
- Checkable: passes — It can be checked against evidence.
- Load-bearing: passes — The paper’s conclusions depend on it.
- Based: passes — The paper gives a reason why it holds.
A result the paper reports from its own data — it cites no other source for it, so there is none to check. The quote shows it is in the paper.
In the paper
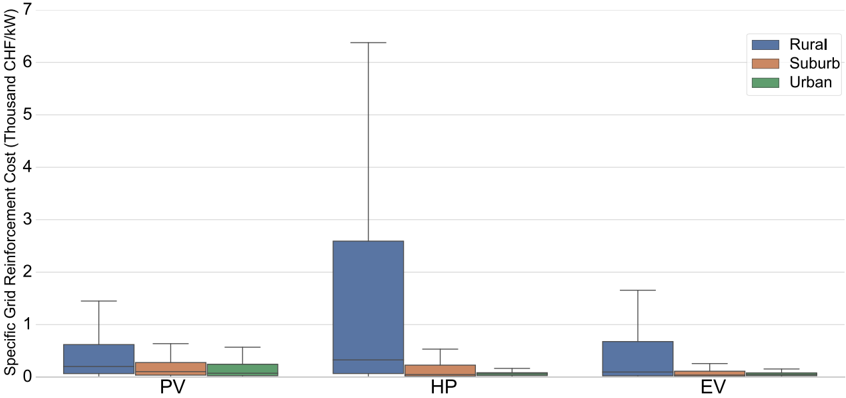
“We find that specific grid reinforcement costs are remarkably higher in rural areas compared to suburban and urban areas, in particular, by 150%, 410% and 90% for PV, HP and EV respectively, in an aggressive effort scenario.”
§ Spatial analysis of distribution grid capacity and costs to enable massive deployment of PV, electric mobility and electric heating > 5. Conclusions
plaincorrelational- Asserted: passes — The authors put it forward as true.
- Checkable: passes — It can be checked against evidence.
- Load-bearing: passes — The paper’s conclusions depend on it.
- Based: passes — The paper gives a reason why it holds.
A result the paper reports from its own data — it cites no other source for it, so there is none to check. The quote shows it is in the paper.
In the paper
“Based on a linear regression model, we explain grid reinforcement costs as function of the installed nominal capacity of various technologies (R2 > 94%).”
§ Spatial analysis of distribution grid capacity and costs to enable massive deployment of PV, electric mobility and electric heating > 5. Conclusions
plaincorrelational- Asserted: passes — The authors put it forward as true.
- Checkable: passes — It can be checked against evidence.
- Load-bearing: passes — The paper’s conclusions depend on it.
- Based: passes — The paper gives a reason why it holds.
A result the paper reports from its own data — it cites no other source for it, so there is none to check. The quote shows it is in the paper.
In the paper
“Overall, we calculate that the total distribution grid reinforcement cost for Switzerland in 2035 amounts to 5.4B CHF for a heroic effort scenario corresponding to a PV nominal capacity of 21.1 GW 𝑝 , a HP nominal capacity of 6.4 GW (corresponding to the replacement of all the fossil-based heating) and 11.7 GW of EV charging.”
§ Spatial analysis of distribution grid capacity and costs to enable massive deployment of PV, electric mobility and electric heating > 5. Conclusions
plaindirect- Asserted: passes — The authors put it forward as true.
- Checkable: passes — It can be checked against evidence.
- Load-bearing: passes — The paper’s conclusions depend on it.
- Based: passes — The paper gives a reason why it holds.
A result the paper reports from its own data — it cites no other source for it, so there is none to check. The quote shows it is in the paper.
In the paper
“Based on our result, we further confirm that the specific grid reinforcement cost is much lower for ambitious scenarios (determined and aggressive effort) than for low-ambition scenario (least effort), specifically in case of HP deployment (see Section 3.4).”
§ Spatial analysis of distribution grid capacity and costs to enable massive deployment of PV, electric mobility and electric heating > 4. Discussion
boosteddirect- Asserted: passes — The authors put it forward as true.
- Checkable: passes — It can be checked against evidence.
- Load-bearing: passes — The paper’s conclusions depend on it.
- Based: passes — The paper gives a reason why it holds.
A result the paper reports from its own data — it cites no other source for it, so there is none to check. The quote shows it is in the paper.
In the paper
“Using 6.4 GW of HP (in electrical terms) to fully replace all the fossil-based heating systems in the Swiss residential sector (determined effort 2035), would imply a grid reinforcement cost of 0.5B CHF.”
§ Spatial analysis of distribution grid capacity and costs to enable massive deployment of PV, electric mobility and electric heating > 3.7. National distribution grid reinforcement costs
hedgeddirect- Asserted: passes — The authors put it forward as true.
- Checkable: passes — It can be checked against evidence.
- Load-bearing: passes — The paper’s conclusions depend on it.
- Based: passes — The paper gives a reason why it holds.
A result the paper reports from its own data — it cites no other source for it, so there is none to check. The quote shows it is in the paper.
In the paper
“Our results show that even with the current costs, batteries have the potential to defer grid reinforcement in up to 15% of the transformer stations with the highest specific grid reinforcement costs (CHF/kW) across different PV scenarios.”
§ Spatial analysis of distribution grid capacity and costs to enable massive deployment of PV, electric mobility and electric heating > 4. Discussion
hedgedconditional- Asserted: passes — The authors put it forward as true.
- Checkable: passes — It can be checked against evidence.
- Load-bearing: passes — The paper’s conclusions depend on it.
- Based: passes — The paper gives a reason why it holds.
The paper states this without a source or data behind it here, so there is nothing to check it against. The quote shows it is in the paper.
In the paper
“With 3.8M households in Switzerland (assuming the same number as today), the cost of reinforcement would translate to around 1'440 CHF and 2'900 CHF per household in 2035 and 2050, respectively (1 Swiss Franc = 1 CHF ≈ 1 USD).”
§ Spatial analysis of distribution grid capacity and costs to enable massive deployment of PV, electric mobility and electric heating > 5. Conclusions
hedgeddirect- Asserted: passes — The authors put it forward as true.
- Checkable: passes — It can be checked against evidence.
- Load-bearing: passes — The paper’s conclusions depend on it.
- Based: passes — The paper gives a reason why it holds.
- The authors state this as an assumption: The number of households in Switzerland is 3.8M (assuming the same number as today).
A result the paper reports from its own data — it cites no other source for it, so there is none to check. The quote shows it is in the paper.
In the paper
“We find that specific grid reinforcement costs are remarkably higher in rural areas compared to suburban and urban areas, in particular, by 150%, 410% and 90% for PV, HP and EV respectively, in an aggressive effort scenario.”
§ Spatial analysis of distribution grid capacity and costs to enable massive deployment of PV, electric mobility and electric heating > 5. Conclusions
boostedcorrelational- Asserted: passes — The authors put it forward as true.
- Checkable: passes — It can be checked against evidence.
- Load-bearing: passes — The paper’s conclusions depend on it.
- Based: passes — The paper gives a reason why it holds.
A result the paper reports from its own data — it cites no other source for it, so there is none to check. The quote shows it is in the paper.
In the paper
“We find that specific grid reinforcement costs are remarkably higher in rural areas compared to suburban and urban areas, in particular, by 150%, 410% and 90% for PV, HP and EV respectively, in an aggressive effort scenario.”
§ Spatial analysis of distribution grid capacity and costs to enable massive deployment of PV, electric mobility and electric heating > 5. Conclusions
plaincorrelational- Asserted: passes — The authors put it forward as true.
- Checkable: passes — It can be checked against evidence.
- Load-bearing: passes — The paper’s conclusions depend on it.
- Based: passes — The paper gives a reason why it holds.
The paper states this without a source or data behind it here, so there is nothing to check it against. The quote shows it is in the paper.
In the paper
“While the above-mentioned studies quantify the grid impacts associated with the penetration of PV, HP and EV, they did not calculate the grid reinforcement costs needed to enable their penetration.”
§ Spatial analysis of distribution grid capacity and costs to enable massive deployment of PV, electric mobility and electric heating > 1.1. Literature review and research objectives
plain- Asserted: passes — The authors put it forward as true.
- Checkable: passes — It can be checked against evidence.
- Load-bearing: passes — The paper’s conclusions depend on it.
- Based: passes — The paper gives a reason why it holds.
What the paper did — it cites no source for this, so there is none to check. The quote shows it is in the paper.
In the paper
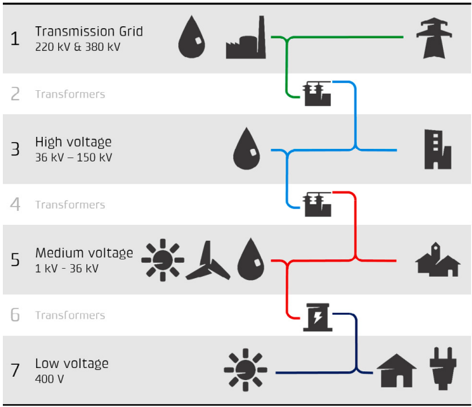
“We use a real distribution grid which is owned and operated by the utility, BKW 4 , in parts of the canton of Bern, Solothurn and Jura in Switzerland, referred to as supply area in this study.”
§ Spatial analysis of distribution grid capacity and costs to enable massive deployment of PV, electric mobility and electric heating > 2.1. Current structure of electricity grid in Switzerland
plain- Asserted: passes — The authors put it forward as true.
- Checkable: passes — It can be checked against evidence.
- Load-bearing: passes — The paper’s conclusions depend on it.
- Based: passes — The paper gives a reason why it holds.
A conclusion the paper draws from its own results — it cites no other source for it, so there is none to check. The quote shows it is in the paper.
In the paper
“The total distribution grid reinforcement costs can amount up to 11 billion CHF until 2050 i.e. 2'900 CHF per household in Switzerland.”
§ Spatial analysis of distribution grid capacity and costs to enable massive deployment of PV, electric mobility and electric heating > Abstract
plain- Asserted: passes — The authors put it forward as true.
- Checkable: passes — It can be checked against evidence.
- Load-bearing: passes — The paper’s conclusions depend on it.
- Based: passes — The paper gives a reason why it holds.
- Rests on an assumption: The supply area's distribution grid and technology deployment patterns are representative of Switzerland for scaling up national-level results.
The paper states this without a source or data behind it here, so there is nothing to check it against. The quote shows it is in the paper.
In the paper
“Previous studies, therefore, typically focused on integration of the low carbon technologies, either on the supply or the demand side.”
§ Spatial analysis of distribution grid capacity and costs to enable massive deployment of PV, electric mobility and electric heating > 1.1. Literature review and research objectives
plain- Asserted: passes — The authors put it forward as true.
- Checkable: passes — It can be checked against evidence.
- Load-bearing: passes — The paper’s conclusions depend on it.
- Based: passes — The paper gives a reason why it holds.
A conclusion the paper draws from its own results — it cites no other source for it, so there is none to check. The quote shows it is in the paper.
In the paper
“Beyond that, grid reinforcement becomes a more attractive flexibility option.”
§ Spatial analysis of distribution grid capacity and costs to enable massive deployment of PV, electric mobility and electric heating > 3.6. Battery storage to defer distribution grid reinforcement costs
plaindirect- Asserted: passes — The authors put it forward as true.
- Checkable: passes — It can be checked against evidence.
- Load-bearing: passes — The paper’s conclusions depend on it.
- Based: passes — The paper gives a reason why it holds.
A conclusion the paper draws from its own results — it cites no other source for it, so there is none to check. The quote shows it is in the paper.
In the paper
“The total distribution grid reinforcement costs can amount up to 11 billion CHF until 2050 i.e. 2'900 CHF per household in Switzerland.”
§ Spatial analysis of distribution grid capacity and costs to enable massive deployment of PV, electric mobility and electric heating > Abstract
plain- Asserted: passes — The authors put it forward as true.
- Checkable: passes — It can be checked against evidence.
- Load-bearing: passes — The paper’s conclusions depend on it.
- Based: passes — The paper gives a reason why it holds.
- Rests on an assumption: The supply area's distribution grid and technology deployment patterns are representative of Switzerland for scaling up national-level results.
A conclusion the paper draws from its own results — it cites no other source for it, so there is none to check. The quote shows it is in the paper.
In the paper
“However, once the hosting capacity of the medium/high voltage grid has been reached, the costs for grid reinforcement projects are much higher than for the low voltage grid.”
§ Spatial analysis of distribution grid capacity and costs to enable massive deployment of PV, electric mobility and electric heating > 4. Discussion
plaindirect- Asserted: passes — The authors put it forward as true.
- Checkable: passes — It can be checked against evidence.
- Load-bearing: passes — The paper’s conclusions depend on it.
- Based: unclear — It is unclear why the paper says it holds.
A conclusion the paper draws from its own results — it cites no other source for it, so there is none to check. The quote shows it is in the paper.
In the paper
“Based on our results, we conclude that lithium-ion batteries are already attractive to defer grid reinforcement for up to 15% of the transformer stations with the highest specific grid reinforcement costs.”
§ Spatial analysis of distribution grid capacity and costs to enable massive deployment of PV, electric mobility and electric heating > 5. Conclusions
plaindirect- Asserted: passes — The authors put it forward as true.
- Checkable: passes — It can be checked against evidence.
- Load-bearing: passes — The paper’s conclusions depend on it.
- Based: passes — The paper gives a reason why it holds.
A conclusion the paper draws from its own results — it cites no other source for it, so there is none to check. The quote shows it is in the paper.
In the paper
“This is an important policy conclusion which suggests that replacement of all fossil-based heating systems with HP (determined effort) is more cost-effective for the grid than continuing with the current pace of HP deployment (least effort).”
§ Spatial analysis of distribution grid capacity and costs to enable massive deployment of PV, electric mobility and electric heating > 4. Discussion
hedgeddirect- Asserted: passes — The authors put it forward as true.
- Checkable: passes — It can be checked against evidence.
- Load-bearing: passes — The paper’s conclusions depend on it.
- Based: passes — The paper gives a reason why it holds.
A conclusion the paper draws from its own results — it cites no other source for it, so there is none to check. The quote shows it is in the paper.
In the paper
“Therefore, with high penetration levels of PV, HP or EV, the grid reinforcement costs for medium/high voltage grid may exceed the cost established for the low voltage grid in this study.”
§ Spatial analysis of distribution grid capacity and costs to enable massive deployment of PV, electric mobility and electric heating > 4. Discussion
hedgedconditional- Asserted: passes — The authors put it forward as true.
- Checkable: passes — It can be checked against evidence.
- Load-bearing: passes — The paper’s conclusions depend on it.
- Based: passes — The paper gives a reason why it holds.
A conclusion the paper draws from its own results — it cites no other source for it, so there is none to check. The quote shows it is in the paper.
In the paper
“This means that it could accommodate more PV, HP or EV before it would need to be reinforced.”
§ Spatial analysis of distribution grid capacity and costs to enable massive deployment of PV, electric mobility and electric heating > 4. Discussion
hedgedconditional- Asserted: passes — The authors put it forward as true.
- Checkable: passes — It can be checked against evidence.
- Load-bearing: passes — The paper’s conclusions depend on it.
- Based: passes — The paper gives a reason why it holds.
- It may state two separate claims as one. 43
- Probably not a substantial claim. 12
- The quote only partly states this claim. 1
At least one cited source doesn’t support this claim or points to a different paper, and none confirmed it — see the verdicts below.
In the paper
“The redundancy is typically higher in the medium voltage/high voltage grid in Switzerland, and there are more reserves (higher hosting capacity) compared to the low voltage grid [83].”
§ Spatial analysis of distribution grid capacity and costs to enable massive deployment of PV, electric mobility and electric heating > 4. Discussion
What the sources say
- Disputedcites [83] Ballanti, 2016, On the integrated PV hosting capacity of MV and LV distribution networks, 2015 IEEE PES Innovative Smart Grid Technologies Latin America, ISGT LATAM 2015 sourceExperimental — accuracy not yet measured
In “MV-LV Integrated Hosting Capacity” (page unavailable), the paper reports that its UK case study accommodated almost nine times more PV generation when installations were predominantly connected to LV rather than MV—the opposite of the claimed hosting-capacity comparison. It studies a network in England, not Switzerland, and does not assess grid redundancy. (LLM, conf=0.87)
Checked by a reasoning model — may be wrong.
plaincorrelational- Asserted: passes — The authors put it forward as true.
- Checkable: passes — It can be checked against evidence.
- Load-bearing: unclear — It is unclear whether the paper’s conclusions depend on it.
- Based: passes — The paper gives a reason why it holds.
It may state two separate claims as one.
- Disputed
The cited sources support only part of this claim — read each source’s verdict below.
In the paper
“It is also important to note that other measures such as retrofitting of buildings can reduce the peak load of HP by 42%-73% [56,81] while local demand side flexibility can be used to decrease the grid impacts of all technologies [82].”
§ Spatial analysis of distribution grid capacity and costs to enable massive deployment of PV, electric mobility and electric heating > 4. Discussion
What the sources say
- Not checked — no full text of the sourcecites [56] Streicher, 2020, Cost-effectiveness of large-scale deep energy retrofit packages for residential buildings under different economic assessment approaches, Energy Build source
- Partly supportedcites [81] Rinaldi, 2021, Decarbonising heat with optimal PV and storage investments: A detailed sector coupling modelling framework with flexible heat pump operation, Appl Energy sourceExperimental — accuracy not yet measured
Section 2.3 (Retrofitting; page unavailable) gives the 42%–73% figure as savings in useful energy demand from building retrofitting, not a reduction in heat-pump peak load. Section 4.2 finds that retrofitting can reduce storage investments, but does not establish the claimed peak-load reduction. The separate statement about local demand-side flexibility is cited to [82], not this source. (LLM, conf=0.88)
- Not matchedcites [82] IEA, 2020
Couldn’t be matched to a paper in Crossref, so it can’t be checked.
plaindirect- Asserted: passes — The authors put it forward as true.
- Checkable: passes — It can be checked against evidence.
- Load-bearing: unclear — It is unclear whether the paper’s conclusions depend on it.
- Based: passes — The paper gives a reason why it holds.
It may state two separate claims as one.
The cited sources support only part of this claim — read each source’s verdict below.
In the paper
“The new regulatory context in the European Union and Switzerland states that the ownership and operation of energy storage is restricted for DSO, however, they could use tenders to engage market actors (like prosumers and aggregators) who own energy storage to provide grid services [79].”
§ Spatial analysis of distribution grid capacity and costs to enable massive deployment of PV, electric mobility and electric heating > 4. Discussion
What the sources say
- Partly supportedcites [79] Proka, 2020, When top-down meets bottom-up: Is there a collaborative business model for local energy storage?, Energy Res Soc Sci sourceExperimental — accuracy not yet measured
Split into 2 atoms — 0 confirmed, 2 partially supported, 0 disputed, 0 misattributed, 0 unverifiable. Expand the claim to see per-atom verdicts.
hedged- Asserted: passes — The authors put it forward as true.
- Checkable: passes — It can be checked against evidence.
- Load-bearing: unclear — It is unclear whether the paper’s conclusions depend on it.
- Based: passes — The paper gives a reason why it holds.
It may state two separate claims as one.
- Partly supported
A result the paper reports from its own data — it cites no other source for it, so there is none to check. The quote shows it is in the paper.
In the paper
“Our results show that for some transformer stations, even very limited capacity addition can undermine the existing distribution grid capacity, in terms of peak load or voltage limits, which would then need to be replaced/reinforced.”
§ Spatial analysis of distribution grid capacity and costs to enable massive deployment of PV, electric mobility and electric heating > 3.6. Battery storage to defer distribution grid reinforcement costs
plaindirect- Asserted: passes — The authors put it forward as true.
- Checkable: passes — It can be checked against evidence.
- Load-bearing: passes — The paper’s conclusions depend on it.
- Based: passes — The paper gives a reason why it holds.
It may state two separate claims as one.
A result the paper reports from its own data — it cites no other source for it, so there is none to check. The quote shows it is in the paper.
In the paper
“To enable this PV deployment, 8% of transformer stations should be rebuilt, which is a markedly higher percentage than for HP (only 1%).”
§ Spatial analysis of distribution grid capacity and costs to enable massive deployment of PV, electric mobility and electric heating > 3.1. Least effort scenario
plaindirect- Asserted: passes — The authors put it forward as true.
- Checkable: passes — It can be checked against evidence.
- Load-bearing: passes — The paper’s conclusions depend on it.
- Based: passes — The paper gives a reason why it holds.
It may state two separate claims as one.
The paper states this without a source or data behind it here, so there is nothing to check it against. The quote shows it is in the paper.
In the paper
“Overall, 10% of the transformer stations for PV need to be rebuilt, compared to only 1% and 2% for HP and EV respectively, thereby leading to higher costs.”
§ Spatial analysis of distribution grid capacity and costs to enable massive deployment of PV, electric mobility and electric heating > 3.2. Determined effort scenario
plain- Asserted: passes — The authors put it forward as true.
- Checkable: passes — It can be checked against evidence.
- Load-bearing: passes — The paper’s conclusions depend on it.
- Based: passes — The paper gives a reason why it holds.
It may state two separate claims as one.
A result the paper reports from its own data — it cites no other source for it, so there is none to check. The quote shows it is in the paper.
In the paper
“In rural areas, the median (IQR values reported in brackets) specific grid reinforcement cost for EV is 143 (29 to 1'058) CHF/kW compared to 1'385 (280 to 6'413) CHF/kW and 201 (52 to 796) CHF/kW 𝑝 for HP and PV respectively.”
§ Spatial analysis of distribution grid capacity and costs to enable massive deployment of PV, electric mobility and electric heating > 3.4. Grid reinforcement costs per urban setting
plain- Asserted: passes — The authors put it forward as true.
- Checkable: passes — It can be checked against evidence.
- Load-bearing: passes — The paper’s conclusions depend on it.
- Based: passes — The paper gives a reason why it holds.
It may state two separate claims as one.
The paper states this without a source or data behind it here, so there is nothing to check it against. The quote shows it is in the paper.
In the paper
“First, in 2035, similar as in determined effort, PV deployment leads to relatively higher grid reinforcement costs with a median value of 282M CHF (ranging between 278-288M CHF) compared to a median value of 155M CHF (ranging between 154-156M CHF) and 90M CHF (ranging between 88-90M CHF) for EV and HP respectively.”
§ Spatial analysis of distribution grid capacity and costs to enable massive deployment of PV, electric mobility and electric heating > 3.3. Aggressive effort scenario
plaindirect- Asserted: passes — The authors put it forward as true.
- Checkable: passes — It can be checked against evidence.
- Load-bearing: passes — The paper’s conclusions depend on it.
- Based: passes — The paper gives a reason why it holds.
It may state two separate claims as one.
A result the paper reports from its own data — it cites no other source for it, so there is none to check. The quote shows it is in the paper.
In the paper
“For suburban areas, the median (IQR) grid cost is 102 (36 to 276) CHF/kW, 46 (17 to 229) CHF/kW and 37 (14 to 111) CHF/kW for PV, HP and EV respectively.”
§ Spatial analysis of distribution grid capacity and costs to enable massive deployment of PV, electric mobility and electric heating > 3.4. Grid reinforcement costs per urban setting
plain- Asserted: passes — The authors put it forward as true.
- Checkable: passes — It can be checked against evidence.
- Load-bearing: passes — The paper’s conclusions depend on it.
- Based: passes — The paper gives a reason why it holds.
It may state two separate claims as one.
A result the paper reports from its own data — it cites no other source for it, so there is none to check. The quote shows it is in the paper.
In the paper
“For suburban areas, the median (IQR) specific grid reinforcement costs reduces substantially to 49 (16 to 150) CHF/kW, 199 (64 to 878) CHF/kW and 76 (24 to 259) CHF/kW 𝑝 for EV, HP and PV respectively.”
§ Spatial analysis of distribution grid capacity and costs to enable massive deployment of PV, electric mobility and electric heating > 3.4. Grid reinforcement costs per urban setting
plain- Asserted: passes — The authors put it forward as true.
- Checkable: passes — It can be checked against evidence.
- Load-bearing: passes — The paper’s conclusions depend on it.
- Based: passes — The paper gives a reason why it holds.
It may state two separate claims as one.
A result the paper reports from its own data — it cites no other source for it, so there is none to check. The quote shows it is in the paper.
In the paper
“We obtain a coefficient of determination, R 2 of 95%, 98% and 97% for PV in rural, suburban and urban areas, which implies a good fit (see Fig. 12(a).”
§ Spatial analysis of distribution grid capacity and costs to enable massive deployment of PV, electric mobility and electric heating > 3.5. Regression analysis
plaincorrelational- Asserted: passes — The authors put it forward as true.
- Checkable: passes — It can be checked against evidence.
- Load-bearing: unclear — It is unclear whether the paper’s conclusions depend on it.
- Based: passes — The paper gives a reason why it holds.
It may state two separate claims as one.
The paper states this without a source or data behind it here, so there is nothing to check it against. The quote shows it is in the paper.
In the paper
“Contrary to the least effort scenario for 2035 where grid reinforcement for PV is least expensive, grid reinforcement costs for PV in the determined scenario for 2035 are most expensive, with a median value of 201M CHF (ranging between 195-206M CHF) as opposed to a median value of 129M CHF (ranging between 128-131M CHF) and 85M CHF for EV and HP respectively.”
§ Spatial analysis of distribution grid capacity and costs to enable massive deployment of PV, electric mobility and electric heating > 3.2. Determined effort scenario
plain- Asserted: passes — The authors put it forward as true.
- Checkable: passes — It can be checked against evidence.
- Load-bearing: passes — The paper’s conclusions depend on it.
- Based: passes — The paper gives a reason why it holds.
It may state two separate claims as one.
A result the paper reports from its own data — it cites no other source for it, so there is none to check. The quote shows it is in the paper.
In the paper
“In particular, PV causes 23% of the house connections undergoing voltage violation compared to 9% and 4% for EV and HP respectively.”
§ Spatial analysis of distribution grid capacity and costs to enable massive deployment of PV, electric mobility and electric heating > 3.3. Aggressive effort scenario
plaindirect- Asserted: passes — The authors put it forward as true.
- Checkable: passes — It can be checked against evidence.
- Load-bearing: passes — The paper’s conclusions depend on it.
- Based: passes — The paper gives a reason why it holds.
It may state two separate claims as one.
The paper states this without a source or data behind it here, so there is nothing to check it against. The quote shows it is in the paper.
In the paper
“Around 72% of the transformer stations within the supply area are in rural areas, 22% in suburban and 6% in urban areas.”
§ Spatial analysis of distribution grid capacity and costs to enable massive deployment of PV, electric mobility and electric heating > 2.6. Distribution grid modelling
plain- Asserted: passes — The authors put it forward as true.
- Checkable: passes — It can be checked against evidence.
- Load-bearing: fails — The paper’s conclusions may not depend on it.
- Based: passes — The paper gives a reason why it holds.
Probably not a substantial claim. The paper’s conclusions may not depend on it. It may state two separate claims as one.
A result the paper reports from its own data — it cites no other source for it, so there is none to check. The quote shows it is in the paper.
In the paper
“Finally, doubling PV deployment in 2050, relative to 2035, leads to 34% of the house connections having voltage violations along with 104 km of lines overloading, resulting in a median grid reinforcement cost of 400M CHF (ranging between 395-406M CHF) in 2050.”
§ Spatial analysis of distribution grid capacity and costs to enable massive deployment of PV, electric mobility and electric heating > 3.2. Determined effort scenario
plaindirect- Asserted: passes — The authors put it forward as true.
- Checkable: passes — It can be checked against evidence.
- Load-bearing: passes — The paper’s conclusions depend on it.
- Based: passes — The paper gives a reason why it holds.
It may state two separate claims as one.
A result the paper reports from its own data — it cites no other source for it, so there is none to check. The quote shows it is in the paper.
In the paper
“grid reinforcement costs markedly depend on the type of urban setting ranging between 51-213 CHF/kW 𝑝 , 46-1'385 CHF/kW and 34-143 CHF/kW for PV, HP and EV, respectively, with the higher limit corresponding to rural areas.”
§ Spatial analysis of distribution grid capacity and costs to enable massive deployment of PV, electric mobility and electric heating > Abstract
plaincorrelational- Asserted: passes — The authors put it forward as true.
- Checkable: passes — It can be checked against evidence.
- Load-bearing: passes — The paper’s conclusions depend on it.
- Based: passes — The paper gives a reason why it holds.
It may state two separate claims as one.
A result the paper reports from its own data — it cites no other source for it, so there is none to check. The quote shows it is in the paper.
In the paper
“In 2050, the expected PV capacity in the least effort scenario is 597 MW 𝑝 (100% higher than in 2035), causing a voltage violation in 11% of the house connections compared to only around 4% in case of HP (with a installed capacity of 230 MW in 2050).”
§ Spatial analysis of distribution grid capacity and costs to enable massive deployment of PV, electric mobility and electric heating > 3.1. Least effort scenario
plaindirect- Asserted: passes — The authors put it forward as true.
- Checkable: passes — It can be checked against evidence.
- Load-bearing: passes — The paper’s conclusions depend on it.
- Based: passes — The paper gives a reason why it holds.
It may state two separate claims as one.
A result the paper reports from its own data — it cites no other source for it, so there is none to check. The quote shows it is in the paper.
In the paper
“For PV, the distribution grid reinforcement costs range between 0.9B CHF and 4.3B CHF in 2035, corresponding to 4.2 GW 𝑝 (least effort 2035) and 21.1 GW 𝑝 (heroic effort 2035) respectively.”
§ Spatial analysis of distribution grid capacity and costs to enable massive deployment of PV, electric mobility and electric heating > 3.7. National distribution grid reinforcement costs
plaincorrelational- Asserted: passes — The authors put it forward as true.
- Checkable: passes — It can be checked against evidence.
- Load-bearing: passes — The paper’s conclusions depend on it.
- Based: passes — The paper gives a reason why it holds.
It may state two separate claims as one.
A result the paper reports from its own data — it cites no other source for it, so there is none to check. The quote shows it is in the paper.
In the paper
“This is significantly higher than for HP with a median value of 84M CHF (ranging between 84-86M CHF), representing less than 10% increase compared to 2035.”
§ Spatial analysis of distribution grid capacity and costs to enable massive deployment of PV, electric mobility and electric heating > 3.1. Least effort scenario
plaindirect- Asserted: passes — The authors put it forward as true.
- Checkable: passes — It can be checked against evidence.
- Load-bearing: passes — The paper’s conclusions depend on it.
- Based: passes — The paper gives a reason why it holds.
It may state two separate claims as one.
A result the paper reports from its own data — it cites no other source for it, so there is none to check. The quote shows it is in the paper.
In the paper
“For urban areas, the median (IQR) grid cost is 72 (25 to 243) CHF/kW 𝑝 , 57 (27 to 82) CHF/kW and 47 (25 to 77) CHF/kW for PV, HP and EV respectively.”
§ Spatial analysis of distribution grid capacity and costs to enable massive deployment of PV, electric mobility and electric heating > 3.4. Grid reinforcement costs per urban setting
plain- Asserted: passes — The authors put it forward as true.
- Checkable: passes — It can be checked against evidence.
- Load-bearing: passes — The paper’s conclusions depend on it.
- Based: passes — The paper gives a reason why it holds.
It may state two separate claims as one.
A result the paper reports from its own data — it cites no other source for it, so there is none to check. The quote shows it is in the paper.
In the paper
“The median (IQR values reported in brackets) specific grid reinforcement cost for HP in rural areas is 326 (66 to 2'607) CHF/kW, compared to 200 (65 to 619) CHF/kW 𝑝 and 95 (23 to 677) CHF/kW in case of PV and EV respectively.”
§ Spatial analysis of distribution grid capacity and costs to enable massive deployment of PV, electric mobility and electric heating > 3.4. Grid reinforcement costs per urban setting
plain- Asserted: passes — The authors put it forward as true.
- Checkable: passes — It can be checked against evidence.
- Load-bearing: passes — The paper’s conclusions depend on it.
- Based: passes — The paper gives a reason why it holds.
It may state two separate claims as one.
The paper states this without a source or data behind it here, so there is nothing to check it against. The quote shows it is in the paper.
In the paper
“PV causes around 44% of the house connections undergoing voltage violation compared to only 5% for HP.”
§ Spatial analysis of distribution grid capacity and costs to enable massive deployment of PV, electric mobility and electric heating > 3.3. Aggressive effort scenario
plaindirect- Asserted: passes — The authors put it forward as true.
- Checkable: passes — It can be checked against evidence.
- Load-bearing: passes — The paper’s conclusions depend on it.
- Based: passes — The paper gives a reason why it holds.
It may state two separate claims as one.
A result the paper reports from its own data — it cites no other source for it, so there is none to check. The quote shows it is in the paper.
In the paper
“The values reduce even further for PV, however, increase for HP and EV in urban areas, where the median (IQR) specific grid reinforcement costs are 63 (28 to 104) CHF/kW, 206 (81 to 397) CHF/kW and 51 (15 to 185) CHF/kW 𝑝 for EV, HP and PV respectively.”
§ Spatial analysis of distribution grid capacity and costs to enable massive deployment of PV, electric mobility and electric heating > 3.4. Grid reinforcement costs per urban setting
plain- Asserted: passes — The authors put it forward as true.
- Checkable: passes — It can be checked against evidence.
- Load-bearing: passes — The paper’s conclusions depend on it.
- Based: passes — The paper gives a reason why it holds.
It may state two separate claims as one.
A result the paper reports from its own data — it cites no other source for it, so there is none to check. The quote shows it is in the paper.
In the paper
“This results in 27% of the transformer stations requiring upgrading in case of HP compared to 20% for PV.”
§ Spatial analysis of distribution grid capacity and costs to enable massive deployment of PV, electric mobility and electric heating > 3.1. Least effort scenario
plaindirect- Asserted: passes — The authors put it forward as true.
- Checkable: passes — It can be checked against evidence.
- Load-bearing: passes — The paper’s conclusions depend on it.
- Based: passes — The paper gives a reason why it holds.
It may state two separate claims as one.
The paper states this without a source or data behind it here, so there is nothing to check it against. The quote shows it is in the paper.
In the paper
“This value increases up to 0.7B CHF if also wood and direct electric heating systems are replaced in addition to ones based on fossil fuels, amounting to a nominal HP electrical capacity of 7.8 GW (heroic effort 2050).”
§ Spatial analysis of distribution grid capacity and costs to enable massive deployment of PV, electric mobility and electric heating > 3.7. National distribution grid reinforcement costs
plaindirect- Asserted: passes — The authors put it forward as true.
- Checkable: passes — It can be checked against evidence.
- Load-bearing: passes — The paper’s conclusions depend on it.
- Based: passes — The paper gives a reason why it holds.
It may state two separate claims as one.
A result the paper reports from its own data — it cites no other source for it, so there is none to check. The quote shows it is in the paper.
In the paper
“For instance, across all scenarios presented in Section 3.4, the median specific grid reinforcement costs varies between 51-213foot_2 CHF/kW 𝑝 , 46-1385 CHF/kW and 34-143 CHF/kW for PV, HP and EV respectively, with the higher limit corresponding to rural areas.”
§ Spatial analysis of distribution grid capacity and costs to enable massive deployment of PV, electric mobility and electric heating > 4. Discussion
plaincorrelational- Asserted: passes — The authors put it forward as true.
- Checkable: passes — It can be checked against evidence.
- Load-bearing: passes — The paper’s conclusions depend on it.
- Based: passes — The paper gives a reason why it holds.
It may state two separate claims as one.
The paper states this without a source or data behind it here, so there is nothing to check it against. The quote shows it is in the paper.
In the paper
“Finally, assuming a 7 kW charger for each EV (equally distributed in rural, suburban and urban) in a fully electrified passenger cars fleet in 2050, would add up to 35.4 GW (heroic effort 2050), requiring an investment of 1.7B CHF for grid reinforcement.”
§ Spatial analysis of distribution grid capacity and costs to enable massive deployment of PV, electric mobility and electric heating > 3.7. National distribution grid reinforcement costs
hedgeddirect- Asserted: passes — The authors put it forward as true.
- Checkable: passes — It can be checked against evidence.
- Load-bearing: passes — The paper’s conclusions depend on it.
- Based: passes — The paper gives a reason why it holds.
It may state two separate claims as one.
In the paper
“Only a recent study assessed the impact of PV, HP and EV on a distribution grid, but it was carried out for a medium sized town (population of 40'000) in Germany covering only the residential sector [44].”
§ Spatial analysis of distribution grid capacity and costs to enable massive deployment of PV, electric mobility and electric heating > 1.1. Literature review and research objectives
What the sources say
- Not matchedcites [44] Tao Mu PH. Impact of high penetration of electric vehicles, heat pumps and photovoltaic generation on distribution grids – an analysis of a german case. In: 3rd E-Mobility Integration Symposium 2019. 2019.
Couldn’t be matched to a paper in Crossref, so it can’t be checked.
plainSingle case- Asserted: passes — The authors put it forward as true.
- Checkable: passes — It can be checked against evidence.
- Load-bearing: passes — The paper’s conclusions depend on it.
- Based: passes — The paper gives a reason why it holds.
It may state two separate claims as one.
- Not matched
In the paper
“Since estimates of grid reinforcement costs are seldomly reported by the distribution system operators and the data availability at high RE penetration is scarce [32]”
§ Spatial analysis of distribution grid capacity and costs to enable massive deployment of PV, electric mobility and electric heating > 1. Introduction
What the sources say
- Not checked — no full text of the sourcecites [32] Heptonstall, 2020, A systematic review of the costs and impacts of integrating variable renewables into power grids, Nat Energy source
plain- Asserted: passes — The authors put it forward as true.
- Checkable: passes — It can be checked against evidence.
- Load-bearing: passes — The paper’s conclusions depend on it.
- Based: passes — The paper gives a reason why it holds.
It may state two separate claims as one.
A conclusion the paper draws from its own results — it cites no other source for it, so there is none to check. The quote shows it is in the paper.
In the paper
“The reason for higher costs in rural areas is because the grid in rural area is generally weaker and more spread out.It is therefore more prone to voltage violation issues due to differences in length and strength of the grid network compared to the grid in urban area.”
§ Spatial analysis of distribution grid capacity and costs to enable massive deployment of PV, electric mobility and electric heating > 3.4. Grid reinforcement costs per urban setting
plaindirect- Asserted: passes — The authors put it forward as true.
- Checkable: passes — It can be checked against evidence.
- Load-bearing: passes — The paper’s conclusions depend on it.
- Based: passes — The paper gives a reason why it holds.
It may state two separate claims as one.
In the paper
“The following cases are considered as voltage limit violations: 1.A voltage increase of more than 3% due to PV power infeed compared to the situation without PV power infeed according to the DACHCZ technical rules for assessing network perturbations [63]. 2. The voltage at any point in the distribution grid is lower than 90% of the nominal voltage for load simulations according to EN 50160 [63].”
§ Spatial analysis of distribution grid capacity and costs to enable massive deployment of PV, electric mobility and electric heating > 2.6. Distribution grid modelling
What the sources say
- Not matchedcites [63] Energie, 2017
Couldn’t be matched to a paper in Crossref, so it can’t be checked.
plaindirect- Asserted: passes — The authors put it forward as true.
- Checkable: passes — It can be checked against evidence.
- Load-bearing: passes — The paper’s conclusions depend on it.
- Based: passes — The paper gives a reason why it holds.
Probably not a substantial claim. It may state two separate claims as one.
- Not matched
A conclusion the paper draws from its own results — it cites no other source for it, so there is none to check. The quote shows it is in the paper.
In the paper
“Interestingly, HP leads to more line overloading compared to PV, despite the fact that HP installed capacity is one third of PV capacity.”
§ Spatial analysis of distribution grid capacity and costs to enable massive deployment of PV, electric mobility and electric heating > 3.1. Least effort scenario
plaindirect- Asserted: passes — The authors put it forward as true.
- Checkable: passes — It can be checked against evidence.
- Load-bearing: passes — The paper’s conclusions depend on it.
- Based: passes — The paper gives a reason why it holds.
It may state two separate claims as one.
None of the sources cited for this claim have been checked yet.
In the paper
“In short, the studies on grid adequacy indicate that grid reinforcement is not needed with low diffusion of EV, HP and PV (e.g. up to 15%), with the exception of EV charged during peak hours, which however does become necessary for higher penetration levels.”
§ Spatial analysis of distribution grid capacity and costs to enable massive deployment of PV, electric mobility and electric heating > 1.1. Literature review and research objectives
hedgeddirect- Asserted: passes — The authors put it forward as true.
- Checkable: passes — It can be checked against evidence.
- Load-bearing: passes — The paper’s conclusions depend on it.
- Based: passes — The paper gives a reason why it holds.
Probably not a substantial claim. It may state two separate claims as one.
What the paper did — it cites no source for this, so there is none to check. The quote shows it is in the paper.
In the paper
“A large-scale distribution grid planning model with a high spatial resolution, developed and operated by the DSO (BKW), is used to calculate the required network investment for the different future levels of technology penetration according to the scenarios defined in Section 2.5.The model consists of all electrical components of the low voltage grid, which are exported from BKW's GIS, starting at”
§ Spatial analysis of distribution grid capacity and costs to enable massive deployment of PV, electric mobility and electric heating > 2.6. Distribution grid modelling
plain- Asserted: passes — The authors put it forward as true.
- Checkable: passes — It can be checked against evidence.
- Load-bearing: passes — The paper’s conclusions depend on it.
- Based: passes — The paper gives a reason why it holds.
Probably not a substantial claim. It may state two separate claims as one. The quote only partly states this claim.
What the paper did — it cites no source for this, so there is none to check. The quote shows it is in the paper.
In the paper
“We do not consider PV self consumption and demand side management as this study deals with preparing the grid for the worst case scenarios.”
§ Spatial analysis of distribution grid capacity and costs to enable massive deployment of PV, electric mobility and electric heating > 2.5. Scenarios
plaindirect- Asserted: passes — The authors put it forward as true.
- Checkable: passes — It can be checked against evidence.
- Load-bearing: passes — The paper’s conclusions depend on it.
- Based: passes — The paper gives a reason why it holds.
Probably not a substantial claim. It may state two separate claims as one.
A claim is checked only against the cited paper’s full text, never its abstract, and none is available for its sources.
In the paper
“Battery storage systems are becoming very attractive since they can secure grid stability, improve asset utilisation and potentially defer grid reinforcements [35,37].”
§ Spatial analysis of distribution grid capacity and costs to enable massive deployment of PV, electric mobility and electric heating > 1. Introduction
What the sources say
- Not checked — no full text of the sourcecites [35] Van Der Burgt, 2015, Grid impact of charging electric vehicles; study cases in Denmark, Germany and the Netherlands source
- Not checked — no full text of the sourcecites [37] Segundo Sevilla, 2018, Techno-economic analysis of battery storage and curtailment in a distribution grid with high PV penetration, J Energy Storage source
plainconditional- Asserted: passes — The authors put it forward as true.
- Checkable: passes — It can be checked against evidence.
- Load-bearing: fails — The paper’s conclusions may not depend on it.
- Based: passes — The paper gives a reason why it holds.
Probably not a substantial claim. The paper’s conclusions may not depend on it. It may state two separate claims as one.
In the paper
“However, this study neither discusses the cost of grid reinforcement nor potential solutions to avoid grid reinforcement.”
§ Spatial analysis of distribution grid capacity and costs to enable massive deployment of PV, electric mobility and electric heating > 1.1. Literature review and research objectives
What the sources say
- Not matchedcites [44] Tao Mu PH. Impact of high penetration of electric vehicles, heat pumps and photovoltaic generation on distribution grids – an analysis of a german case. In: 3rd E-Mobility Integration Symposium 2019. 2019.
Couldn’t be matched to a paper in Crossref, so it can’t be checked.
plain- Asserted: passes — The authors put it forward as true.
- Checkable: passes — It can be checked against evidence.
- Load-bearing: passes — The paper’s conclusions depend on it.
- Based: passes — The paper gives a reason why it holds.
It may state two separate claims as one.
- Not matched
A conclusion the paper draws from its own results — it cites no other source for it, so there is none to check. The quote shows it is in the paper.
In the paper
“Interestingly, the last point on the PV graph showcasing the heroic PV penetration (1480 MWp) suggests a saturation (Fig. 12(a)).This implies that the linear dependency does not hold for very high PV capacities.”
§ Spatial analysis of distribution grid capacity and costs to enable massive deployment of PV, electric mobility and electric heating > 3.5. Regression analysis
hedged- Asserted: passes — The authors put it forward as true.
- Checkable: passes — It can be checked against evidence.
- Load-bearing: unclear — It is unclear whether the paper’s conclusions depend on it.
- Based: passes — The paper gives a reason why it holds.
It may state two separate claims as one.
What the paper did — it cites no source for this, so there is none to check. The quote shows it is in the paper.
In the paper
“However, to obtain more robust results, we perform several simulation tests to understand the sensitivity of grid reinforcement costs to spatial diffusion of technologies.”
§ Spatial analysis of distribution grid capacity and costs to enable massive deployment of PV, electric mobility and electric heating > 2.5. Scenarios
plain- Asserted: passes — The authors put it forward as true.
- Checkable: passes — It can be checked against evidence.
- Load-bearing: passes — The paper’s conclusions depend on it.
- Based: passes — The paper gives a reason why it holds.
Probably not a substantial claim.
None of the sources cited for this claim have been checked yet.
In the paper
“PV can create a reverse power flow in the distribution feeders, potentially resulting in voltage violations and overloading of the distribution lines [19][20][21].”
§ Spatial analysis of distribution grid capacity and costs to enable massive deployment of PV, electric mobility and electric heating > 1. Introduction
What the sources say
- Not checked — no full text of the sourcecites [19] Punyachai R, Ongsakul W, Schmidt U. Impact of high solar rooftop PV penetration on voltage profiles in distribution systems. In: 2014 International Conference and Utility Exhibition on Green Energy for Sustainable Development. 2014, p. 1–7.
- Not matchedcites [20] Bilton, 2014
Couldn’t be matched to a paper in Crossref, so it can’t be checked.
- Not checked — no full text of the sourcecites [21] Cohen, 2016, Effects of distributed PV generation on california’s distribution system, Part 1: Engineering simulations, Sol Energy source
plainconditional- Asserted: passes — The authors put it forward as true.
- Checkable: passes — It can be checked against evidence.
- Load-bearing: passes — The paper’s conclusions depend on it.
- Based: passes — The paper gives a reason why it holds.
It may state two separate claims as one.
In the paper
“However, on the other hand, it is expected that the CAPEX of stationary Li-ion batteries will decrease by 54%-61% by 2030 [72], making batteries a good flexible solution to support distribution grid expansion.”
§ Spatial analysis of distribution grid capacity and costs to enable massive deployment of PV, electric mobility and electric heating > 4. Discussion
What the sources say
- Not matchedcites [72] IRENA (2017), 2017
Couldn’t be matched to a paper in Crossref, so it can’t be checked.
hedgeddirect- Asserted: passes — The authors put it forward as true.
- Checkable: passes — It can be checked against evidence.
- Load-bearing: passes — The paper’s conclusions depend on it.
- Based: passes — The paper gives a reason why it holds.
It may state two separate claims as one.
- Not matched
None of the sources cited for this claim have been checked yet.
In the paper
“Moreover, batteries can provide up to 15 different services at the grid, generation and end-user level [73,74] and combining different applications (also referred to as benefit stacking) would substantially increase the value of batteries, and their profitability as shown by previous studies [75][76][77].”
§ Spatial analysis of distribution grid capacity and costs to enable massive deployment of PV, electric mobility and electric heating > 4. Discussion
What the sources say
- Not matchedcites [73] Hart, 2016
Couldn’t be matched to a paper in Crossref, so it can’t be checked.
- Not matchedcites [74] IRENA, 2014
Couldn’t be matched to a paper in Crossref, so it can’t be checked.
- Not checked — no full text of the sourcecites [75] Parra, 2019, The nature of combining energy storage applications for residential battery technology, Appl Energy source
- Not checked — no full text of the sourcecites [76] Stephan, 2016, Limiting the public cost of stationary battery deployment by combining applications, Nat Energy source
- Not checked — no full text of the sourcecites [77] Pena-Bello, 2019, Optimized PV-coupled battery systems for combining applications: Impact of battery technology and geography, Renew Sustain Energy Rev source
plaindirect- Asserted: passes — The authors put it forward as true.
- Checkable: passes — It can be checked against evidence.
- Load-bearing: fails — The paper’s conclusions may not depend on it.
- Based: passes — The paper gives a reason why it holds.
Probably not a substantial claim. The paper’s conclusions may not depend on it. It may state two separate claims as one.
- Not matched
In the paper
“For instance, a recent study on spatial diffusion patterns of PV projects shows that rural areas in Switzerland tend to be hot spots for PV installations compared to urban areas which have relatively less number of PV projects [71].”
§ Spatial analysis of distribution grid capacity and costs to enable massive deployment of PV, electric mobility and electric heating > 4. Discussion
What the sources say
- Not checked — no full text of the sourcecites [71] Thormeyer, 2020, Spatially-explicit models should consider real-world diffusion of renewable electricity: Solar PV example in Switzerland, Renew Energy source
plaincorrelational- Asserted: passes — The authors put it forward as true.
- Checkable: passes — It can be checked against evidence.
- Load-bearing: fails — The paper’s conclusions may not depend on it.
- Based: passes — The paper gives a reason why it holds.
Probably not a substantial claim. The paper’s conclusions may not depend on it.
None of the sources cited for this claim have been checked yet.
In the paper
“Community energy storage (CES) has also been suggested as a possible strategy to reduce the CAPEX and OPEX of batteries, regarding individual home systems [73,78].”
§ Spatial analysis of distribution grid capacity and costs to enable massive deployment of PV, electric mobility and electric heating > 4. Discussion
What the sources say
- Not matchedcites [73] Hart, 2016
Couldn’t be matched to a paper in Crossref, so it can’t be checked.
- Not checked — no full text of the sourcecites [78] Parra, 2017, An interdisciplinary review of energy storage for communities: Challenges and perspectives, Renew Sustain Energy Rev source
hedgedconditional- Asserted: passes — The authors put it forward as true.
- Checkable: passes — It can be checked against evidence.
- Load-bearing: fails — The paper’s conclusions may not depend on it.
- Based: passes — The paper gives a reason why it holds.
Probably not a substantial claim. The paper’s conclusions may not depend on it.
- Not matched
The paper states this without a source or data behind it here, so there is nothing to check it against. The quote shows it is in the paper.
In the paper
“The total grid reinforcement cost is equal to the sum of cost for reinforcing the low, medium and high voltage grid.”
§ Spatial analysis of distribution grid capacity and costs to enable massive deployment of PV, electric mobility and electric heating > 4. Discussion
plain- Asserted: passes — The authors put it forward as true.
- Checkable: passes — It can be checked against evidence.
- Load-bearing: passes — The paper’s conclusions depend on it.
- Based: fails — The paper may give no reason why it holds.
Probably not a substantial claim. The paper may give no reason why it holds.
In the paper
“Since the lifetime of grid reinforcement is usually considered between 40-50 yrs [55], the replacement of batteries after 15 yrs would have to be considered in case the time period of distribution grid reinforcement deferral is assumed to be more than 15 yrs.This would make batteries more costly than grid reinforcement.”
§ Spatial analysis of distribution grid capacity and costs to enable massive deployment of PV, electric mobility and electric heating > 4. Discussion
What the sources say
- Not matchedcites [55] 2019
Couldn’t be matched to a paper in Crossref, so it can’t be checked.
hedgeddirect- Asserted: passes — The authors put it forward as true.
- Checkable: passes — It can be checked against evidence.
- Load-bearing: passes — The paper’s conclusions depend on it.
- Based: passes — The paper gives a reason why it holds.
It may state two separate claims as one.
- Not matched
A conclusion the paper draws from its own results — it cites no other source for it, so there is none to check. The quote shows it is in the paper.
In the paper
“Our GIS-based method can be used to quantify the impacts of PV, HP and EV on the low voltage distribution grids and our results help to plan the distribution grid infrastructure including sector coupling.”
§ Spatial analysis of distribution grid capacity and costs to enable massive deployment of PV, electric mobility and electric heating > 4. Discussion
plaindirect- Asserted: passes — The authors put it forward as true.
- Checkable: passes — It can be checked against evidence.
- Load-bearing: passes — The paper’s conclusions depend on it.
- Based: passes — The paper gives a reason why it holds.
It may state two separate claims as one.
None of the sources cited for this claim have been checked yet.
In the paper
“Under different ownership models, batteries as CES could benefit both consumers and DSO, creating a win-win relationship [37,73,78].”
§ Spatial analysis of distribution grid capacity and costs to enable massive deployment of PV, electric mobility and electric heating > 4. Discussion
What the sources say
- Not checked — no full text of the sourcecites [37] Segundo Sevilla, 2018, Techno-economic analysis of battery storage and curtailment in a distribution grid with high PV penetration, J Energy Storage source
- Not matchedcites [73] Hart, 2016
Couldn’t be matched to a paper in Crossref, so it can’t be checked.
- Not checked — no full text of the sourcecites [78] Parra, 2017, An interdisciplinary review of energy storage for communities: Challenges and perspectives, Renew Sustain Energy Rev source
hedgedconditional- Asserted: passes — The authors put it forward as true.
- Checkable: passes — It can be checked against evidence.
- Load-bearing: fails — The paper’s conclusions may not depend on it.
- Based: passes — The paper gives a reason why it holds.
Probably not a substantial claim. The paper’s conclusions may not depend on it.
The paper relies on this without support.
The supply area's distribution grid and technology deployment patterns are representative of Switzerland for scaling up national-level results.
“Finally, we scale up our results to the national level to evaluate the long-term grid impact of decarbonization in Switzerland.”
The authors state this as an assumption.
If grid violations cannot be eliminated using a simple reinforcement (upgrading) of the grid elements, a complete rebuilding of the affected part of the distribution grid network is assumed.
“If grid violations cannot be eliminated using a simple reinforcement (upgrading) of the grid elements, we assume a complete rebuilding of the affected part of the distribution grid network.”
The authors state this as an assumption.
The specific grid reinforcement costs per urban setting from the DSO's supply area are representative for the rest of the country.
“Thus, we assume that the specific grid reinforcement costs per urban setting from the DSO's supply area are representative for rest of the country.”
The authors state this as an assumption.
Capacity additions and grid reinforcement occur all at once.
“First, our model assumes that capacity additions and grid reinforcement occur all at once.”
The authors state this as an assumption.
The assumed grid reinforcement costs for transformers and line correspond to average costs.
“Secondly, the assumed grid reinforcement costs for transformers and line correspond to average costs.”
The authors state this as an assumption.
The study does not consider behind-the-meter flexibility, so reinforcement costs correspond to extreme cases without inherent behind-the-meter flexibility.
“This is not considered by our study, thus, our reinforcement costs correspond to extreme cases without inherent behind-the-meter flexibility.”
The authors state this as an assumption.
The number of households in Switzerland is 3.8M (assuming the same number as today).
“With 3.8M households in Switzerland (assuming the same number as today), the cost of reinforcement would translate to around 1'440 CHF and 2'900 CHF per household in 2035 and 2050, respectively (1 Swiss Franc = 1 CHF ≈ 1 USD).”
The authors state this as an assumption.
Planning costs or the change in operational costs are not considered in the grid reinforcement cost values.
“The values primarily represent investment costs for the physical grid, whereas planning costs or the change in operational costs are not considered.”
The authors state this as an assumption.
Other costs such as labour expenses and land development expenses are not taken into account for battery storage.
“Other costs such as labour expenses and land development expenses are not taken into account.”
The paper relies on this without support.
PV, HP and EV are highly relevant for climate change mitigation and challenging to integrate into the existing grid infrastructure.
“Considering the high relevance of PV, HP and EV for climate change mitigation and the challenges to integrate them in the existing grid infrastructure, this study aims to help various decision-makers such as the DSO, policy makers and regulators to better plan the future distribution grid infrastructure which maximizes renewable energy and sector coupling.”
The paper relies on this without support.
Lithium-ion batteries are a key flexibility option to enable further renewable energy penetration.
“Importantly, we also compare grid reinforcement with energy storage, assuming lithium-ion batteries, which are considered as a key flexibility option to enable further renewable energy penetration.”
Self-check
Percentages, sums and reported differences re-computed from the paper’s own numbers.
Each contradiction between two passages listed here was confirmed by an independent check.
Rated minor: it would not touch a result — a value no result rests on, a p-value that stays on the same side of the significance level, or a conflict that is clerical, resolved elsewhere in the paper, or outside its own findings.
In the paper
§ Spatial analysis of distribution grid capacity and costs to enable massive deployment of PV, electric mobility and electric heating > 2.5. Scenarios
“Since, we consider deployment of HP only in the residential sector, we do not consider heroic effort scenario for HP.”
§ Spatial analysis of distribution grid capacity and costs to enable massive deployment of PV, electric mobility and electric heating > 3.7. National distribution grid reinforcement costs
“This value increases up to 0.7B CHF if also wood and direct electric heating systems are replaced in addition to ones based on fossil fuels, amounting to a nominal HP electrical capacity of 7.8 GW (heroic effort 2050).”
Rated minor: it would not touch a result — a value no result rests on, a p-value that stays on the same side of the significance level, or a conflict that is clerical, resolved elsewhere in the paper, or outside its own findings.
In the paper
§ Spatial analysis of distribution grid capacity and costs to enable massive deployment of PV, electric mobility and electric heating > 3.4. Grid reinforcement costs per urban setting
“While comparing specific grid reinforcement costs per urban setting across technologies, we find that the median for EV is lower than for HP and PV.”
§ Spatial analysis of distribution grid capacity and costs to enable massive deployment of PV, electric mobility and electric heating > 3.4. Grid reinforcement costs per urban setting
“The values reduce even further for PV, however, increase for HP and EV in urban areas, where the median (IQR) specific grid reinforcement costs are 63 (28 to 104) CHF/kW, 206 (81 to 397) CHF/kW and 51 (15 to 185) CHF/kW 𝑝 for EV, HP and PV respectively.”
Citations
Cites
Assessment of the Impact of Plug-in Electric Vehicles on Distribution Networks
Pieltain Fernandez, L., Gomez San Roman, T., Cossent, R., Mateo Domingo, C., & Frias, P. (2011) · IEEE Transactions on Power Systems · doi:10.1109/tpwrs.2010.2049133 · Cited by 1,245
International Renewable Energy Agency
(2021) · Permanent missions to the United Nations · doi:10.18356/9789210056755c212 · Cited by 1,055
Hesse, H. C., Schimpe, M., Kucevic, D., & Jossen, A. (2017) · Energies · doi:10.3390/en10122107 · Cited by 839
State-of-the-art of hosting capacity in modern power systems with distributed generation
Ismael, S. M., Abdel Aleem, S. H. E., Abdelaziz, A. Y., & Zobaa, A. F. (2019) · Renewable Energy · doi:10.1016/j.renene.2018.07.008 · Cited by 599
Improved Low Voltage Grid-Integration of Photovoltaic Systems in Germany
Stetz, T., Marten, F., & Braun, M. (2012) · IEEE Transactions on Sustainable Energy · doi:10.1109/tste.2012.2198925 · Cited by 469
DOE/EPRI Electricity Storage Handbook in Collaboration with NRECA.
Akhil, A., Huff, G., Currier, A., Kaun, B., Rastler, D., Chen, S., Cotter, A., Bradshaw, D. T., & Gauntlett, W. (2015) · doi:10.2172/1170618 · Cited by 431
A review of domestic heat pumps
Staffell, I., Brett, D. J. L., Brandon, N. P., & Hawkes, A. D. (2012) · Energy & Environmental Science · doi:10.1039/c2ee22653g · Cited by 395
2011 IEEE Power and Energy Society General Meeting
(2011) · IEEE Power and Energy Magazine · doi:10.1109/mpe.2011.940340 · Cited by 375
DOE/EPRI Electricity Storage Handbook in Collaboration with NRECA
Sandia National Labs., A., Akhil, A., USDOE Office of Electricity Delivery and Energy Reliability (OE), Huff, G., Currier, A., Hernandez, J., Bender, D., Kaun, B., Rastler, D., Chen, S., et al. (2016) · doi:10.2172/1431469 · Cited by 339
A systematic review of the costs and impacts of integrating variable renewables into power grids
Heptonstall, P. J., & Gross, R. J. K. (2020) · Nature Energy · doi:10.1038/s41560-020-00695-4 · Cited by 321
Research works printed but not linked: 4
- IRENA, 2019, Global energy transformation: A roadmap to 2050 (2019 edition)
- Tao Mu PH. Impact of high penetration of electric vehicles, heat pumps and photovoltaic generation on distribution grids – an analysis of a german case. In: 3rd E-Mobility Integration Symposium 2019. 2019.
- Streicher, 2020, Cost-effectiveness of large-scale deep energy retrofit packages for residential buildings under different economic assessment approaches, Energy Build, 215, 10.1016/j.enbuild.2020.109870 · DOI · Paper page
- Zinaman, 2020, An overview of behind-the-meter solar-plus-storage regulatory design: Approaches and case studies to inform international applications (Report no. NREL/TP-7A40-75283), NREL Report, 1
Cited by
Sorted by citations
Integration of prosumer peer-to-peer trading decisions into energy community modelling
Pena-Bello, A., Parra, D., Herberz, M., et al. (2021) · Nature Energy · doi:10.1038/s41560-021-00950-2 · Cited by 117
Self-citationMehta, P., & Tiefenbeck, V. (2022) · Sustainable Cities and Society · doi:10.1016/j.scs.2022.104178 · Cited by 92
Damianakis, N., Mouli, G. R. C., Bauer, P., & Yu, Y. (2023) · Applied Energy · doi:10.1016/j.apenergy.2023.121878 · Cited by 80
Electric vehicle hosting capacity analysis: Challenges and solutions
Karmaker, A. K., Prakash, K., Siddique, M. N. I., Hossain, M. A., & Pota, H. R. (2023) · Renewable and Sustainable Energy Reviews · doi:10.1016/j.rser.2023.113916 · Cited by 90
Distributed photovoltaics provides key benefits for a highly renewable European energy system
Rahdan, P., Zeyen, E., Gallego‐Castillo, C., et al. (2024) · Applied Energy · doi:10.1016/j.apenergy.2024.122721 · Cited by 72
Metadata
- Authors
- Gupta, R., Pena-Bello, A., Streicher, K. N., Roduner, C., Farhat, Y., Thöni, D., Patel, M. K., & Parra, D.
- Affiliations
- University of Geneva (CH)
- Corresponding author
- Gupta, Ruchi
- Venue
- Applied Energy
- Publisher
- Elsevier BV
- Published
- 2021-04
- Volume
- 287
- Pages
- 116504
- ISSN
- 0306-2619 (ISSN-L)
- OpenAlex
- W3126603060
- Cited by
- 161
- References
- 55
- Citations by year
- 2026: 21 · 2025: 38 · 2024: 31 · 2023: 34 · 2022: 24 · 2021: 13
- FWCI
- 7.34
- Type
- journal article
- Language
- en
- Open access
- hybrid
- doi.org
- Licence
- Locations
- Applied Energy (publishedVersion, cc-by)
- Archive ouverte UNIGE (University of Geneva) (publishedVersion, other-oa)
- RePEc: Research Papers in Economics (submittedVersion)
- Archive ouverte UNIGE (University of Geneva) (submittedVersion, cc-by)
- Funders
- Innosuisse - Schweizerische Agentur für Innovationsförderung
- Topics
- Physical Sciences › Engineering › Electrical and Electronic Engineering › Optimal Power Flow Distribution
- Physical Sciences › Engineering › Electrical and Electronic Engineering › Electric Vehicles and Infrastructure
- Physical Sciences › Engineering › Electrical and Electronic Engineering › Integrated Energy Systems Optimization
- Keywords
- photovoltaics, electric heat pumps, electric vehicles, low-voltage distribution networks, voltage violation, line overload, battery energy storage, decarbonization, flexibility measures, urban-rural differences, transformer substation
About these checks
Registry, retraction, Cites and statistics results are computed, not judged, with one exception: a printed reference that no index lists is read once by a model before it counts as a citation error. Claims are extracted by a model and kept only when their quote appears verbatim in the text; each cited source is then checked, with a model’s help, for whether it says what the claim relies on. Those verdicts can be wrong — read the claim’s quote and the cited source before relying on one.
A language model drew the claims from the paper on 2026-10-28, under version 3 of the claim definition (model deepseek-v4.1-flash, prompt extract-v3).
A second model labelled each claim on 2026-10-28 (model jev-1.13-20260917, definition revision gold-guideline-v0.2).
Cited sources are checked with a language model’s help (gpt-6-sol).
Statistics and arithmetic are recomputed, not judged.
Confidence bands are shown only for fields calibrated on our annotated test set. None is calibrated yet, so no band is shown.
What counts as a claim ›How we measure confidence ›How we check this ›
Are you an author, or do you see a problem with this page? Request a review
